
ABSTRACT
In this study, the erosion of the nocturnal boundary layer (NBL) was analyzed in the central Amazon during the dry season of 2014, using data from the GoAmazon 2014/5 Project and high-resolution model outputs (PArallelized Les Model - PALM). The dataset consisted of in situ (radiosonde) and remote sensing instruments measurements (Ceilometer, Lidar, Wind Profiler, microwave radiometer, and SODAR). The results showed that the NBL erosion occurred, on average, two hours after sunrise (06:00 local time), and the sensible heat flux provided more than 50% of the sensible heating necessary for the erosion process to occur. After the erosion, the convective phase developed quickly (175.2 m h-1). The measurements of the remote sensors showed that the Ceilometer, in general, presented satisfactory results in relation to the radiosondes for measuring the height of the planetary boundary layer. The PALM simulations represented well the NBL erosion, with a small underestimation (≈ 20 m) at the beginning of this phase. In the final phase of NBL erosion and in the initial stage of the development of the convective boundary layer (CBL), the model presented satisfactory results, with heights of CBL ranging from 800 m to 1,650 m, respectively.
Keywords:
planetary boundary layer; turbulent kinetic energy; heat flux; NBL erosion
RESUMO
Este estudo teve como objetivo analisar a erosão da camada limite noturna (CLN) na Amazônia central durante a estação seca de 2014, usando dados do Projeto GoAmazon 2014/5 e saídas do modelo de alta resolução (PArallelized Les Model - PALM). O conjunto de dados consistiu de medidas por instrumentos in situ (radiossonda) e sensoriamento remoto (Ceilometer, Lidar, Wind Profiler, radiômetro de microondas e SODAR). Os resultados mostraram que a erosão da CLN ocorreu, em média, duas horas após o nascer do sol (06:00 hora local), e o fluxo de calor sensível forneceu mais de 50% do aquecimento necessário para o processo de erosão ocorrer. Após a erosão, a fase convectiva se desenvolveu rapidamente (175,2 m h-1). As medidas dos sensores remotos mostraram que o Ceilometer, em geral, apresentou resultados satisfatórios em relação às radiossondas para medidas da altura da camada limite planetária. As simulações PALM representaram bem a erosão da CLN, com uma pequena subestimação (≈ 20 m) no início desta fase. Na fase final da erosão da CLN e no estágio inicial do desenvolvimento da camada limite convectiva (CLC), o modelo apresentou resultados satisfatórios, com alturas variando de 800 m a 1.650 m, respectivamente.
Palavras-chave:
camada limite planetária; energia cinética turbulenta; fluxo de calor; erosão da CLN
INTRODUCTION
The daily cycle of the planetary boundary layer (PBL) responds to surface heating due to solar radiation (Stull 1988Stull, R.B. 1988. An Introduction to Boundary Layer Meteorology . 1st ed. Springer, Dodrecht, 670p.). It consists of a convective phase during the day, the convective boundary layer (CBL) and a stable phase during the night, the nocturnal boundary layer (NBL). Because of this variation throughout the day, the determination of the daily cycle of the height of the PBL has been the focus of much research (Santos et al. 2007Santos, R.M.N.; Fisch, G.; Dolman, A.J.; Waterloo, M. 2007. Modelagem da camada limite noturna (CLN) durante a época úmida na Amazônia, sob diferentes condições de desenvolvimento. Revista Brasileira de Meteorologia , 22: 387-407.; Englberger and Dörnbrack 2017Englberger, A.; Dörnbrack, A. 2017. Impact of neutral boundary-layer turbulence on wind-turbine wakes: a numerical modelling study. Boundary-Layer Meteorology , 162: 427-449.; Ramos et al. 2018Ramos, D.; Fernandez, J.P.R.; Fisch, G. 2018. Evolution of the Planetary Boundary Layer on the northern coast of Brazil during the CHUVA campaign. Atmospheric Research, 203: 298-310.). The PBL is also a link between the surface and the free atmosphere (Neves and Fisch 2015Neves, T.T.A.; Fisch, G. 2015. The daily cycle of the atmospheric boundary Layer heights over pasture site in Amazonia. American Journal of Environmental Engineering, 5: 39-44.). Its depth is a variable that describes the structure of the boundary layer (Huang et al. 2017Huang, M.; Gao, Z.; Miao, S.; Chen, F.; Lemone, M.A.; Hu, F.; Wang, L. 2017. Estimate of boundary-layer depth over Beijing, China, using doppler lidar data during SURF-2015. Boundary-Layer Meteorology , 162: 503-522.), and is important in a number of applications such as the forecast of dissipation of pollutants and weather forecasts (Barlage et al. 2016Barlage, M.; Miao, S.; Chen, F. 2016. Impact of physics parameterizations on high-resolution weather prediction over two Chinese megacities. Journal of Geophysical Research: Atmospheres, 121: 4487-4498. ).
The PBL transition from night to morning, also known as erosion of the NBL, is initiated when the surface-sensible heat flux becomes positive and a surface entrainment mixture layer grows on the inversion surface (Pino et al. 2006Pino, D.; Jonker, H.J.J.; Arellano, J.V.G. de; Dosio, A. 2006. Role of shear and the inversion strength during sunset turbulence over land: characteristic length scales. Boundary-Layer Meteorology , 121: 537-556.). The erosion of the NBL occurs when the atmosphere passes from a state of thermal stratification, with little or no turbulence, to a state in which convective processes begin to predominate. Therefore, it has a direct influence on the development of the CBL, which may also influence convection throughout the day (transition from shallow to deep convection) (Tawfik and Dirmeyer 2014Tawfik, A.B.; Dirmeyer, P.A. 2014. A process-based framework for quantifying the atmospheric preconditioning of surface-triggered convection. Geophysical Research Letters. 41: 173-178.; Itterly et al. 2016Itterly, K.F.; Taylor, P.C.; Dodson, J.B.; Tawfik, A.B. 2016. On the sensitivity of the diurnal cycle in the Amazonto convective intensity. Journal of Geophysical Research: Atmospheres . 121: 8186-8208.).
Currently, a powerful tool for micrometeorological studies is high resolution simulation using a Large Eddy Simulation (LES) model, due to its ability to resolve and simulate the eddies and their vertical energy transfer. One of such models is the PALM (PArallelized Les Model), described in detail by Maronga et al. (2015Maronga, B.; Gryschka, M.; Heinze, R.; Hoffmann, F.; Kanani-Sühring, F.; Keck, M.; Ketelsen, K.; Letzel, M.O.; Sühring, M.; Raasch, S. 2015. The Parallelized Large-Eddy Simulation Model (PALM) version 4.0 for atmospheric and oceanic flows: model formulation, recent developments, and future perspectives. Geoscientific Model Development, 8: 2515-2551.). It has been used in studies on improving the understanding of the height of PBL, entrainment fluxes, and the distribution of kinetic energy budgets (e.g. Kanani-Sühring and Raasch 2017Kanani-Sühring, F.; Raasch, S. 2017. Enhanced scalar concentrations and fluxes in the lee of forest patches: a large-eddy simulation study. Boundary-Layer Meteorology , 164: 1-17.; Neves et al. 2018Neves, T.; Fisch, G.; Raasch, S. 2018. Local convection and turbulence in the Amazonia using large eddy simulation model. Atmosphere, 9: 399-412.). Neves (2015Neves, T.T.A.T. 2015. Análise de turbulência e convecção na Amazônia utilizando o modelo PALM-LES. Doctoral thesis, Instituto Nacional de Pesquisas Espaciais, Brazil. 159p. (http://urlib.net/sid.inpe.br/mtc-m21b/2015/10.18.05.54)
http://urlib.net/sid.inpe.br/mtc-m21b/20...
) used PALM to analyze the characteristics of CBL in the Amazon region through simulations of turbulent fluxes, moisture and momentum. It concluded that PALM was efficient for CBL simulations in tropical regions, both in forest and pasture, and in different seasons.
In recent years there has been an increase in PBL studies for several types of biomes, but in the Amazon region, where biosphere-atmosphere interactions are intense and highly complex (Neves and Fisch 2015Neves, T.T.A.; Fisch, G. 2015. The daily cycle of the atmospheric boundary Layer heights over pasture site in Amazonia. American Journal of Environmental Engineering, 5: 39-44.; Marengo et al. 2017Marengo, J.A.; Fisch, G.; Alves, L.M.; Sousa, N.V.; Fu, R.; Zhuang, Y. 2017. Meteorological context of the onset and end of the rainy season in Central Amazonia during the GoAmazon2014/5. Atmospheric Chemistry and Physics , 17: 7671-7681.; Carneiro et al. 2018Carneiro, R.G.; Henkes, A.; Fisch, G.; Borges, C.K. 2018. Estudo do ciclo diário da camada limite planetária durante a estação chuvosa da Amazônia (GOAMAZON 2014/15). Ciência e Natura , 40: 63-68.; Neves et al. 2018), the parameters that describe its structure are still little understood.
In this study, the erosion of the NBL was analyzed for a period of intense observation during the dry season in the central Amazon from data of remote sensing instruments, to determine the influence of this phase on the development of the CBL. Specifically, the objectives were (a) to determine the daily cycle of the PBL height using remote sensors; and (b) to evaluate the functionality of the simulations of erosion of the NBL phase generated by PALM, for a representative day of this period in the central Amazon region.
MATERIAL AND METHODS
The data were collected at the experimental site “T3” of the GoAmazon Project 2014/5 (https://campaign.arm.gov/goamazon2014/) (03°12’36”S; 60°36’00”W), located 80 km west of Manaus, Amazonas state, in the Brazilian Amazon region (Martin et al. 2016Martin, S.T.; Artaxo, P.; Machado, L.A.T.; Manzi, A.O.; Souza, R.A.F.; Schumacher, C.; et al. 2016. Introduction: observations and modeling of the Green Ocean Amazon (GoAmazon2014/5). Atmospheric Chemistry Physics, 16: 4785-4797.). The site is a pasture area (2.5 km × 2.0 km) surrounded by forest. The analysis concentrated on the data collected during the dry season from September 1 to October 15, 2014, corresponding to the second of intense observation periods (IOP2) of the project.
The GoAmazon 2014/5 project collected data on the vertical structure of the PBL, to characterize the convection, its development and evolution using a variety of instruments to measure the behavior of surface and atmospheric variables that are important for understanding biosphere-atmosphere interactions (Marengo et al. 2017Marengo, J.A.; Fisch, G.; Alves, L.M.; Sousa, N.V.; Fu, R.; Zhuang, Y. 2017. Meteorological context of the onset and end of the rainy season in Central Amazonia during the GoAmazon2014/5. Atmospheric Chemistry and Physics , 17: 7671-7681.; Machado et al. 2018Machado, L.A.; Calheiros, A.J.; Biscaro, T.; Giangrande, S.; Dias, M.A.; Cecchini, M.A.; et al. 2018. Overview: Precipitation characteristics and sensitivities to environmental conditions during GoAmazon2014/5 and ACRIDICON-CHUVA. Atmospheric Chemistry and Physics , 18: 6461-6482.).
The turbulent fluxes were estimated through an Eddy Covariance system composed of coupling between 3D sonic anemometer, WindMaster Pro model (Gill Instruments, UK), and the Infrared Gas Analyser (IRGA) system of CO2/H2O, LI-7500 model (Li-cor inc., USA). In order to characterize the rainfall totals of IOP2, we used data from a Parsivel2 Disdrometer from OTT Hydromet GmbH (Germany), with a time resolution of 10 minutes. The observations of the PBL heights were made using remote sensing methods, which were compared with in situ measurements of radiosondes.
Radiosondes
The radiosonde system (RS) used in the experiment was DIGICORA (MW12) (Vaisala Inc. Finland), which uses radiosondes RS92SGP. Soundings were performed around the standard synoptic times (GMT-4 h), at 02:00, 08:00, 11:00, 14:00 and 20:00 local time (LT). The potential temperature and specific humidity profiles were used to determine the PBL heights, through the method of the level of the cap inversion (profile method), as described in Santos et al. (2007Santos, R.M.N.; Fisch, G.; Dolman, A.J.; Waterloo, M. 2007. Modelagem da camada limite noturna (CLN) durante a época úmida na Amazônia, sob diferentes condições de desenvolvimento. Revista Brasileira de Meteorologia , 22: 387-407.). The heights obtained by radiosondes were considered as the real (or true) value.
Wind profiler (WP)
Currently, measurements by remote sensors as Ceilometers, SODAR and Wind Profiler Radars (WP) are widely used for PBL measurements. In the study site, measurements of the Wind Profiler and RASS (radio acoustic sound system) RWP915 model from Vaisala Inc. (Finland) were used to continuously estimate the PBL height. We followed the methodology used by Wang et al. (2016Wang, C.; Shi, H.; Jin, L.; Chen, H.; Wen, H. 2016. Measuring boundary-layer height under clear and cloudy conditions using three instruments. Particuology, 28: 15-21.), who estimated the PBL height through the vertical profile of the electromagnetic refractive index of the WP, which has its maximum value at the top of the PBL.
SODAR
During the experiment, a SODAR (Sonic Detection and Ranging) was installed. This monostatic equipment consists of an emitting/receiving antenna. From the SODAR the vertical profiles of wind speed and direction were measured in time intervals of 30 minutes, and a maximum range of 400 m in height. The NBL height values were determined using the concept of the maximum wind height as suggested by Neves and Fisch (2011Neves, T.T.A.; Fisch, G. 2011. Camada Limite Noturna sobre pastagem na Amazônia. Revista Brasileira de Meteorologia, 24: 619-628.).
Ceilometer
The height of the PBL was also monitored using a Ceilometer CL31 model (Vaisala, Inc. Finland). This remote sensing instrument records the intensity of the optical backscatter at the near-infrared wavelength (910 nm), through the emission of a vertical light pulse, with a temporal resolution of 16 seconds (Carneiro et al. 2016Carneiro, R.G.; Fisch, G.; Kaufmann, T. 2016. Determinação da altura da camada limite planetária na floresta Amazônica utilizando um Ceilometer. Ciência e Natura, 38: 460-466.). This instrument provides three measurements of PBL heights, associated with different heights of clouds. The first layer was selected to represent the heights of the PBL, using 30-minute averages.
Microwave radiometer profiler (MWR)
Data from a microwave radiometer profiler (MWR), model MP3000A (Radiometric Corp., Boulder, CO, United States) were also used. The MWR provides vertical profiles of temperature, humidity, and liquid water content as a function of height as well as surface pressure at 5-minute intervals. The data obtained from the MWR were combined with the vertical pressure profiles obtained from the radiosondes and interpolated for the entire daily cycle. Using the vertical pressure (estimated) and temperature (observed) profiles, the potential temperature was computed throughout the day, and the height of the PBL was also calculated by the profile method.
Lidar
Doppler LIDAR measurements were conducted to estimate the height of the PBL. The Lidar is a stand-alone remote sensing instrument that provides measurements of radial velocity and backscatter attenuated in time (Manninen et al. 2018Manninen, A.J.; Marke, T.; Tuononen, M.; O’Connor, E.J.; 2018. Atmospheric boundary layer classification with doppler lidar. Journal of Geophysical Research: Atmospheres , 123: 8172-8189.). The Lidar has superior hemispheric scanning capability, allowing the three-dimensional mapping of turbulent fluxes within the PBL. Through the variance of the vertical velocity (σw 2), it determines the depth of the PBL, following the method of Huang et al. (2017Huang, M.; Gao, Z.; Miao, S.; Chen, F.; Lemone, M.A.; Hu, F.; Wang, L. 2017. Estimate of boundary-layer depth over Beijing, China, using doppler lidar data during SURF-2015. Boundary-Layer Meteorology , 162: 503-522.), where the authors define the PBL as the layer in which σw 2 exceeds a certain threshold limit (0.1 m2 s-2).
PALM
The LES model used in this study (PALM) was implemented by Raasch and Schröter (2001) and updated by Maronga et al (2015Maronga, B.; Gryschka, M.; Heinze, R.; Hoffmann, F.; Kanani-Sühring, F.; Keck, M.; Ketelsen, K.; Letzel, M.O.; Sühring, M.; Raasch, S. 2015. The Parallelized Large-Eddy Simulation Model (PALM) version 4.0 for atmospheric and oceanic flows: model formulation, recent developments, and future perspectives. Geoscientific Model Development, 8: 2515-2551.). This LES model has a high-performance computational structure capable of great scalability for massively parallelized calculation architectures. The model has proven to be a very useful tool in various applications, including studies of the convective boundary layer (Maronga and Raasch 2013Maronga, B.; Raasch, S. 2013. Large-eddy simulations of surface heterogeneity effects on the convective boundary layer during the LITFASS-2003 Experiment. Boundary-Layer Meteorology , 46: 17-44.; Maronga et al. 2015; Kanani-Sühring and Raasch 2017Kanani-Sühring, F.; Raasch, S. 2017. Enhanced scalar concentrations and fluxes in the lee of forest patches: a large-eddy simulation study. Boundary-Layer Meteorology , 164: 1-17.; Neves et al. 2018Neves, T.; Fisch, G.; Raasch, S. 2018. Local convection and turbulence in the Amazonia using large eddy simulation model. Atmosphere, 9: 399-412.).
The simulations were carried out for eight representative days in IOP2 in order to obtain a better characterization of NBL erosion processes, using a domain of 10 km x 10 km horizontally and approximately 5 km vertically, with a grid spacing of 50 m, in both the horizontal and vertical scales. The model simulated a period of 12 hours (comprising the period from 02:00 to 13:00 LT) for the days selected. This is the length of time for the model to create the first turbulent vortices and achieve statistical equilibrium given the initial conditions. It was tested for Amazonia by Neves et al. (2018Neves, T.; Fisch, G.; Raasch, S. 2018. Local convection and turbulence in the Amazonia using large eddy simulation model. Atmosphere, 9: 399-412.).
Through the simulations, it was possible to analyze the PBL cycle, the vertical profile of the sensible heat flux (H), and the vertical profiles of the turbulent kinetic energy (TKE) terms [thermal production (TP), mechanical production (MP), turbulent transport (TT), and dissipation (Di)]. The TKE terms have a key role to understand the turbulence structure in micrometeorology, as they quantify the intensity of the turbulence and describe, through physical processes, the properties of the PBL. This measurement is directly linked to the transport of heat, moisture, and momentum within the PBL. The simulated TKE terms were analyzed at 04:00, 08:00 and 10:00 LT. These times were chosen because they are representative of the different phases of the NBL: well established (04:00 LT), in erosion (08:00 LT), and soon after complete erosion (10:00 LT).
NBL erosion calculation
In order to determine the layer warming during the NBL erosion, a graphical method identification was used, in which the height (h i ) of the boundary layer during erosion was determined by the point of intersection between the last profile with nocturnal characteristics, at sunrise (06:00 LT), and the first diurnal profile, which generally started around 08:00 LT, when the method begins to identify a shallow convective mixing (Figure 1). For this graphical method, 30-minute average profiles of θ obtained by the MWR were used.

Schematic diagram of the potential temperature profiles at 06:00 and 08:00 LT. The gray area represents the thermal heating of the layer between the two profiles.
Vernekar et al. (1993Vernekar, K.G.; Mohan, B.; Saxena, S.; Patil, M.N. 1993. Characteristics of the atmospheric boundary layer over a tropical station as evidenced by tethered ballon observations. Journal of Applied Meteorology, 32: 1426-1432.) described the calculation used for identifying the time required for destruction (erosion) of the NBL and convective turbulent mixing settling in the early morning:
, (1)
where is the kinetic heat flux released (derived by observation or simulation of heat turbulent fluxes divided by ρ c p ); and is the heat source for layer heating.
In this analysis, in particular, the source/sink processes are the advective transports (from the pasture). The contribution of the radiative term is neglected, as it is small compared to the general balance budget (Vernekar et al. 1993Vernekar, K.G.; Mohan, B.; Saxena, S.; Patil, M.N. 1993. Characteristics of the atmospheric boundary layer over a tropical station as evidenced by tethered ballon observations. Journal of Applied Meteorology, 32: 1426-1432.).
By integrating Equation (1), from the surface to the height h, and by discretizing the analytical terms, the following equation was obtained:
, (2)
where the subscripts 𝑠 and 𝑏 refer to the fluxes of energy on the surface and associated with the entrainment (top of the layer), respectively.
In contrast to what has been proposed by other authors, the flux of entrainment was not disregarded, using the flux obtained by the PALM simulations to evaluate how much this flux contributed to the heating of the layer. In this way, Equation (2) becomes:
, (3)
Thus, it is possible to solve Equation (3), to obtain an estimate of the residual term () integrated from the surface to the top of the boundary layer, and between sunrise and NBL erosion, since the other terms of this equation were measured (using eddy covariance, radiosondes, and Microwave Radiometer Profiler) or computed by LES-PALM simulation.
RESULTS
Observational analysis
During the IOP2 the total rainfall was 185 mm (Table 1). At the end of the night and early morning (between 00:00 and 06:00 LT), the precipitation was low (4.8 mm). During the daytime period (between 07:00 and 17:00 LT), 83.9 mm of rainfall were recorded. The highest rainfall frequencies of the period were observed during nighttime (between 18:00 and 23:00 LT), with a cumulative total of 96.3 mm (52% of the total rainfall).
Accumulated precipitation in different periods of the day during the dry season at a central Amazon site (local time).
The maximum values of energy balance components (Table 2), showed that net radiation (Rn) had a maximum value at 11:00 LT, with an average of 534.5 W m-2. It was measured that 72% of the available energy was converted into latent heat flux (LE), with a maximum observed at 12:00 LT, and an average of 350.3 W m-2. The sensible heat flux (H) had a maximum of 112.8 W m-2 at 12:00 LT, when 23% of Rn was partitioned into H. The soil heat flux (G) had its maximum value at 11:00 LT, with an average of 50 W m-2.
Maximum values of net radiation (Rn), latent heat flux (LE), sensible heat flux (H) and soil heat flux (G) at 06:00 - 17:00 LT at a central Amazon site.
The daily PBL cycle shown in Figure 2 had an average depth of 250 m with very stable stratification during the NBL phase (between 00:00 and 06:00 LT). At the beginning of the NBL erosion phase, near sunrise at 06:00 LT, an increase of 70.8 m h-1 in the height of the NBL was observed, which caused the NBL to be completely eroded at 08:00 LT. After the NBL erosion, the CBL development had an average growth rate of 175.2 m h-1. Therefore, the CBL was already formed at 11:00 LT with a maximum height of 1,590 m recorded at 13:30 LT. After 18:00 LT, the sensible heat flux returned to zero, and the convection began to decay rapidly until 19:00 LT when the layer once again presented a stable stratification.

Daily cycle of the height of the planetary boundary layer (PBL) during the dry season at a site in the central Amazon [Intensive Observation Period 2 (IOP2) of Project GoAmazon2014/5].
According to celiometer data, the NBL erosion phase during 45 days of the IOP2 showed small vertical oscillations, ranging from 100 to 350 m (Figure 3). The erosion process started at sunrise (06:00 LT), as the nocturnal inversion was shallower and there was an increase in energy fluxes, especially in the H flux, at an average elevation of 70.8 m h-1. The NBL was completely eroded at 08:00 LT, generating a CBL elevation of about 175.2 m h-1. The CBL was already well established close to 11:00 LT on most days.

Erosion process of the nocturnal boundary layer (NBL) at a central Amazon site during the dry season [Intensive Observation Period 2 (IOP2) of Project GoAmazon2014/5] as measured by Ceilometer. The gray lines represent the measurements for each days of the period. The black line represents period mean. The vertical lines mark sunrise (06:00 LT) and the erosion of the NBL (08:00 LT).
Simulations using PALM
As mentioned before, eight representative days in IOP2 were simulated in order to represent the influence of simulated physical parameters on NBL erosion. To validate the functionality of the model for this study, only October 1, 2014 was shown, as the other simulated days showed similar dry-season behaviour: no rainfall, air temperature around 32ºC, with low relative humidity (65%) at midday.
Positive values for the vertical profile of H were observed after 06:00 LT, but values above 10 W m-2 were observed after 08:00 LT (Figure 4). By 10:00 LT there was a higher intensity of H near the surface, with values around 150 W m-2. The maximum positive surface flux of H was observed between 12:00 and 13:00 LT, around 1,100 m, with the negative flux layer (-50 W m-2) above representing the entrainment flux.
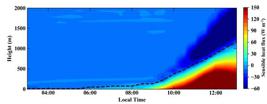
Temporal evolution of the sensible heat flux (H) (W m-2) profile obtained by the PALM model at a central Amazon site on October 1, 2014. The dashed line represents the height where the flux is zero (H = 0). This figure is in color in the electronic version.
The PBL heights for the simulated day (Figure 5) showed that NBL had strong stability with an average height of around 180 m. The heights obtained by PALM between 02:00 and 06:00 LT had a small growth at 04:00 LT, however, they were still in agreement with the results obtained by the Ceilometer (220 m). After sunrise (06:00 LT), a gradual increase of NBL depth was observed, with an average growth rate of 70 m h-1 until 08:00 LT, when the NBL was completely eroded.

Mean heights (m) of the planetary boundary layer (PBL) at a central Amazon site on October 1, 2014 measured by different methodologies.
The average kinetic heat flux between the sunrise (06:00 LT) and the erosion of the NBL (08:00 LT) was 199.4 m K at the surface ((w'θ')s *∆t), and was 114.6 m K at the top of the boundary layer ((w'θ')b *∆t) due to entrainment. The heating within the entire layer was 369.4 m K (Table 3), resulting in an integrated residual of 54.4 m K (15% of total heat).
Integrated total heat flux for the NBL erosion period on the surface ((w'θ')s *∆t), top layer flux ((w'θ')b *∆t) and the layer heating at a central Amazon site.
After the erosion, the depth of the PBL grew very fast, reaching 800 m (08:00 LT) and 1,200 m (12:00 LT), with an average growth rate of approximately 150 m h-1. The simulated PBL maximum was 1,500 m at 13:00 LT.
The TKE budget is a strong tool to understand the influence of different processes within the PBL. Regarding TKE partitioning for the NBL at 04:00 LT (Figure 6a), due to the negative flux at this time, TP was negative near the surface with low intensity (-0.07), and the same was observed for MP (-0.20), tending to be zero at the top of the NBL. As there is low or no turbulence (intermittency) at this time, TT values were close to zero in practically the whole profile. Di values were similar to MP close to the surface (-0.20), becoming null at the top of the NBL.

Budget of turbulent kinetic energy (TKE) terms at different times of the day (central Amazon local time): A - 04:00 LT; B - 08:00 LT; and C - 10:00 LT. TP = thermal production, MP = mechanical production, TT = turbulent transport, Di = dissipation. This figure is in color in the electronic version.
All TKE terms at 08:00 LT (Figure 6b) showed positive values. TP was positive at the surface (+0.55) and decreased with height, reaching negative values at 75% of the CBL depth, and null values at the top of the CBL (550 m). MP increased in intensity, with positive values from the surface up to the maximum at 250 m (+0.85), then decreasing with height, reaching negative (-0.60) and null values at the top of the CBL. At 08:00, thermal turbulence started to occur, and TT was negative close to the surface (−0.15) and positive near the top of the CBL (+0.02). Di behaved similarly to MP, with positive values from the surface up to 250 m (+0.80), becoming negative with increasing height (-0.60) and null at the top of the CBL.
At 10:00 LT (Figure 6c), the NBL was completely eroded, and there was a more intense effect of thermals. TP was more intense at the surface (+1.75), decreasing linearly with height. MP was negative near the surface (-0.50), and started to show positive values (+0.60) from 150 m up to 300 m, then decreasing to null. TT behaved similarly to its profile at 08:00 LT, but with greater intensity, with negative values close to the surface (-0.20) and positive values close to the top of the CBL (+0.10). Di behaved similarly to TP at the surface, and after 150 m behaved similarly to MP.
The other simulated days (not described in detail) showed similar results, with no significant variation in the depth of the NBL (Figure 7), and a height of around 200 m, as observed by the measurements during the IOP2 (see Figure 3). With the beginning of NBL erosion, a growth of 50 m h-1 was observed in the first hour (between 06:00 and 07:00 LT). However, with the increase of available energy, a growth rate of approximately 250 m h-1 was measured (see Figure 4).

Erosion process of the nocturnal boundary layer (NBL) during the dry season at a central Amazon site obtained by PALM. The gray lines represent the simulated days. The black line represents the dry season mean. The vertical lines represent sunrise (06:00 LT) and erosion of the NBL (08:00 LT).
DISCUSSION
Observational analysis
Although the NBL has stable stratification, a significant increase (around 400 m) in its depth was observed at the beginning of the erosion phase (at 06:00 LT) in response to the surface warming (positive values of Rn and H). The NBL erosion lasted two hours until 08:00 LT, because there is a higher incidence of solar radiation in the dry season in the central Amazon (Macedo and Fisch 2017Macedo, A.S.; Fisch, G. 2018. Variabilidade temporal da radiação solar durante o experimento GOAmazon 2014/15. Revista Brasileira de Meteorologia, 33: 353-365.), resulting in positive H in the early hours of the morning. The results showed that the NBL erosion in the region is conditioned by greater energy availability in the early hours of the morning, and how much of H will be used to heat the atmosphere, thus initiating the formation of thermal turbulence.
The CBL growth rate after erosion was faster than that observed during the wet season (Carneiro et al. 2018Carneiro, R.G.; Henkes, A.; Fisch, G.; Borges, C.K. 2018. Estudo do ciclo diário da camada limite planetária durante a estação chuvosa da Amazônia (GOAMAZON 2014/15). Ciência e Natura , 40: 63-68.). This showed that NBL erosion directly influenced the faster development and maximum height of the CBL. The maximum depth (1,590 m) was similar to previous measurements in a pasture area in Rondônia state, in the southwestern Amazon, in the dry season (1,650 m) (Fisch et al. 2004Fisch, G.; Tota, J.; Machado, L.A.T.; Dias, M.A.F.S.; Lyra, R.F.d.F.; Nobre, C.A.; Dolman, A.J.; Gash, J.H.C. 2004. The convective boundary layer over pasture and forest in Amazonia. Theoretical and Applied Climatology, 78: 47-59.) and at the beginning of the dry season (1,500 m) (Neves and Fisch 2015Neves, T.T.A.; Fisch, G. 2015. The daily cycle of the atmospheric boundary Layer heights over pasture site in Amazonia. American Journal of Environmental Engineering, 5: 39-44.).
When comparing the RS measurements with remote sensors, the Ceilometer measurements showed the best agreement with the RS data throughout the daily cycle of the PBL, with a small overestimation of 25 m in the convection decline phase. The WP and MWR sensors, in turn, showed better results during the NBL (between 00:00 and 06:00 LT) and the erosion phase, underestimated by approximately 150 m in the period in which the CBL is well established and with the WP overestimated (≈ 100 m) at the end of the day. This overestimation occurs due to the presence of a multilayer structure, with the simultaneous presence of a residual layer and the constituted NBL, which produces a false identification of the PBL height (Wang et al. 2016Wang, C.; Shi, H.; Jin, L.; Chen, H.; Wen, H. 2016. Measuring boundary-layer height under clear and cloudy conditions using three instruments. Particuology, 28: 15-21.). The Lidar, as well as the Ceilometer, showed satisfactory results for the NBL erosion phase and for the CBL development period, in accordance with Huang et al. (2017Huang, M.; Gao, Z.; Miao, S.; Chen, F.; Lemone, M.A.; Hu, F.; Wang, L. 2017. Estimate of boundary-layer depth over Beijing, China, using doppler lidar data during SURF-2015. Boundary-Layer Meteorology , 162: 503-522.), who stated that Lidar produces values similar to the depth of PBL during the transition period. SODAR tended to overestimate (≈ 50 m) measurements during NBL at the beginning of the day, and to underestimate (≈ 100 m) measurements at the end of the day.
Simulations using PALM
NBL erosion was well represented by the PALM simulations. The values for PBK heights obtained with the model are in accordance with the values found for the IOP2 average (70.8 m h-1). However, an underestimation (≈ 20 m) was observed at the beginning of the erosion phase at 06:00 LT. The thermal heating of the layer during the erosion phase showed that the energy available was not sufficient for closure of the heat budget. Extra energy around 15% is missing and it can be associated with an advective flux from tropical forest areas nearby as well as the proximity of the Solimões River. In this study, it was possible to represent the contribution of the entrainment flux (119.8 m K) in the top of the layer, but this was not enough for heat budget closure. This approach was also used by Santos (2007Santos, R.M.N. 2007. Estudos da camada limite noturna na Amazônia. INPE-14477-TDI/1158. Doctoral thesis, Instituto Nacional de Pesquisas Espaciais, Brazil. 177 p. (http://urlib.net/rep/sid.inpe.br/jeferson/2005/05.25.18.40)
http://urlib.net/rep/sid.inpe.br/jeferso...
) for a pasture area in Rondônia, where it was not possible to obtain the heat budget closure by 30%.
The similarity between depths obtained through modelling and observational data for the 08:00 - 13:00 LT interval agrees with Maronga et al. (2014Maronga, B.; Hartogensis, O.K.; Raasch, S.; Beyrich, F. 2014. The effect of surface heterogeneity on the structure parameters of temperature and specific humidity: A large-eddy simulation case study for the LITFASS-2003 Experiment. Boundary Layer Meteorology, 153: 441-470.) and Heinze et al. (2017Heinze, R.; Moseley, C.; Böske, L.N.; Muppa, S.K.; Maurer, V.; Raasch, S.; Stevens, B. 2017. Evaluation of large-eddy simulations forced with mesoscale model output for a multi-week period during a measurement campaign. Atmospheric Chemistry and Physics, 17: 7083-7109. ), who obtained the best simulation values with PALM so far for a non-Amazonian environment
PALM and Ceilometer results were similar regarding PBL growth, showing a quick NBL erosion two hours after sunrise, up to complete erosion at 08:00 LT and fast growth of the CBL. The well established CBL at 10:00 LT in most simulated days also agreed with the observational data. This indicates that the phase of faster erosion facilitates the development of convection, which agrees with Edwards et al. (2014Edwards, J.M.; Basu, S.; Bosveld, F.C.; Holtslag, A.A.M. 2014. The impact of radiation on the GABLS3 large-eddy simulation through the night and during the morning transition. Boundary-Layer Meteorology, 152: 189-211.), who observed that, after the NBL erosion, with the increase of radiation, the CBL develops more rapidly, increasing 40% in depth four hours after the transition.
TKE budget observations agree with Nunes et al. (2010Nunes, A.B.; Campos Velho, H.F.; Satyamurty, P.; Degrazia, G.; Goulart, A.; Rizza, U. 2010. Morning boundary-layer turbulent kinetic energy by theoretical models. Boundary Layer Meteorology , 134: 23-39.) and Neves et al. (2018Neves, T.; Fisch, G.; Raasch, S. 2018. Local convection and turbulence in the Amazonia using large eddy simulation model. Atmosphere, 9: 399-412.). The evolution of TKE from values close to zero prior to sunrise, to intense TP after 08:00, with maximum values near the surface, was owed mainly to the sensible heat flux at the surface.
CONCLUSIONS
This study showed that the erosion phase of the NBL occurred two hours after sunrise during the dry season (IOP2 of Project GOAmazon 2014/15) in the central Brazilian Amazon. The energy that heats the layer was provided from the sensible heat flux released by the surface and from the entrainment at the top of the PBL. The NBL erosion directly influenced the faster development of the CBL, by reaching the maximum height faster and remaining well established. By means of in situ (radiosondes) and remote sensing (Ceilometer, SODAR, Lidar, WP, MWR) measurements, it was possible to analyze the daily cycle of PBL heights. The Ceilometer resulted in the most satisfactory remote sensing values for the entire PBL daily cycle as compared to in situ values. The simulations performed with PALM for the NBL erosion phase resulted in a proper representation of this period in comparison with observational measurements.
ACKNOWLEDGMENTS
The authors thank Coordenação de Aperfeiçoamento de Pessoal de Nível Superior - CAPES for the financial support and the GOAMAZON 2014/5 Project for providing the data used in this study.
REFERENCES
- Barlage, M.; Miao, S.; Chen, F. 2016. Impact of physics parameterizations on high-resolution weather prediction over two Chinese megacities. Journal of Geophysical Research: Atmospheres, 121: 4487-4498.
- Carneiro, R.G. 2018. Erosão da camada limite noturna e suas implicações no crescimento da camada limite convectiva na região central da Amazônia (experimento GOAMAZON 2014/15) Doctoral thesis, Instituto Nacional de Pesquisas Espaciais, Brazil. 152p. (http://urlib.net/sid.inpe.br/mtc-m21b/2018/01.18.01.59)
» http://urlib.net/sid.inpe.br/mtc-m21b/2018/01.18.01.59 - Carneiro, R.G.; Fisch, G.; Kaufmann, T. 2016. Determinação da altura da camada limite planetária na floresta Amazônica utilizando um Ceilometer. Ciência e Natura, 38: 460-466.
- Carneiro, R.G.; Henkes, A.; Fisch, G.; Borges, C.K. 2018. Estudo do ciclo diário da camada limite planetária durante a estação chuvosa da Amazônia (GOAMAZON 2014/15). Ciência e Natura , 40: 63-68.
- Edwards, J.M.; Basu, S.; Bosveld, F.C.; Holtslag, A.A.M. 2014. The impact of radiation on the GABLS3 large-eddy simulation through the night and during the morning transition. Boundary-Layer Meteorology, 152: 189-211.
- Englberger, A.; Dörnbrack, A. 2017. Impact of neutral boundary-layer turbulence on wind-turbine wakes: a numerical modelling study. Boundary-Layer Meteorology , 162: 427-449.
- Fisch, G.; Tota, J.; Machado, L.A.T.; Dias, M.A.F.S.; Lyra, R.F.d.F.; Nobre, C.A.; Dolman, A.J.; Gash, J.H.C. 2004. The convective boundary layer over pasture and forest in Amazonia. Theoretical and Applied Climatology, 78: 47-59.
- Heinze, R.; Moseley, C.; Böske, L.N.; Muppa, S.K.; Maurer, V.; Raasch, S.; Stevens, B. 2017. Evaluation of large-eddy simulations forced with mesoscale model output for a multi-week period during a measurement campaign. Atmospheric Chemistry and Physics, 17: 7083-7109.
- Huang, M.; Gao, Z.; Miao, S.; Chen, F.; Lemone, M.A.; Hu, F.; Wang, L. 2017. Estimate of boundary-layer depth over Beijing, China, using doppler lidar data during SURF-2015. Boundary-Layer Meteorology , 162: 503-522.
- Itterly, K.F.; Taylor, P.C.; Dodson, J.B.; Tawfik, A.B. 2016. On the sensitivity of the diurnal cycle in the Amazonto convective intensity. Journal of Geophysical Research: Atmospheres . 121: 8186-8208.
- Kanani-Sühring, F.; Raasch, S. 2017. Enhanced scalar concentrations and fluxes in the lee of forest patches: a large-eddy simulation study. Boundary-Layer Meteorology , 164: 1-17.
- Macedo, A.S.; Fisch, G. 2018. Variabilidade temporal da radiação solar durante o experimento GOAmazon 2014/15. Revista Brasileira de Meteorologia, 33: 353-365.
- Machado, L.A.; Calheiros, A.J.; Biscaro, T.; Giangrande, S.; Dias, M.A.; Cecchini, M.A.; et al 2018. Overview: Precipitation characteristics and sensitivities to environmental conditions during GoAmazon2014/5 and ACRIDICON-CHUVA. Atmospheric Chemistry and Physics , 18: 6461-6482.
- Manninen, A.J.; Marke, T.; Tuononen, M.; O’Connor, E.J.; 2018. Atmospheric boundary layer classification with doppler lidar. Journal of Geophysical Research: Atmospheres , 123: 8172-8189.
- Marengo, J.A.; Fisch, G.; Alves, L.M.; Sousa, N.V.; Fu, R.; Zhuang, Y. 2017. Meteorological context of the onset and end of the rainy season in Central Amazonia during the GoAmazon2014/5. Atmospheric Chemistry and Physics , 17: 7671-7681.
- Maronga, B.; Gryschka, M.; Heinze, R.; Hoffmann, F.; Kanani-Sühring, F.; Keck, M.; Ketelsen, K.; Letzel, M.O.; Sühring, M.; Raasch, S. 2015. The Parallelized Large-Eddy Simulation Model (PALM) version 4.0 for atmospheric and oceanic flows: model formulation, recent developments, and future perspectives. Geoscientific Model Development, 8: 2515-2551.
- Maronga, B.; Hartogensis, O.K.; Raasch, S.; Beyrich, F. 2014. The effect of surface heterogeneity on the structure parameters of temperature and specific humidity: A large-eddy simulation case study for the LITFASS-2003 Experiment. Boundary Layer Meteorology, 153: 441-470.
- Maronga, B.; Raasch, S. 2013. Large-eddy simulations of surface heterogeneity effects on the convective boundary layer during the LITFASS-2003 Experiment. Boundary-Layer Meteorology , 46: 17-44.
- Martin, S.T.; Artaxo, P.; Machado, L.A.T.; Manzi, A.O.; Souza, R.A.F.; Schumacher, C.; et al 2016. Introduction: observations and modeling of the Green Ocean Amazon (GoAmazon2014/5). Atmospheric Chemistry Physics, 16: 4785-4797.
- Neves, T.; Fisch, G.; Raasch, S. 2018. Local convection and turbulence in the Amazonia using large eddy simulation model. Atmosphere, 9: 399-412.
- Neves, T.T.A.; Fisch, G. 2011. Camada Limite Noturna sobre pastagem na Amazônia. Revista Brasileira de Meteorologia, 24: 619-628.
- Neves, T.T.A.; Fisch, G. 2015. The daily cycle of the atmospheric boundary Layer heights over pasture site in Amazonia. American Journal of Environmental Engineering, 5: 39-44.
- Neves, T.T.A.T. 2015. Análise de turbulência e convecção na Amazônia utilizando o modelo PALM-LES Doctoral thesis, Instituto Nacional de Pesquisas Espaciais, Brazil. 159p. (http://urlib.net/sid.inpe.br/mtc-m21b/2015/10.18.05.54)
» http://urlib.net/sid.inpe.br/mtc-m21b/2015/10.18.05.54 - Nunes, A.B.; Campos Velho, H.F.; Satyamurty, P.; Degrazia, G.; Goulart, A.; Rizza, U. 2010. Morning boundary-layer turbulent kinetic energy by theoretical models. Boundary Layer Meteorology , 134: 23-39.
- Pino, D.; Jonker, H.J.J.; Arellano, J.V.G. de; Dosio, A. 2006. Role of shear and the inversion strength during sunset turbulence over land: characteristic length scales. Boundary-Layer Meteorology , 121: 537-556.
- Ramos, D.; Fernandez, J.P.R.; Fisch, G. 2018. Evolution of the Planetary Boundary Layer on the northern coast of Brazil during the CHUVA campaign. Atmospheric Research, 203: 298-310.
- Santos, L.A.R.; Fisch, G. 2007. Intercomparação entre quatro métodos de estimativa da altura da camada limite convectiva durante o experimento racci - lba (2002) em Rondônia - Amazônia. Revista Brasileira de Meteorologia , 22: 322-328.
- Santos, R.M.N. 2007. Estudos da camada limite noturna na Amazônia. INPE-14477-TDI/1158 Doctoral thesis, Instituto Nacional de Pesquisas Espaciais, Brazil. 177 p. (http://urlib.net/rep/sid.inpe.br/jeferson/2005/05.25.18.40)
» http://urlib.net/rep/sid.inpe.br/jeferson/2005/05.25.18.40 - Santos, R.M.N.; Fisch, G.; Dolman, A.J.; Waterloo, M. 2007. Modelagem da camada limite noturna (CLN) durante a época úmida na Amazônia, sob diferentes condições de desenvolvimento. Revista Brasileira de Meteorologia , 22: 387-407.
- Stull, R.B. 1988. An Introduction to Boundary Layer Meteorology . 1st ed. Springer, Dodrecht, 670p.
- Tawfik, A.B.; Dirmeyer, P.A. 2014. A process-based framework for quantifying the atmospheric preconditioning of surface-triggered convection. Geophysical Research Letters 41: 173-178.
- Vernekar, K.G.; Mohan, B.; Saxena, S.; Patil, M.N. 1993. Characteristics of the atmospheric boundary layer over a tropical station as evidenced by tethered ballon observations. Journal of Applied Meteorology, 32: 1426-1432.
- Wang, C.; Shi, H.; Jin, L.; Chen, H.; Wen, H. 2016. Measuring boundary-layer height under clear and cloudy conditions using three instruments. Particuology, 28: 15-21.
-
CITE AS:
Carneiro, R.G.; Fisch, G.; Borges, C.K.; Henkes, A. 2020. Erosion of the nocturnal boundary layer in the central Amazon during the dry season. Acta Amazonica (Epub Ahead of Print).
Edited by
ASSOCIATE EDITOR:
Publication Dates
-
Publication in this collection
25 Nov 2019 -
Date of issue
Jan-Mar 2020
History
-
Received
18 Nov 2018 -
Accepted
03 Nov 2019


