ABSTRACT
Habitat loss and fragmentation caused by deforestation are important anthropogenic drivers of changes in biodiversity in the Amazon rainforest, and has reached its highest rate in recent decades. However, the magnitude and direction of the effects on species composition and distribution have yet to be fully understood. We evaluated the responses of four taxonomic groups − birds, amphibians, orchid bees, and dung beetles - to habitat loss and fragmentation at both species and assemblage level in the northern Ecuadorian Amazon. We sampled fifteen 250-m long plots in terra-firme forest remnants. We calculated one landscape fragmentation index (fragindex), which considers the proportion of continuous forest cover, edge density and isolation in the landscape, and nine landscape configuration metrics. Logistic regression models and multivariate regression trees were used to analyze species and assemblage responses. Our results revealed that over 80% of birds, amphibians or orchid-bee species, and 60% of dung beetles were negatively affected by habitat loss and fragmentation. Species composition of all taxonomic groups was significantly affected by differences in forest cover and connectivity. Less than 5% of all species were restricted to landscapes with fragindex values higher than 40%. Landscape metrics related to the shape and area of forest patches determined the magnitude and direction of the effect on species responses. Therefore, changes in the landscape configuration of Ecuadorian Amazonia should be minimized to diminish the effects of habitat loss and fragmentation on species occurrence and assemblage composition.
KEYWORDS:
deforestation; Ecuador; species distribution; tropical forests
RESUMEN
La pérdida y fragmentación del hábitat causada por la deforestación es un importante impulsor antropogénico de cambios sobre la biodiversidad en la selva amazónica. Sin embargo, la magnitud y dirección de los efectos sobre la composición y distribución de las especies aún es incomprendida. Evaluamos las respuestas de cuatro grupos taxonómicos - aves, anfibios, abejas de orquídeas y escarabajos peloteros - a la pérdida y fragmentación del hábitat, tanto a nivel de especies como de ensamblaje, en la Amazonía norte ecuatoriana. Tomamos muestras de quince parcelas de 250 m de largo en remanentes de bosque de tierra firme. Calculamos un índice de fragmentación del paisaje (fragindex), que considera la cobertura forestal continua, densidad del borde y el aislamiento en el paisaje, y nueve métricas de configuración del paisaje para analizar las respuestas de especies y ensamblajes. Más del 80% de las especies de aves, anfibios o abejas de orquídeas y el 60% de los escarabajos peloteros se vieron afectados negativamente por la pérdida y fragmentación del hábitat. La composición por especies se vio significativamente afectada por las diferencias en la cobertura forestal y la conectividad, mientras que la forma y el área de los parches de bosque determinaron la magnitud y la dirección del efecto en las respuestas de las especies. Por lo tanto, los cambios en la configuración del paisaje de la Amazonía ecuatoriana deben minimizarse para disminuir los efectos de la pérdida y fragmentación del hábitat sobre la presencia de especies y la composición de los ensambles.
PALABRAS-CLAVE:
deforestación; Ecuador; distribución de especies; bosques tropicales
INTRODUCTION
Between 2000 and 2012, more than 250,000 km2 of South American tropical forests were replaced by agriculture, cattle pastures and affected by other economic activities like mining and oil exploitation (Lewis et al. 2015Lewis, S.L.; Edwards, D.P.; Galbraith, D. 2015. Increasing human dominance of tropical forests. Science, 349: 827-832.; Hansen et al. 2020Hansen, M.C.; Wang, L.; Song, X.-P.; Tyukavina, A.; Turubanova, S.; Potapov, P.V.; et al. 2020. The fate of tropical forest fragments. Science Advances, 6: eaax8574.). Consequently, continuous forest areas are reduced and fragmented into smaller patches among non-native habitats (Achard et al. 2014Achard, F.; Beuchle, R.; Mayaux, P.; Stibig, H.-J.; Bodart, C.; Brink, A.; et al. 2014. Determination of tropical deforestation rates and related carbon losses from 1990 to 2010. Global Change Biology, 20: 2540-2554.; Haddad et al. 2015Haddad, N.M.; Brudvig, L.A.; Clobert, J.; Davies, K.F.; Gonzalez, A.; Holt, R.D.; et al. 2015. Habitat fragmentation and its lasting impact on Earth’s ecosystems. Science Advances, 1: e1500052.). Most land transformation occurs in privately-owned lands, which are more vulnerable to transformations and degradation (Laurance et al. 2002Laurance, W.F.; Albernaz, A.K.M.; Schroth, G.; Fearnside, P.M.; Bergen, S.; Venticinque, E.M.; et al. 2002. Predictors of deforestation in the Brazilian Amazon. Journal of Biogeography, 29: 737-748., 2009Laurance, W.F.; Goosem, M.; Laurance, S.G.W. 2009. Impacts of roads and linear clearings on tropical forests. Trends in Ecology & Evolution, 24: 659-669.; Zimbres et al. 2018Zimbres, B.; Machado, R.B.; Peres, C.A. 2018. Anthropogenic drivers of headwater and riparian forest loss and degradation in a highly fragmented southern Amazonian landscape. Land Use Policy, 72: 354-363.). In the western portion of the Amazon basin in Ecuador, deforestation is the main driver of habitat loss and fragmentation, mainly for cattle pasture and silviculture (Bonilla-Bedoya et al. 2014Bonilla-Bedoya, S.; Molina, J.R.; Macedo-Pezzopane, J.E.; Herrera-Machuca, M.A. 2014. Fragmentation patterns and systematic transitions of the forested landscape in the upper Amazon region, Ecuador 1990-2008. Journal of Forestry Research, 25: 301-309.). With few protected areas that could guarantee the integrity and connectivity of large forest areas, the 132,292 km2 of Ecuadorian Amazonia have been rapidly fragmented since 1970 (Sierra 2000Sierra, R. 2000. Dynamics and patterns of deforestation in the western Amazon: the Napo deforestation front, 1986-1996. Applied Geography 20: 1-16. doi.org/10.1016/S0143-6228(99)00014-4
https://doi.org/doi.org/10.1016/S0143-62...
; Hansen et al. 2013). Between 2010 and 2015, 2% of the total deforestation in the Amazon basin occurred in Ecuador, with an accumulated deforestation of 12,120 km2 (Borja et al. 2017Borja, M.O.; Aragón-Osejo, J.; Josse, C. 2017. Bosques de la Región Amazónica Ecuatoriana: ¿Qué nos dicen las cifras de deforestación de los últimos 15 años? Memorias y Boletines de la Universidad del Azuay, 1: 63-76.).
Habitat loss and fragmentation are twin processes that lead to the increase in forest edge, decrease in forest area, and isolation of fragments (Fischer and Lindenmayer 2007Fischer, J.; Lindenmayer, D.B. 2007. Landscape modification and habitat fragmentation: a synthesis. Global Ecology and Biogeography, 16: 265-280.; Haddad et al. 2015Haddad, N.M.; Brudvig, L.A.; Clobert, J.; Davies, K.F.; Gonzalez, A.; Holt, R.D.; et al. 2015. Habitat fragmentation and its lasting impact on Earth’s ecosystems. Science Advances, 1: e1500052.; Hadley and Betts 2016Hadley, A.S.; Betts, M.G. 2016. Refocusing habitat fragmentation research using lessons from the last decade. Current Landscape Ecology Reports, 1: 55-66.; Fahrig 2019Fahrig, L. 2019. Habitat fragmentation: A long and tangled tale. Global Ecology and Biogeography, 28: 33-41.). At the local scale, forest edges enhance the exposure of the vegetation to higher temperatures and lower humidity (Laurance et al. 2002Laurance, W.F.; Albernaz, A.K.M.; Schroth, G.; Fearnside, P.M.; Bergen, S.; Venticinque, E.M.; et al. 2002. Predictors of deforestation in the Brazilian Amazon. Journal of Biogeography, 29: 737-748., 2017Laurance, W.F.; Camargo, J.L.C.; Fearnside, P.M.; Lovejoy, T.E.; Williamson, G.B.; Mesquita, R.C.G.; et al. 2017. An Amazonian rainforest and its fragments as a laboratory of global change. Biological Reviews, 93: 223-247.). Edges affect vertebrates (Pfeifer et al. 2017Pfeifer, M.; Lefebvre, V.; Peres, C.A.; Banks-Leite, C.; Wearn, O.R.; Marsh, C.J.; et al. 2017. Creation of forest edges has a global impact on forest vertebrates. Nature, 551: 187-191.) and invertebrates (Fahrig 2017Fahrig, L. 2017. Ecological Responses to Habitat Fragmentation Per Se | Annual Review of Ecology, Evolution, and Systematics. Annual Review of Ecology, Evolution, and Systematics, 48: 1-23.), changing not only their abundance and local distribution patterns, but also their phenotypic features (Pfeifer et al. 2017). At the landscape scale, the reduction in forest area and connectivity among fragments increases the isolation among populations, restricts movement and gene flow, leading to local extinctions and reduced recolonization probability (Fischer and Lindenmayer 2007). The effect of reduced fragment area and increasing isolation can be enhanced or minimized depending on the characteristics of the matrix surrounding the fragments (Lees and Peres 2009Lees, A.C.; Peres, C.A. 2009. Gap-crossing movements predict species occupancy in Amazonian forest fragments. Oikos, 118: 280-290.). For example, palm oil plantations and pastures are less permeable dispersal barriers for some organisms than secondary forests (Mendes-Oliveira et al. 2017Mendes-Oliveira, A.C.; Peres, C.A.; Maués, P.C.R. de A.; Oliveira, G.L.; Mineiro, I.G.B.; de Maria, S.L.S.; et al. 2017. Oil palm monoculture induces drastic erosion of an Amazonian forest mammal fauna. PLoS ONE, 12: e0187650.; Harada et al. 2020Harada, L.M.; Araújo, I.S.; Overal, W.L.; Silva, F. a. B.; Harada, L.M.; Araújo, I.S.; et al. 2020. Comparison of dung beetle communities (Coleoptera: Scarabaeidae: Scarabaeinae) in oil palm plantations and native forest in the eastern Amazon, Brazil. Revista Brasileira de Entomologia, 64: e2019102.).
The effects of habitat loss and fragmentation can also greatly vary among and within taxonomic groups. In some invertebrates, such as dung beetles, species richness and abundance tend to decrease with forest area and with the degree of fragment isolation (Vulinec et al. 2008Vulinec, K.; Lima, A.P.; Carvalho, E.A.R.; Mellow, D.J. 2008. Dung beetles and long-term habitat fragmentation in Alter do Chão, Amazônia, Brazil. Tropical Conservation Science, 1: 111-121., Carpio et al. 2009Carpio, C.; Donoso, D.A.; Ramón, G.; Dangles, O. 2009. Short term response of dung beetle communities to disturbance by road construction in the Ecuadorian Amazon. Annales de la Société entomologique de France, 45: 455-469., Cândido et al. 2018Cândido, M.E.M.B.; Morato, E.F.; Storck-Tonon, D.; Miranda, P.N.; Vieira, L.J.S. 2018. Effects of fragments and landscape characteristics on the orchid bee richness (Apidae: Euglossini) in an urban matrix, southwestern Amazonia. Journal of Insect Conservation, 22: 475-486.). In other invertebrate groups, such as orchid bees, there is conflicting evidence for the effects of habitat loss and fragmentation on species abundance or richness, as effects can be positive (Brosi et al. 2008Brosi, B.J.; Daily, G.C.; Shih, T.M.; Oviedo, F.; Durán, G. 2008. The effects of forest fragmentation on bee communities in tropical countryside. Journal of Applied Ecology, 45: 773-783.), negative (Nemésio and Silveira 2010Nemésio, A.; Silveira, F.A. 2010. Forest fragments with larger core areas better sustain diverse orchid bee faunas (Hymenoptera: Apidae: Euglossina). Neotropical Entomology, 39: 555-561.), or neutral (Tonhasca et al. 2002Tonhasca, A.; Blackmer, J.L.; Albuquerque, G.S. 2002. Abundance and diversity of Euglossine bees in the fragmented landscape of the Brazilian Atlantic Forest. Biotropica, 34: 416-422.; Storck-Tonon et al. 2013Storck-Tonon, D.; Morato, E.F.; Flores de Melo, A.W.; Oliveira, M.L. de. 2013. Orchid Bees of forest fragments in Southwestern Amazonia. Biota Neotropica, 13: 133-141.; Botsch et al. 2017Botsch, J.C.; Walter, S.T.; Karubian, J.; González, N.; Dobbs, E.K.; Brosi, B.J. 2017. Impacts of forest fragmentation on orchid bee (Hymenoptera: Apidae: Euglossini) communities in the Chocó biodiversity hotspot of northwest Ecuador. Journal of Insect Conservation, 21: 633-643.). Even in the absence of effects on species abundance or richness, fragmentation can still impact community composition (Botsch et al. 2017). In vertebrates such as amphibians species-specific responses tend to be negative relative to forest-edge increase (Schneider-Maunoury et al. 2016Schneider-Maunoury, L.; Lefebvre, V.; Ewers, R.M.; Medina-Rangel, Guido.F.; Peres, C.A.; Somarriba, E.; et al. 2016. Abundance signals of amphibians and reptiles indicate strong edge effects in Neotropical fragmented forest landscapes. Biological Conservation, 200: 207-215.). Birds usually respond negatively to fragmentation, and many species are affected by habitat isolation (Stouffer 2020Stouffer, P.C. 2020. Birds in fragmented Amazonian rainforest: Lessons from 40 years at the Biological Dynamics of Forest Fragments Project. The Condor, 122: duaa005.) and forest edges (Moura et al. 2016Moura, N.G.; Lees, A.C.; Aleixo, A.; Barlow, J.; Berenguer, E.; Ferreira, J.; et al. 2016. Idiosyncratic responses of Amazonian birds to primary forest disturbance. Oecologia, 180: 903-916.).
Here, we evaluate the ability of ten landscape configuration metrics (Wang et al. 2014Wang, X.; Blanchet, F.G.; Koper, N. 2014. Measuring habitat fragmentation: An evaluation of landscape pattern metrics. Methods in Ecology and Evolution, 5: 634-646.) to detect species ecological responses in a landscape under deforestation pressure. First, we quantified the performance of each metric as predictor of species occurrence and species assemblage composition. Then we asked 1) how different landscape metrics modulate the magnitude and the direction of species individual ecological responses; and 2) how species responses differ among taxonomic groups. To address these questions, we examined the occurrence of four taxonomic groups (birds, amphibians, orchid bees, and dung beetles) in 15 plots in a fragmented landscape in the northern Ecuadorian lowland Amazonia. Our results are aimed at supporting decision-makers and stakeholders in the implementation of public policies of the Agenda Nacional de Biodiversidad de Ecuador (the Ecuadorian National Agenda for Biodiversity).
MATERIAL AND METHODS
Study area
Our study took place in the municipality of Shushufindi, Sucumbíos province, Ecuador ( Figure 1). Annual precipitation exceeds 2400 mm and monthly precipitation exceeds 100 mm (INAHMI 2006INAHMI. 2006. Geoportal de información Hidrometeorológica. Tipos de climas de Ecuador. ( (http://www.serviciometeorologico.gob.ec/geoinformacion-hidrometeorologica/ ). Accessed on 01 Jun 2021.
http://www.serviciometeorologico.gob.ec/...
). This area was chosen due to its high deforestation rates and increasing anthropogenic impacts. Annual gross deforestation in Sucumbios between 2014 and 2016 exceeded 9,000 hectares (MAE 2017MAE. 2017. Mapa histórico de deforestación 2014-2016. ( (http://ide.ambiente.gob.ec/mapainteractivo/ ). Accessed on 01 Jun 2021.
http://ide.ambiente.gob.ec/mapainteracti...
). Oil extraction is the root cause of deforestation and environmental degradation in the province (Lessmann et al. 2016Lessmann, J.; Fajardo, J.; Muñoz, J.; Bonaccorso, E. 2016. Large expansion of oil industry in the Ecuadorian Amazon: biodiversity vulnerability and conservation alternatives. Ecology and Evolution, 6: 4997-5012.). The direct impact of road opening across continuous primary forest to access oil-rich areas is followed by land division and occupation by settlers. Large areas are occupied by monocultures of African palm (Elaeis guineensis), cocoa (Theobroma cacao), and coffee (Coffea spp.). Given its high deforestation rates, this area was indicated as one of the priority areas for conservation in Ecuador (Cuesta et al. 2017Cuesta, F.; Peralvo, M.; Merino-Viteri, A.; Bustamante, M.; Baquero, F.; Freile, J.F.; et al. 2017. Priority areas for biodiversity conservation in mainland Ecuador. Neotropical Biodiversity, 3: 93-106.).

Location of the study area in northeastern Ecuador (red dot on the smaller map). Forest/Non Forest classification used to calculated landscape metrics is indicated. See Table S1 in the Supplementary Matetial for the detailed landscape description. This figure is in color in the electronic version.
Sampling design
We installed 15 RAPELD plots (standardized plots for rapid assessment and long-term sampling) (Magnusson et al. 2005Magnusson, W.E.; Lima, A.P.; Luizão, R.; Luizão, F.; Costa, F.R.C.; Castilho, C.V. de; et al. 2005. RAPELD: a modification of the Gentry method for biodiversity surveys in long-term ecological research sites. Biota Neotropica, 5: 19-24.) in privately owned remnant forests (Figure 1). All plots were installed with previous authorization from landowners. All plots were 250 m long and installed in terra-firme forest of minimum 1 ha in area. A 1-km2 grid was superimposed to the study area and the RAPELD plots were installed in 15 grid cells containing representative forest remnants. The proportion of forest cover in the 1-km2 cells containing the plots varied from 15 % to 100 % (Supplementary Material, Table S1). Secondary and logged forests were avoided. RAPELD plots allow for integrated sampling of different taxonomic groups by adjusting plot width, thus making biotic data comparable among organisms with different ecological characteristics. More details on the concept and structure of RAPELD plots are available at <https://ppbio.inpa.gov.br/en/methods>.
Biodiversity surveys
We collected occurrence data (presence-absence) of birds (class Aves), amphibians (order Anura), Euglossine bees (order Hymenoptera: family Apidae), and dung beetles (order Coleoptera: family Scarabaeidae) during the month of August 2018 in each of the 15 plots. These groups were chosen because they are indicator groups that respond rapidly to landscape change (Vellend et al. 2008Vellend, M.; Lilley, P.L.; Starzomski, B.M. 2008. Using subsets of species in biodiversity surveys. Journal of Applied Ecology, 45: 161-169.).
Bird surveys were carried out at the starting point of the 250-m transect in each plot. An experienced ornithologist recorded and identified all birds seen or heard for 30 minutes within an 80-m radius, an intemendiate distance where understorey bird species can be visually identifyed (Barlow et al. 2007Barlow, J.; Mestre, L.A.M.; Gardner, T.A.; Peres, C.A. 2007. The value of primary, secondary and plantation forests for Amazonian birds. Biological Conservation, 136: 212-231.; Mestre et al. 2011Mestre, L.A.M.; Rechetelo, J.; Cochrane, M.A.; Barlow, J. 2011. Inventário da avifauna de uma área em floresta de transição no sul da Amazônia: Fazenda São Luiz, Mato Grosso, Brasil. Boletim do Museu Paraense Emílio Goeldi, Ciências Naturais, 6: 147-161.). Each plot was visited twice in different days, in hours of higher activity of most bird species, once in the morning from 06:00 to 09:00, and once in the afternoon, from 16:00 to 18:00, totalling 30 survey days.
Amphibian were surveyed for 90 minutes on two occasions on different days in each plot, once in the morning (09:00 - 12:00) and once at night (19:00 - 22:00), totalling 30 survey days. Surveys consisted of active search by two observers, one at each side of the transect, in a 2-m strip from the center of the transect (total sampling area of 1,000 m2), from the ground up to 3 m high in the vegetation. All amphibians found were captured, photographed and released.
The sampling of orchid bees was carried out using homemade traps installed every 50 m (at 0, 50, 100, 150, 200, and 250 m along the transect), totalling six traps per plot. The traps consisted of 2-L transparent plastic bottles containing aromatic baits (Ferreira et al. 2013Ferreira, R.P.; Martins, C.; Dutra, M.C.; Mentone, C.B.; Antonini, Y. 2013. Old Fragments of Forest Inside an Urban Area Are Able to Keep Orchid Bee (Hymenoptera: Apidae: Euglossini) Assemblages? The Case of a Brazilian Historical City. Neotropical Entomology, 42: 466-473.). The bottom part of each bottle was filled with an odorless detergent to trap the bees. Each alternating trap contained a bait made of cotton soaked with one of two complementary attractants (eucalyptus essential oil or clove essential oil). These attractants are commonly used to attract male orchid bees (Opedal et al. 2020Opedal, Ø.H.; Martins, A.A.; Marjakangas, E-L. 2020. A database and synthesis of euglossine bee assemblages collected at fragrance baits. Apidologie, 51: 519-530.). The traps were suspended 1.5 m above the ground in shady sites, alternating the left and right side of the transect, approximately 1 m from its central line, and were checked every 24 hours between 07:00 and 13:00 for three consecutive days. We made sure to provision the traps with a fresh amount of attractant each time they were checked. The collected bees were preserved in 70% ethanol to be later identified in the laboratory. The material was deposited in the invertebrate collection of Instituto Nacional de Biodiversidad - INABIO.
Dung beetles were sampled using pitfall traps with two types of bait: mixed human feces and decomposed meat. Two pitfall traps, each with one type of bait, were placed every 50 m, at 0, 50, 100, 150, 200, and 250 m along the central line of the transect in each plot. The traps were checked after 24 and 48 hours, totalling three sampling days per plot. Trapped beetles were collected and preserved in 70% ethanol. Specimens were identified in the laboratory by using specific dichotomous keys (Génier 1996Génier, F. 1996. A Revision of the Neotropical Genus Ontherus Erichson (Coleoptera: Scarabaeinae). The Memoirs of the Entomological Society of Canada, 128: 3-170.; Chamorro et al. 2018Chamorro, W.; Marín-Armijos, D.; Granda, V.; Vaz-de-Mello, F.Z. 2018. Listado de especies y clave de géneros y subgéneros de escarabajos estercoleros (Coleoptera: Scarabaeidae: Scarabaeinae) presentes y presuntos para Ecuador. Revista Colombiana de Entomología, 44: 72-100.). The material was deposited in the invertebrate collection of Instituto Nacional de Biodiversidad - INABIO.
Raw species data is available in the SINMBIO dataset at the Ecuadorian National Biodiversity database (https://bndb.sisbioecuador.bio/bndb/collections/index.php).
Calculation of landscape metrics
We used one fragmentation index and nine landscape configuration metrics as indicators of the degree of habitat loss and fragmentation. For that, we generated a forest/non-forest land cover layer combining three sources of information: 1) a land use map of the Sigtierras project - MAGAP (www.sigtierras.gob.ec) for the municipalities of Shushufindi, Joya de los Sachas and Orellana produced from mosaics of aerial photographs taken between 2010 and 2013 (at 1:25.000); 2) information on human land uses obtained from high-resolution images in Google Earth of 2014; and 3) global forest change maps for 2000-2017 (Hansen et al. 2013Hansen, M.C.; Potapov, P.V.; Moore, R.; Hancher, M.; Turubanova, S.A.; Tyukavina, A.; et al. 2013. High-Resolution Global maps of 21st-century forest cover change. Science, 342: 850-853.).
First, we updated the Sigtierras - MAGAP 2010-2013 map using information on anthropogenic land use obtained from on-screen scanning techniques applied to high resolution 2014 Google Earth images. Human land-use areas larger than 1 ha were digitized to maintain the original spatial scale of the Sigtierras cartography and the 30 m x 30 m resolution from the global forest-change maps. Secondly, we combined this new layer with the canopy-cover percentage for the year 2000 (i.e., percentage of larger trees higher than 5 m in each pixel) and the forest loss for 2000-2017 from the global forest-change map (Hansen et al. 2013Hansen, M.C.; Potapov, P.V.; Moore, R.; Hancher, M.; Turubanova, S.A.; Tyukavina, A.; et al. 2013. High-Resolution Global maps of 21st-century forest cover change. Science, 342: 850-853.). Thirdly, we classified pixels as forest (when they had over 80% tree cover until 2000) or non-forest. The estimated forest area for 2000 was updated according to the deforested areas between 2001 and 2017 as well as the human land-use areas obtained from the previously updated and rasterized map of the Sigtierras-MAGAP project. Our final raster was thus a binary layer of forest cover with pixels classified either as forest or non-forest.
We used this binary layer as input to calculate a fragmentation index (hereafter fragindex;Butler et al. 2014Butler, B.J.; Swenson, J.J.; Alig, R.J. 2004. Forest fragmentation in the Pacific Northwest: quantification and correlations. Forest Ecology and Management, 189: 363-373.). The fragindex is the average value of three metrics: percentage of intervened areas, i.e., the relative amount of non-forest cover in each cell; percentage of edge, i.e., the relative amount of forest with borders adjacent to anthropogenic matrices; and interspersion, a metric that measures isolation or clumping of forested areas in each cell. This combination of metrics allows the estimation and analysis of fragmentation values at the regional scale (Butler et al. 2004Butler, B.J.; Swenson, J.J.; Alig, R.J. 2004. Forest fragmentation in the Pacific Northwest: quantification and correlations. Forest Ecology and Management, 189: 363-373.). This index ranges from 0 to 100, where 0 corresponds to cells with continuous forest and 100 correspond to cells without forest. We applied the fragindex to 1-km2 cells. Single fragmentation metrics were associated with each sampling plot through the 1- km2 cells in which the plots were embedded. Landscape patterns can be measured at patch, class, or landscape level. We used the class level, which is a unit between patch and mosaic in landscape ecology (Wang et al. 2014Wang, X.; Blanchet, F.G.; Koper, N. 2014. Measuring habitat fragmentation: An evaluation of landscape pattern metrics. Methods in Ecology and Evolution, 5: 634-646.). We selected landscape units of 1 km x 1 km as adequate for the interpretation of class-level landscape metrics (Long et al. 2010Long, J.A.; Nelson, T.A.; Wulder, M.A. 2010. Characterizing forest fragmentation: Distinguishing change in composition from configuration. Applied Geography, 30: 426-435.). The fragindex calculation and forest cover maps were done using the software Qgis v 2.18.14 (QGIS Development Team 2021QGIS Development Team. 2021. QGIS Geographic Information System. Open Source Geospatial Foundation Project. (http://qgis.osgeo.org).
http://qgis.osgeo.org...
).
In addition to the fragindex, we selected nine class-level landscape metrics based on their relevance for each taxonomic group (Table 1), as they indicate various aspects of the landscape configuration, such as area, shape, core, connectivity, and edges. Metrics were obtained using the function “classStats” of the R package SDMTools (VanDerWal et al. 2014VanDerWal, J.; Falconi, L.; Januchowski, S.; Shoo, L.; Storlie, C.; VanDerWal, M.J. 2014. Package ‘SDMTools’. R package. (https://cran.r-project.org/package=SDMTools).
https://cran.r-project.org/package=SDMTo...
), which is based on the FRAGSTAT software (McGarigal et al. 2012McGarigal, K.; Cushman, S.A.; Ene, E. 2012. FRAGSTATS v4: spatial pattern analysis program for categorical and continuous maps. University of Massachusetts, Amherst. ( (http://www.umass.edu/landeco/research/fragstats/fragstats.html ). Accessed on 01 Jun 2021.
http://www.umass.edu/landeco/research/fr...
). The R codes are available at https://github.com/gamamo/FragEcuador.git.
Description of class-level landscape metrics (McGarigal et al. 2012McGarigal, K.; Cushman, S.A.; Ene, E. 2012. FRAGSTATS v4: spatial pattern analysis program for categorical and continuous maps. University of Massachusetts, Amherst. ( (http://www.umass.edu/landeco/research/fragstats/fragstats.html ). Accessed on 01 Jun 2021.
http://www.umass.edu/landeco/research/fr... ) used to evaluate the occurrence of birds, amphibians, orchid bees and dung beetles in forest fragments in the northern Ecuadorian Amazon. Ten metrics were selected based on their relevance to each taxonomic group according to literature review and expert knowledge on each group. Metrics that were relevant for each taxonomic group and retained in the modelling process are indicated. The direction of the effects (i.e., positive or negative) on habitat loss and fragmentation when these landscape metrics increase in one unit are shown in a separate column. Class-level metrics are calculated for 1-km2 cells containing the sampling plots.
Data analysis
We used the landscape metrics (Table 1) as covariates in logistic regression models to determine their relative effect on assemblage pattern and species occurrence. Each of the 15 plots was used as an independent observation unit in the analysis.
Species-level analysis
To reduce redundancy in the covariates for the logistic regression models, we pre-selected landscape metrics of relevance for each taxonomic group by analyzing the Spearman’s Rho correlation between each landscape metric (Supplementary Material, Figure S1) and by asking experts in each taxonomic group to list the variables to which assemblages were expected to respond. The set of landscape metrics differ for each taxonomic group (Table 1).
To quantify the performance of each landscape metric in explaining the probability of species occurrence (species-level approach), logistic regression models of the LASSO (Least Absolute Shrinkage and Selection Operator) family of penalized models were implemented. From the pre-selected set of variables for each assemblage, LASSO models select covariates as part of the parameter estimation process. The LASSO model tuning parameter is selected via cross-validation with the deviance and related to the penalty of the model (Bühlmann and Geer 2011Bühlmann, P.; Geer, S. van de. 2011. Statistics for High-Dimensional Data: Methods, Theory and Applications. In: Springer Series in Statistics. 1st ed. Springer Verlag, Berlin, 558p.). The higher the tuning parameter, the more covariates are left out of the models. The adjustment of the logistic regression models of the LASSO family requires both presence and absence data. Thus, for each species we simulated the same number of pseudo-absences as presences to equal weighting presences and absences (Barbet-Massin et al. 2012Barbet‐Massin, M.; Jiguet, F.; Albert, C.H.; Thuiller, W. 2012. Selecting pseudo-absences for species distribution models: how, where and how many? Methods in Ecology and Evolution, 3: 327-338.). LASSO models were limited to species observed in at least five plots, following recommendation of a minimum of nine observations for LASSO logistic models (i.e., five occurrences and five simulated pseudo-absences; Friedman et al. 2010Friedman, J.; Hastie, T.; Tibshirani, R. 2010. Regularization Paths for Generalized Linear Models via Coordinate Descent. Journal of Statistical Software, 33: 1-22.). LASSO logistic models were performed using functions from the R package glmnet (Friedman et al. 2010).
The effect of each landscape metric on each species probability of occurrence (i.e., the odds ratio) was used to interpret the logistic models. The effect was defined as the transformation of the odds ratio of every single selected metric (Supplementary Material, Table S2). As odds ratios are always positive, odds values need to be transformed to ensure the comparison between negative and positive effects. Odds ratios higher than 1 indicate a relative positive effect on the probability of occurrence, i.e., the probability of species occurrence increases as a given metric increases in one unit. In this case, we calculated the effect as odds ratio - 1. Odds ratios lower than 1 indicate a relative negative effect on the probability of occurrence, i.e., the probability of species occurrence decreases as a given landscape metric increases in one unit. In this case, the effect was calculated as 1/odds ratio - 1.
To detect spatial autocorrelation, we performed Moran’s analysis with the species richness of each taxonomic group. We obtained values close to 0 for all taxonomic groups, indicating the absence of spatial autocorrelation in species composition.
Assemblage-level analysis
To evaluate the hierarchical importance of landscape metrics in species assemblages, we used distance-based multivariate regression trees (MRT) (De’Ath 2002De’Ath, G. 2002. Multivariate regression trees: a new technique for modeling species-environment relationships. Ecology, 83: 1105-1117.). MRTs are built by repeatedly splitting sampling plots in two sets. At each split, MRT tries to minimize species dissimilarities between plots when separating plots in two sets. We calculated dissimilarities using the Bray-Curtis index for presence-absence data including all the species of each taxonomic group using the R package vegan (Oksanen et al. 2018Oksanen, J.; Blanchet, F.G.; Friendly, M.; Kindt, R.; Legendre, P.; McGlinn, D.; et al. 2018. Vegan: Community Ecology Package. (https://cran.r-project.org/web/packages/vegan/index.html).
https://cran.r-project.org/web/packages/...
). We used cross-validation to select the MRT tree with the smallest error (De’Ath 2002). The explained variation of MRT is given by the residual error of the overall tree. MRTs were calculated using the functions of the R package mvpart (Therneau and Atkinson 2013Therneau, T.M.; Atkinson, B. 2013. Mvpart: multivariate partitioning. R package. (https://mran.microsoft.com/snapshot/2014-12-11/web/packages/mvpart/index.html).
https://mran.microsoft.com/snapshot/2014...
).
RESULTS
In birds, 59 out of 138 species (42.5%) were sighted only once and no species was found in all plots. Psarocolius angustifrons was the most widespread species. In amphibians, 14 out of 46 species (30.5%) were detected only once and no species was found in all plots. The most frequent species was Pristimantis lanthanites, occurring in 12 plots. For orchid bees, Euglossa intersecta was the only species found in all plots. In contrast, 12 of 26 species (46.2%) were found only once. Of 42 species of dung beetles, five were found only once, and Deltochium crenulipes was the only species present in all plots.
Habitat loss and fragmentation effects at species-level
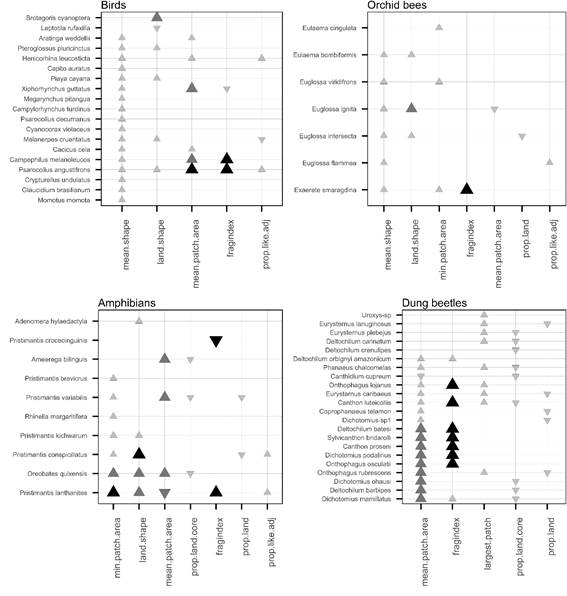
All chosen landscape metrics had some effect on the probability of individual species presence (Figure 2), albeit with different magnitudes (high, medium, and low). Birds responded positively to the increment in overall perimeter/area ratio (land.shape metric) and of the forest patches (mean.shape metric). Six species also responded positively to the increment in forest patch area, although two seemed to benefit from the decrease in forest cover (land.prop metric). Among amphibians, 70% of the species responded positively to the increment in the min.patch.area metric. Four of these responded positively to the increment in overall perimeter/area ratio (land.shape metric). Only Pristimantis lanthanites responded positively to the fragindex. Similar to birds, orchid bees responded positively to the increment in overall perimeter/area ratio (land.shape metric) and of the forest patches (mean.shape metric). A single species had a positive response to the fragindex. Most dung beetle species (72%) responded positively to the increment in the mean area of forest patches (mean.patch.area metric). In this group, 40% of the species showed a positive response to the fragindex, a number higher than for birds (10%), amphibians (10%), and orchid bees (14%).

Effect of landscape metrics on the probability of occurrence of species represented through transformed odds ratio. The magnitude of the effect of each landscape metric was classified as high, medium, or low based on the odds ratio transformed values (Table S2). Odds higher than 1 (positive effect, increase in the probability of occurrence) are represented by upside triangles; odds between 0 and 1 (negative effect, decrease in the probability of occurrence) are represented by downside triangles. Neutral effects are indicated by the absence of symbols. The magnitude of the effect is indicated by the size of the symbol (the larger the symbol, the higher the effect) and by the color (higher effects are shown in black, medium effects in dark gray and lower effects in gray). See Table 1 for the description of the variables.
Habitat loss and fragmentation effects at assemblage-level
Multivariate distance-based regression trees (Figure 3) showed that the composition of bird assemblages was mainly separated by prop.like.adj, which indicates the degree of aggregation of forest patches within the landscape (MRT residual error = 0.71). For amphibians, land.division, which measures the degree of division of forest patches, caused the main split in the MRT, followed by prop.like.adj and the fragindex (MRT residual error = 0.56). For orchid bees, mean.shape (i.e. perimeter-to-area ratio for a patch) explained about 20% of the variation of MRT, followed by prop.land (proportion of forest cover) and prop.like.adj (MRT residual error = 0.61). For dung beetles, prop.like.adj was the metric that caused the main split in the composition of the assemblage (MRT residual error = 0.65).

Effects of landscape metrics on species composition. The variables with higher importance value in explaining differences in species composition are hierarchically indicated at the upper nodes of each regression tree. The values of each variable used to separate communities are shown in front of variable names. Each tree node indicates the number of plots (n) that share similar species composition based on Bray-Curtis similarity index.
DISCUSSION
Our results revealed that over 80% of birds, amphibians, or orchid bee species were negatively affected by habitat loss and fragmentation, with a lower proportion for dung beetles (60%). More vagile taxonomic groups, such as birds were more affected than the invertebrate groups, which can make better use of the adjacent matrix (Filgueiras et al. 2015Filgueiras, B.K.C.; Tabarelli, M.; Leal, I.R.; Vaz-de-Mello, F.Z.; Iannuzzi, L. 2015. Dung beetle persistence in human-modified landscapes: Combining indicator species with anthropogenic land use and fragmentation-related effects. Ecological Indicators, 55: 65-73.). However, despite the differences among taxonomic groups, our results indicate that the landscape metrics related to the shape and area of forest patches determined the magnitude and direction of the effect on species occurrences and assemblage composition.
Species-level responses
Some bird species were negatively affected by decreasing shape complexity of forest patches, suggesting that they may benefit from a potential variety of resources available at forest edges. The probability of occurrence of those species increased in areas with high values for mean.shape and land.shape, suggesting that there is a complex trade-off between the occupation of available disturbed areas and their ecological requirement of continuous forests. The occupation of disturbed areas depends on the type of matrix, as some matrices can provide resources for some species (Ewers and Didham 2006Ewers, R.M.; Didham, R.K. 2006. Confounding factors in the detection of species responses to habitat fragmentation. Biological Reviews, 81: 117-142.). Square forest patches (with low values of mean.shape and land.shape) are common in Amazonian landscapes where dynamic agricultural activities predominate with extensive road development (Rosa et al. 2017Rosa, I.M.D.; Gabriel, C.; Carreiras, J.M.B. 2017. Spatial and temporal dimensions of landscape fragmentation across the Brazilian Amazon. Regional Environmental Change, 17: 1687-1699.). The increase of road openings in the study area may be specially harmful to local bird populations.
Orchid bees were positively affected by the shape complexity of forest patches (mean.shape and land.shape), indicating that fragments of complex shape may provide more resources and refuges. Orchid bees can be sensitive to forest edges in Amazonian landscapes (Nemésio and Silveira 2010Nemésio, A.; Silveira, F.A. 2010. Forest fragments with larger core areas better sustain diverse orchid bee faunas (Hymenoptera: Apidae: Euglossina). Neotropical Entomology, 39: 555-561.; Storck-Tonon et al. 2013Storck-Tonon, D.; Morato, E.F.; Flores de Melo, A.W.; Oliveira, M.L. de. 2013. Orchid Bees of forest fragments in Southwestern Amazonia. Biota Neotropica, 13: 133-141.), but there is still a lack of consensus regarding their ecological responses (Brosi et al. 2008Brosi, B.J.; Daily, G.C.; Shih, T.M.; Oviedo, F.; Durán, G. 2008. The effects of forest fragmentation on bee communities in tropical countryside. Journal of Applied Ecology, 45: 773-783.). Only two species in our study seemed to benefit from diminishing forest cover (metric prop.land). The probability of occurrence of Euglossa intersecta decreased with increasing forest cover and areas with high fragmentation values (fragindex) positively affected the occurrence of Exaerete smaragdina. Euglossa intersecta occurred in all plots, while E. smaragdina occurred only in plots with high or low, but not intermediate fragindex values. These bees most likely use matrix habitat as steppingstones when moving between forest areas. So, with the current landscape configuration in our study area, orchid bees seem to use forest edges and move across non-forested habitats, as observed in other parts of Amazonia (Rosa et al. 2015Rosa, J.F.; Ramalho, M.; Monteiro, D.; e Silva, M.D. 2015. Permeability of matrices of agricultural crops to Euglossina bees (Hymenoptera, Apidae) in the Atlantic Rain Forest. Apidologie, 46: 691-702.).
The probability of occurrence of some amphibian species significantly decreased in areas with lower edge density (land.shape), suggesting low tolerance of amphibians to habitat loss and fragmentation, as was also reported by Schneider-Maunoury et al. (2016Schneider-Maunoury, L.; Lefebvre, V.; Ewers, R.M.; Medina-Rangel, Guido.F.; Peres, C.A.; Somarriba, E.; et al. 2016. Abundance signals of amphibians and reptiles indicate strong edge effects in Neotropical fragmented forest landscapes. Biological Conservation, 200: 207-215.). Three species were particularly sensitive to fragmentation (Oreobates quixensis, Ameerga bilinguis, and Pristimantis variabilis). Amphibians may be less vagile than the other studied organisms because of their dependence on humidity and micro-habitats within forests, which would explain why the positive response to the increment of metrics related to forest area (i.e., min.patch.area and mean.patch.area), contrary to birds or orchid bees, whose responded more to shape metrics.
Dung beetles were the group with higher proportion of species that responded positively to the increment in fragmentation (fragindex), suggesting that habitat loss and fragmentation is not as detrimental for dung beetles as for the other taxonomic groups. Dung-beetle assemblages may not respond immediately to modifications in land use. More commonly, rare species tend to disappear from impacted areas, while several species may persist in the landscape after a disturbance, such as a road opening (Carpio et al. 2009Carpio, C.; Donoso, D.A.; Ramón, G.; Dangles, O. 2009. Short term response of dung beetle communities to disturbance by road construction in the Ecuadorian Amazon. Annales de la Société entomologique de France, 45: 455-469.).
Species responses were predominantly negative in landscapes with smaller forest patches of homogeneous shape and with less forest coverage (metric prop.land). Only a few species responded positively to the increment in the degree of fragmentation. Changes in landscape structure driven by deforestation determined species occurrence. However, our study design does not allow to discern whether the negative responses are primarily due to the amount of forest cover or how the forest cover is subdivided. Only species that were found in five or more plots were included in our explanatory species-specific models. By excluding rare species, we may have biased our results towards those species that are, to some extent, more resilient to habitat disturbance. Given that our study area has been intensively modified in the last decades, it is likely that species with higher frequencies of occurrence are those which managed to persist in the long-term due to environmental filtering (Ewers and Didham 2006Ewers, R.M.; Didham, R.K. 2006. Confounding factors in the detection of species responses to habitat fragmentation. Biological Reviews, 81: 117-142.). In any case, the predominantly negative responses to the changes in landscape configuration in our study area indicate overall detrimental effects on the surveyed taxonomic groups.
Assemblage-level responses
Species composition of birds, amphibians and dung beetles were significantly determined by metrics related to landscape connectivity. Species that occur in areas with lower connectivity are probably those that could use matrix habitats (Antongiovanni and Metzger 2005Antongiovanni, M.; Metzger, J.P. 2005. Influence of matrix habitats on the occurrence of insectivorous bird species in Amazonian forest fragments. Biological Conservation, 122: 441-451.). Specific traits, like tolerance to desiccation (Watling and Braga 2015Watling, J.; Braga, L. 2015. Desiccation resistance explains amphibian distributions in a fragmented tropical forest landscape. Landscape Ecology, 30: 1449-1459.) could explain why some amphibian species would benefit by making use of matrix habitats. Species composition of orchid bees differed mostly in plots located in landscapes with contrasting shapes, which may be due to the capacity of some species to make use of edge habitat. Differences in species composition indicate that deforestation has altered the landscape configuration to a detectable level that determines how species assemblages are structured, a process that could increase overtime. In this case, without the influence of areas that serve as population sources, species composition may get more homogeneous until assemblages are dominated by persistent species that are able to use matrix habitats.
CONCLUSIONS
We showed that species individual responses can be affected by habitat loss and fragmentation and how species composition can differ along fragmentation gradients for birds, amphibians, orchid bees, and dung beetles. At species-level, the effect was predominantly negative, with a decrease in species occurrence probability, although some species presented positive responses to landscape fragmentation. At the community level, landscape metrics determined the main differentiation in species composition. The negative response of most species to habitat fragmentation indicates that efforts to conserve continuous forests, or at least to maintain low levels of fragmentation, must be increased. Monitoring species responses, as disposed in the Agenda Nacional de Biodiversidad de Ecuador, is a fundamental part of the conservation actions. Changes in landscape configuration in Ecuadorian Amazonia should be minimized to diminish the negative effects of habitat loss and fragmentation on species occurrences and assemblage composition.
ACKNOWLEDGMENTS
We thank Ana Caluña, Jesús Toro, Esteban Calvache Palacios, Olger Licuy, Salomón Ramirez, Don Mauricio, Augusto Pauta, Otorino Coquinche, Blanca Andi, Pakiri, Marcelo, Javier Yánez, Juan Neira, Jorge Celi, Alexandra Durán, Mario Yánez, Diego Inclán and Lizbeth Andi for their support in this study. We are thankful to the INABIO for legal, technical, and institutional support. Collection permits were issued and granted by Ministério del Ambiente de Ecuador (001-19-IC-FAU-DNB/MA). This study was funded by the consortium KFW - INABIO (grant to HMOA).
REFERENCES
- Achard, F.; Beuchle, R.; Mayaux, P.; Stibig, H.-J.; Bodart, C.; Brink, A.; et al. 2014. Determination of tropical deforestation rates and related carbon losses from 1990 to 2010. Global Change Biology, 20: 2540-2554.
- Antongiovanni, M.; Metzger, J.P. 2005. Influence of matrix habitats on the occurrence of insectivorous bird species in Amazonian forest fragments. Biological Conservation, 122: 441-451.
- Barbet‐Massin, M.; Jiguet, F.; Albert, C.H.; Thuiller, W. 2012. Selecting pseudo-absences for species distribution models: how, where and how many? Methods in Ecology and Evolution, 3: 327-338.
- Barlow, J.; Mestre, L.A.M.; Gardner, T.A.; Peres, C.A. 2007. The value of primary, secondary and plantation forests for Amazonian birds. Biological Conservation, 136: 212-231.
- Bonilla-Bedoya, S.; Molina, J.R.; Macedo-Pezzopane, J.E.; Herrera-Machuca, M.A. 2014. Fragmentation patterns and systematic transitions of the forested landscape in the upper Amazon region, Ecuador 1990-2008. Journal of Forestry Research, 25: 301-309.
- Borja, M.O.; Aragón-Osejo, J.; Josse, C. 2017. Bosques de la Región Amazónica Ecuatoriana: ¿Qué nos dicen las cifras de deforestación de los últimos 15 años? Memorias y Boletines de la Universidad del Azuay, 1: 63-76.
- Botsch, J.C.; Walter, S.T.; Karubian, J.; González, N.; Dobbs, E.K.; Brosi, B.J. 2017. Impacts of forest fragmentation on orchid bee (Hymenoptera: Apidae: Euglossini) communities in the Chocó biodiversity hotspot of northwest Ecuador. Journal of Insect Conservation, 21: 633-643.
- Brosi, B.J.; Daily, G.C.; Shih, T.M.; Oviedo, F.; Durán, G. 2008. The effects of forest fragmentation on bee communities in tropical countryside. Journal of Applied Ecology, 45: 773-783.
- Bühlmann, P.; Geer, S. van de. 2011. Statistics for High-Dimensional Data: Methods, Theory and Applications In: Springer Series in Statistics 1st ed. Springer Verlag, Berlin, 558p.
- Butler, B.J.; Swenson, J.J.; Alig, R.J. 2004. Forest fragmentation in the Pacific Northwest: quantification and correlations. Forest Ecology and Management, 189: 363-373.
- Cândido, M.E.M.B.; Morato, E.F.; Storck-Tonon, D.; Miranda, P.N.; Vieira, L.J.S. 2018. Effects of fragments and landscape characteristics on the orchid bee richness (Apidae: Euglossini) in an urban matrix, southwestern Amazonia. Journal of Insect Conservation, 22: 475-486.
- Carpio, C.; Donoso, D.A.; Ramón, G.; Dangles, O. 2009. Short term response of dung beetle communities to disturbance by road construction in the Ecuadorian Amazon. Annales de la Société entomologique de France, 45: 455-469.
- Chamorro, W.; Marín-Armijos, D.; Granda, V.; Vaz-de-Mello, F.Z. 2018. Listado de especies y clave de géneros y subgéneros de escarabajos estercoleros (Coleoptera: Scarabaeidae: Scarabaeinae) presentes y presuntos para Ecuador. Revista Colombiana de Entomología, 44: 72-100.
- Cuesta, F.; Peralvo, M.; Merino-Viteri, A.; Bustamante, M.; Baquero, F.; Freile, J.F.; et al. 2017. Priority areas for biodiversity conservation in mainland Ecuador. Neotropical Biodiversity, 3: 93-106.
- De’Ath, G. 2002. Multivariate regression trees: a new technique for modeling species-environment relationships. Ecology, 83: 1105-1117.
- Ewers, R.M.; Didham, R.K. 2006. Confounding factors in the detection of species responses to habitat fragmentation. Biological Reviews, 81: 117-142.
- Fahrig, L. 2017. Ecological Responses to Habitat Fragmentation Per Se | Annual Review of Ecology, Evolution, and Systematics. Annual Review of Ecology, Evolution, and Systematics, 48: 1-23.
- Fahrig, L. 2019. Habitat fragmentation: A long and tangled tale. Global Ecology and Biogeography, 28: 33-41.
- Ferreira, R.P.; Martins, C.; Dutra, M.C.; Mentone, C.B.; Antonini, Y. 2013. Old Fragments of Forest Inside an Urban Area Are Able to Keep Orchid Bee (Hymenoptera: Apidae: Euglossini) Assemblages? The Case of a Brazilian Historical City. Neotropical Entomology, 42: 466-473.
- Filgueiras, B.K.C.; Tabarelli, M.; Leal, I.R.; Vaz-de-Mello, F.Z.; Iannuzzi, L. 2015. Dung beetle persistence in human-modified landscapes: Combining indicator species with anthropogenic land use and fragmentation-related effects. Ecological Indicators, 55: 65-73.
- Fischer, J.; Lindenmayer, D.B. 2007. Landscape modification and habitat fragmentation: a synthesis. Global Ecology and Biogeography, 16: 265-280.
- Friedman, J.; Hastie, T.; Tibshirani, R. 2010. Regularization Paths for Generalized Linear Models via Coordinate Descent. Journal of Statistical Software, 33: 1-22.
- Génier, F. 1996. A Revision of the Neotropical Genus Ontherus Erichson (Coleoptera: Scarabaeinae). The Memoirs of the Entomological Society of Canada, 128: 3-170.
- Haddad, N.M.; Brudvig, L.A.; Clobert, J.; Davies, K.F.; Gonzalez, A.; Holt, R.D.; et al 2015. Habitat fragmentation and its lasting impact on Earth’s ecosystems. Science Advances, 1: e1500052.
- Hadley, A.S.; Betts, M.G. 2016. Refocusing habitat fragmentation research using lessons from the last decade. Current Landscape Ecology Reports, 1: 55-66.
- Hansen, M.C.; Potapov, P.V.; Moore, R.; Hancher, M.; Turubanova, S.A.; Tyukavina, A.; et al 2013. High-Resolution Global maps of 21st-century forest cover change. Science, 342: 850-853.
- Hansen, M.C.; Wang, L.; Song, X.-P.; Tyukavina, A.; Turubanova, S.; Potapov, P.V.; et al 2020. The fate of tropical forest fragments. Science Advances, 6: eaax8574.
- Harada, L.M.; Araújo, I.S.; Overal, W.L.; Silva, F. a. B.; Harada, L.M.; Araújo, I.S.; et al 2020. Comparison of dung beetle communities (Coleoptera: Scarabaeidae: Scarabaeinae) in oil palm plantations and native forest in the eastern Amazon, Brazil. Revista Brasileira de Entomologia, 64: e2019102.
- INAHMI. 2006. Geoportal de información Hidrometeorológica. Tipos de climas de Ecuador ( (http://www.serviciometeorologico.gob.ec/geoinformacion-hidrometeorologica/ ). Accessed on 01 Jun 2021.
» http://www.serviciometeorologico.gob.ec/geoinformacion-hidrometeorologica/ - Laurance, W.F.; Goosem, M.; Laurance, S.G.W. 2009. Impacts of roads and linear clearings on tropical forests. Trends in Ecology & Evolution, 24: 659-669.
- Laurance, W.F.; Albernaz, A.K.M.; Schroth, G.; Fearnside, P.M.; Bergen, S.; Venticinque, E.M.; et al 2002. Predictors of deforestation in the Brazilian Amazon. Journal of Biogeography, 29: 737-748.
- Laurance, W.F.; Camargo, J.L.C.; Fearnside, P.M.; Lovejoy, T.E.; Williamson, G.B.; Mesquita, R.C.G.; et al 2017. An Amazonian rainforest and its fragments as a laboratory of global change. Biological Reviews, 93: 223-247.
- Lees, A.C.; Peres, C.A. 2009. Gap-crossing movements predict species occupancy in Amazonian forest fragments. Oikos, 118: 280-290.
- Lessmann, J.; Fajardo, J.; Muñoz, J.; Bonaccorso, E. 2016. Large expansion of oil industry in the Ecuadorian Amazon: biodiversity vulnerability and conservation alternatives. Ecology and Evolution, 6: 4997-5012.
- Lewis, S.L.; Edwards, D.P.; Galbraith, D. 2015. Increasing human dominance of tropical forests. Science, 349: 827-832.
- Long, J.A.; Nelson, T.A.; Wulder, M.A. 2010. Characterizing forest fragmentation: Distinguishing change in composition from configuration. Applied Geography, 30: 426-435.
- MAE. 2017. Mapa histórico de deforestación 2014-2016 ( (http://ide.ambiente.gob.ec/mapainteractivo/ ). Accessed on 01 Jun 2021.
» http://ide.ambiente.gob.ec/mapainteractivo/ - Magnusson, W.E.; Lima, A.P.; Luizão, R.; Luizão, F.; Costa, F.R.C.; Castilho, C.V. de; et al 2005. RAPELD: a modification of the Gentry method for biodiversity surveys in long-term ecological research sites. Biota Neotropica, 5: 19-24.
- McGarigal, K.; Cushman, S.A.; Ene, E. 2012. FRAGSTATS v4: spatial pattern analysis program for categorical and continuous maps University of Massachusetts, Amherst. ( (http://www.umass.edu/landeco/research/fragstats/fragstats.html ). Accessed on 01 Jun 2021.
» http://www.umass.edu/landeco/research/fragstats/fragstats.html - Mendes-Oliveira, A.C.; Peres, C.A.; Maués, P.C.R. de A.; Oliveira, G.L.; Mineiro, I.G.B.; de Maria, S.L.S.; et al 2017. Oil palm monoculture induces drastic erosion of an Amazonian forest mammal fauna. PLoS ONE, 12: e0187650.
- Mestre, L.A.M.; Rechetelo, J.; Cochrane, M.A.; Barlow, J. 2011. Inventário da avifauna de uma área em floresta de transição no sul da Amazônia: Fazenda São Luiz, Mato Grosso, Brasil. Boletim do Museu Paraense Emílio Goeldi, Ciências Naturais, 6: 147-161.
- Moura, N.G.; Lees, A.C.; Aleixo, A.; Barlow, J.; Berenguer, E.; Ferreira, J.; et al 2016. Idiosyncratic responses of Amazonian birds to primary forest disturbance. Oecologia, 180: 903-916.
- Nemésio, A.; Silveira, F.A. 2010. Forest fragments with larger core areas better sustain diverse orchid bee faunas (Hymenoptera: Apidae: Euglossina). Neotropical Entomology, 39: 555-561.
- Oksanen, J.; Blanchet, F.G.; Friendly, M.; Kindt, R.; Legendre, P.; McGlinn, D.; et al 2018. Vegan: Community Ecology Package (https://cran.r-project.org/web/packages/vegan/index.html).
» https://cran.r-project.org/web/packages/vegan/index.html - Opedal, Ø.H.; Martins, A.A.; Marjakangas, E-L. 2020. A database and synthesis of euglossine bee assemblages collected at fragrance baits. Apidologie, 51: 519-530.
- Pfeifer, M.; Lefebvre, V.; Peres, C.A.; Banks-Leite, C.; Wearn, O.R.; Marsh, C.J.; et al 2017. Creation of forest edges has a global impact on forest vertebrates. Nature, 551: 187-191.
- QGIS Development Team. 2021. QGIS Geographic Information System. Open Source Geospatial Foundation Project (http://qgis.osgeo.org).
» http://qgis.osgeo.org - Rosa, I.M.D.; Gabriel, C.; Carreiras, J.M.B. 2017. Spatial and temporal dimensions of landscape fragmentation across the Brazilian Amazon. Regional Environmental Change, 17: 1687-1699.
- Rosa, J.F.; Ramalho, M.; Monteiro, D.; e Silva, M.D. 2015. Permeability of matrices of agricultural crops to Euglossina bees (Hymenoptera, Apidae) in the Atlantic Rain Forest. Apidologie, 46: 691-702.
- Schneider-Maunoury, L.; Lefebvre, V.; Ewers, R.M.; Medina-Rangel, Guido.F.; Peres, C.A.; Somarriba, E.; et al 2016. Abundance signals of amphibians and reptiles indicate strong edge effects in Neotropical fragmented forest landscapes. Biological Conservation, 200: 207-215.
- Sierra, R. 2000. Dynamics and patterns of deforestation in the western Amazon: the Napo deforestation front, 1986-1996. Applied Geography 20: 1-16. doi.org/10.1016/S0143-6228(99)00014-4
» https://doi.org/doi.org/10.1016/S0143-6228(99)00014-4 - Storck-Tonon, D.; Morato, E.F.; Flores de Melo, A.W.; Oliveira, M.L. de. 2013. Orchid Bees of forest fragments in Southwestern Amazonia. Biota Neotropica, 13: 133-141.
- Stouffer, P.C. 2020. Birds in fragmented Amazonian rainforest: Lessons from 40 years at the Biological Dynamics of Forest Fragments Project. The Condor, 122: duaa005.
- Therneau, T.M.; Atkinson, B. 2013. Mvpart: multivariate partitioning. R package (https://mran.microsoft.com/snapshot/2014-12-11/web/packages/mvpart/index.html).
» https://mran.microsoft.com/snapshot/2014-12-11/web/packages/mvpart/index.html - Tonhasca, A.; Blackmer, J.L.; Albuquerque, G.S. 2002. Abundance and diversity of Euglossine bees in the fragmented landscape of the Brazilian Atlantic Forest. Biotropica, 34: 416-422.
- VanDerWal, J.; Falconi, L.; Januchowski, S.; Shoo, L.; Storlie, C.; VanDerWal, M.J. 2014. Package ‘SDMTools’. R package (https://cran.r-project.org/package=SDMTools).
» https://cran.r-project.org/package=SDMTools - Vellend, M.; Lilley, P.L.; Starzomski, B.M. 2008. Using subsets of species in biodiversity surveys. Journal of Applied Ecology, 45: 161-169.
- Vulinec, K.; Lima, A.P.; Carvalho, E.A.R.; Mellow, D.J. 2008. Dung beetles and long-term habitat fragmentation in Alter do Chão, Amazônia, Brazil. Tropical Conservation Science, 1: 111-121.
- Wang, X.; Blanchet, F.G.; Koper, N. 2014. Measuring habitat fragmentation: An evaluation of landscape pattern metrics. Methods in Ecology and Evolution, 5: 634-646.
- Watling, J.; Braga, L. 2015. Desiccation resistance explains amphibian distributions in a fragmented tropical forest landscape. Landscape Ecology, 30: 1449-1459.
- Zimbres, B.; Machado, R.B.; Peres, C.A. 2018. Anthropogenic drivers of headwater and riparian forest loss and degradation in a highly fragmented southern Amazonian landscape. Land Use Policy, 72: 354-363.
-
CITE AS: Moulatlet, G.M.; Ambriz, E.; Guevara, J.; López, K.G.; Rodes-Blanco, M.; Guerra-Arévalo, N.; Ortega-Andrade, H.M.; Meneses, P. 2021. Multi-taxa ecological responses to habitat loss and fragmentation in western Amazonia as revealed by RAPELD biodiversity surveys. Acta Amazonica 51: 234-243.
SUPPLEMENTARY MATERIAL
(only available in the electronic version)
Moulatlet et al. Multi-taxa ecological responses to habitat loss and fragmentation in western Amazonia as revealed by RAPELD biodiversity surveys
Description of the landscape around each of 15 RAPELD sampling plots in the northern Ecuadorian Amazon and the associated values of ten landscape configuration metrics of the 1-km2 cell where plots are inserted. Coordinates are in WGS84 datum. See Table 1 for landscape metrics description and Figure S2 for the landscape details around each plot.
Occurrence frequency of species of four taxonomic groups in 15 RAPELD plots in the northern Ecuadorian Amazon and transformed odds ratio from explanatory logistic models (species-level responses) for associated landscape metrics (calculated for 1-km2 cells) used as co-variable. Blank cells indicate the variable was not used in the specie’s models. When the odds ratio was higher than 1, odd ratio -1 transformation was applied; When the odds ratio was between 0 and 1, 1/odd ratio - 1 transformation was applied (see Material and Methods). See Table 1 for variable descriptions. Freq = frequency (number of plots where each species was recorded).

Edited by
ASSOCIATE EDITOR:
Publication Dates
-
Publication in this collection
20 Sept 2021 -
Date of issue
Jul-Sep 2021
History
-
Received
16 Nov 2020 -
Accepted
22 May 2021