ABSTRACT
Amphibians are the most threatened vertebrate group according to the IUCN. Land-use and land cover change (LULCC) and climate change (CC) are two of the main factors related to declining amphibian populations. Given the vulnerability of threatened and rare species, the study of their response to these impacts is a conservation priority. The aim of this work was to analyze the combined impact of LULCC and CC on the regionally endemic species Melanophryniscus sanmartini Klappenbach, 1968. This species is currently categorized as near threatened by the IUCN, and previous studies suggest negative effects of projected changes in climate. Using maximum entropy methods we modeled the effects of CC on the current and mid-century distribution of M. sanmartini under two IPCC scenarios - A2 (severe) and B2 (moderate). The effects of LULCC were studied by superimposing the potential distribution with current land use, while future distribution models were evaluated under the scenario of maximum expansion of soybean and afforestation in Uruguay. The results suggest that M. sanmartini is distributed in eastern Uruguay and the south of Brazil, mainly related to hilly and grasslands systems. Currently more than 10% of this species' distribution is superimposed by agricultural crops and exotic forest plantations. Contrasting with a recent modelling study our models suggest an expansion of the distribution of M. sanmartini by mid-century under both climate scenarios. However, despite the rise in climatically suitable areas for the species in the future, LULCC projections indicate that the proportion of modified habitats will occupy up to 25% of the distribution of M. sanmartini. Future change in climate conditions could represent an opportunity for M. sanmartini, but management measures are needed to mitigate the effects of habitat modification in order to ensure its survival and allow the eventual expansion of its distribution.
KEYWORDS
Species distribution modeling; global change; conservation; threatened species
RESUMEN
Los anfibios son el grupo de vertebrados más amenazado en la actualidad según la UICN. El cambio en el uso y cobertura del suelo (CUCS) y el cambio climático (CC) son dos de los principales factores involucrados en el fenómeno de declinación de anfibios. Por lo tanto, investigar sus impactos sobre especies amenazadas o raras es fundamental dado que su vulnerabilidad las convierte en prioridades de conservación. El objetivo de este trabajo fue evaluar conjuntamente el impacto potencial del CUCS y del CC sobre la distribución del endemismo regional Melanophryniscus sanmartini Klappenbach, 1968. Esta especie está categorizada como casi amenazada por UICN y estudios anteriores sugieren efectos negativos del CC en su distribución. Utilizando modelos de máxima entropía modelamos la distribución actual y futura (2050) de M. sanmartini, bajo dos escenarios de CC del IPCC - A2 (severo) y B2 (moderado). El efecto del CUCS fue evaluado mediante la intersección de la distribución modelada con el uso del suelo actual, mientras que los modelos de distribución futura fueron evaluados bajo un escenario de máxima expansión de soja y forestación en Uruguay. Los resultados indican que M. sanmartini se distribuye en el Este de Uruguay y Sur de Brasil, asociada a sistemas serranos y praderas. En la actualidad más del 10% de su distribución está afectada por cultivos agrícolas y forestales. Contrariamente a predicciones recientes, nuestros modelos indican una expansión de la especie hacia la mitad del siglo bajo ambos escenarios de CC analizados. Sin embargo, a pesar del aumento de zonas climáticamente favorables, las proyecciones de CUCS indican un aumento en la proporción de hábitats modificados en hasta un 25% de la distribución de M. sanmartini. Si bien el cambio en las condiciones climáticas puede representar una oportunidad a futuro para M. sanmartini, sería necesario implementar medidas de manejo para mitigar los efectos de la modificación de sus hábitats, asegurar su sobrevivencia y posibilitar una eventual expansión de su distribución.
PALABRAS-CLAVE
Modelos de distribución de especies; cambio global; conservación; especies amenazadas
Currently amphibians are the most threatened group of organisms, with 32% of the species assigned to threatened categories, 7% categorized as "Near Threatened" and 22.5% as "Data Deficient" (Stuart et al., 2004Stuart, S. N.; Chanson, J. S.; Cox, N. A.; Young, B. E.; Rodrigues, A. S. L.; Fischman, D. L. & Waller, R. W. 2004. Status and trends of amphibian declines and extinctions worldwide. Science 306:1783-1786.). While many causes have been proposed for the global decline in amphibians (Alford & Richards, 1999Alford, R. A. & Richards, S. J. 1999. Global Amphibian Declines: A Problem in Applied Ecology. Annual Review of Ecology and Systematics 30:133-165.), evidence indicates that land-use change is the most important (Becker et al., 2007Becker, C. G.; Fonseca, C. R.; Baptista Haddad, C. F.; Fernandes Batista, R. & Prado, P. I. 2007. Habitat split and the global decline of amphibians. Science 318:1775-1777.; Collins & Crump, 2009Collins, J. P. & Crump, M. L. 2009. Extinction in Our Times: Global Amphibian Decline. Oxford, Oxford University Press. 304p.). The biological characteristics of amphibians expose them to many alterations in both, aquatic and terrestrial ecosystems, making their populations highly vulnerable to land-use change (Foden et al., 2008Foden, W.; Mace, G.; Vié, J.; Angulo, A.; Butchart, S.; Devantier, L.; Dublin, H.; Gutsche, A.; Stuart, S. & Turak, E. 2008. Species susceptibility to climate change impacts. In: Vié, J. C.; Hilton-Taylor, C. & Stuart, S.N. eds. The 2008 Review of the IUCN Red List of Threatened Species. Gland, IUCN, p. 77-87.). Climate change also contributes to amphibian population decline (Alford & Richards, 1999Alford, R. A. & Richards, S. J. 1999. Global Amphibian Declines: A Problem in Applied Ecology. Annual Review of Ecology and Systematics 30:133-165.). For example, climate change has been pointed as the main cause of the global extinction of the golden toad: Bufo periglenes (Pounds et al., 1999Pounds, J. A.; Fogden, M. P. & Campbell, J. H. 1999. Biological response to climate change on a tropical mountain. Nature 398:611-615.). In addition, several studies suggest synergetic effects between climate change and chytridiomycosis, an infectious disease generated by the aquatic fungal pathogen Batrachochytrium dendrobatidis, which affects amphibian populations worldwide (Bosch et al., 2007Bosch, J.; Carrascal, L. M.; Durán, L.; Walker, S. & Fisher, M. C. 2007. Climate change and outbreaks of amphibian chytridiomycosis in a montane area of Central Spain; is there a link? Proceedings of the Royal Society B: Biological Sciences 274:253-260., Rödder et al., 2009Rödder, D.; Kielgast, J.; Bielby, J.; Schmidtlein, S.; Bosch, J.; Garner, T. W. J.; Veith, M.; Walker, S. Fisher, M. C.& Lötters, S. 2009. Global amphibian extinction risk assessment for the panzootic chytrid fungus. Diversity 1:52-66.; Bai et al., 2012Bai, C.; Liu, X.; Fisher, M. C.; Garner, T. W. & Li, Y. 2012. Global and endemic Asian lineages of the emerging pathogenic fungus Batrachochytrium dendrobatidis widely infect amphibians in China. Diversity and Distributions 18(3):307-318.).
For the previously described reasons, endangered and rare amphibians are conservation priorities. Considering the rapid progress of these threats, amphibians currently categorized as "Near Threatened" by IUCN (http://www.iucnredlist.org/) should also be considered in danger.
Melanophryniscus sanmartini Klappenbach, 1968, commonly called 'San Martin red-bellied toad', is a narrowly distributed and endemic species of the 'Uruguayan savanna ecoregion' (Maneyro & Kwet, 2008Maneyro, R. & Kwet, A. 2008. Amphibians in the border region between Uruguay and Brazil: Updated species list with comments on taxonomy and natural history (Part I: Bufonidae). Stuttgarter Beiträge zur Naturkunde A 1:95-121.). Its known distribution is divided into three regions including northeastern and southeastern Uruguay, as well as new records in southern Brazil (Zank et al., 2013Zank, C.; Colombo, P.; Adams, G.; Borba, D. & Borges-Martins, M. 2013. New country record and geographic distribution map for the San Martin red-bellied toad Melanophryniscus sanmartini Klappenbach, 1968 (Amphibia, Bufonidae). Herpetology Notes 6:555-557.). Melanophryniscus sanmartini was categorized as "Near Threatened", both globally - by the Global Amphibian Assessment (Lavilla & Langone, 2004Lavilla, E. & Langone, J. 2004. Melanophryniscus sanmartini. In: IUCN 2013. IUCN Red List of Threatened Species. Version 2013.1. Available at: <Available at: http://www.iucnredlist.org
>. Accessed on: 19/11/2013.
http://www.iucnredlist.org...
) - and nationally (Canavero et al., 2010aCanavero, A.; Carreira, S.; Langone, J. A.; Achaval, F.; Borteiro, C.; Camargo, A.; Rosa, I.; Estrades, A.; Fallabrino, A.; Kolenc, F.; López-mendilaharsu, M. M.; Maneyro, R.; Meneghel, M.; Nuñez, D.; Prigioni, C. M. & Ziegler, L. 2010a. Conservation status assessment of the amphibians and reptiles of Uruguay. Iheringia, Série Zoologia 100:5-12.). Currently the IUCN has stated that the species is close to being qualified as "Vulnerable" because its natural habitat is declining in extension and quality (GeoUruguay, 2008GeoUruguay. 2008. GEOUruguay. Informe del Estado del Ambiente. Montevideo, Programa de Naciones Unidas para el Medio Ambiente (PNUMA), Centro Latino Americano de Ecología Social (CLAES) & Dirección Nacional de Medio Ambiente (DINAMA). 352p.).
In southeastern South America the replacement of natural grasslands by crops and tree plantations are the major causes of land-use and land-cover change (LULCC) (Jobbágy et al., 2006Jobbágy, E. G.; Vasallo, M.; Farley, K. A.; Piñeiro, G.; Garbulsky, M. F.; Nosetto, M. D.; Jackson, R. B. & Paruelo, J. M. 2006 Forestación en pastizales: hacia una visión integral de sus oportunidades y costos ecológicos. Agrociencia 10:109-124.; Arbeletche & Carballo, 2007Arbeletche, P. & Carballo, C. 2007. Dinámica agrícola y cambios en el paisaje. Revista Cangüé 29:55-59.; Gautreau, 2014Gautreau, P. 2014. Forestación, territorio y ambiente. 25 años de silvicultura transnacional en Uruguay, Brasil y Argentina. Montevideo, Ediciones Trilce. 293p.). Currently, LULCC is the main threat for M. sanmartini (Maneyro & Carreira, 2012Maneyro, R. & Carreira, S. 2012. Guía de anfibios del Uruguay. Montevideo, Ediciones de la Fuga. 207p.). This species is habitat specialist of hilly grasslands that are seriously threatened by a high expansion rate of tree plantations during the last two decades (Brazeiro et al., 2015Brazeiro, A. 2015. Eco-Regiones de Uruguay: Biodiversidad, presiones y conservación. Aportes a la estrategia nacional de biodiversidad. Montevideo, Facultad de Ciencias, CIEDUR, VS-Uruguay, SZU. 122p.). Although climate change constitutes a general threat to amphibians (Pounds, 2001Pounds, J. A. 2001. Climate and amphibian declines. Nature 410:639-640. ), the 'tropicalization' of the transition zone between subtropical and temperate regions of southeastern South America, predicted for the mid-21st century could favor the geographical expansion of amphibians (Lawler et al., 2009Lawler, J. J.; Shafer, S. L.; White, D.; Kareiva, P.; Maurer, E. P.; Blaustein, A. R. & Bartlein P. J. 2009. Projected climate-induced faunal change in the Western Hemisphere. Ecology 90:588-597.; Toranza et al., 2012Toranza, C.; Brazeiro, A.& Maneyro, R.2012. Efectos del Cambio Climático sobre la Biodiversidad: El caso de los anfibios de Uruguay. In: Picasso, V.; Cruz, G.; Astigarraga, L. & Terra, R. eds. Cambio y variabilidad climática: Respuestas Interdisciplinarias Montevideo, Espacio Interdisciplinario, p. 35-50.). Nonetheless, for M. sanmartini a substantial contraction in its geographical distribution was recently predicted by Zank et al. (2014Zank, C.; Becker, F. G.; Abadie, M.; Baldo, D.; Maneyro, R.& Borges-Martins, M.2014. Climate change and the distribution of Neotropical red-bellied toads (Melanophryniscus, Anura, Amphibia): How to prioritize species and populations? PLoS ONE 9:1-11.). This scenario could be more critical to the viability of the species if LULCC was incorporated into the analysis.
The aim of the present study was to assess the potential effects of both climate change and land-use and land-cover changes on the distribution of M. sanmartini. First we modeled all its current distribution, incorporating a procedure not used before for this species, to reduce the probability of overestimation. We then modeled the future distribution, using as drivers the climate projections of one of the atmosphere-ocean general circulation models (AOGCM) with the best performance in this region (i.e., HADCM3). Finally, both the actual and future climatically modeled distribution of M. sanmartini were overlapped with land cover maps, both actual and projected according to expected agroforestry expansion in Uruguay.
MATERIALS AND METHODS
Study area. Southeast South America is a transition zone between subtropical and temperate ecosystems known as the Campos region, which occupies the south of Brazil and Uruguay. This region is dominated by grasslands with patches of seasonal deciduous forest associated with highlands, rivers and ravines (Overbeck et al., 2007Overbeck, G. E.; Müller, S. C.; Fidelis, A.; Pfadenhauer, J.; Pillar, V. D.; Blanco, C. C.; Boldrini, I. I.; Both, R. & Forneck, E. D. 2007. Brazil's neglected biome: The South Brazilian Campos. Perspectives in Plant Ecology, Evolution and Systematics 9:101-116.). From a biogeographical point of view, the region is located within the Pampean province of the Chacoan subregion, with biotic influences of the neighboring provinces (i.e. Chaco and Paranaense) (Morrone, 2001Morrone, J. J. 2001. Biogeografía de América Latina y el Caribe. Zaragoza, M&T - Manuales & Tesis, Vol. 3, SEA. 148p.; Haretche et al., 2012Haretche, F.; Mai, P. & Brazeiro, A.2012. Woody flora of Uruguay: inventory and implication within the Pampean region. Acta Botanica Brasilica 26(3):537-552.).
This region has a humid warm temperate climate with hot summers and mild winters (Kottek et al., 2006Kottek, M.; Grieser, J.; Beck, C.; Rudolf, B. & Rubel, F. 2006. World Map of the Köppen-Geiger climate classification updated. Meteorologische Zeitschrift 15:259-263.). Annual precipitation varies between 1200-1600 mm, and mean annual temperature ranges between 13 and 17 °C. The Fourth Assessment Report of the IPCC presented information on future trends in temperature and precipitation changes for different sub-regions of Latin America (Magrin et al., 2007Magrin, G.; Gay García, C.; Cruz Choque, D.; Giménez, J. C.; Moreno, A. R.; Nagy, G. J.; Nobre, C. & Villamizar, A. 2007. In: Parry, M. L.; Canziani, O. F.; Palutikof, J. P.; Van der Linden, P. J. & Hanson, C. E. eds. Climate Change 2007: Impacts, Adaptation and Vulnerability. Contribution of Working Group II to the Fourth Assessment Report of the Intergovernmental Panel on Climate Change. Cambridge, Cambridge University Press p. 581-615.). For southern South America, an increase in mean temperature and a rise in sea level are expected at the end of the 21st century. Additionally, rainfall projections for the future have higher levels of uncertainty, and different climate models show rather distinct patterns, even opposite trends (Magrin et al., 2007Magrin, G.; Gay García, C.; Cruz Choque, D.; Giménez, J. C.; Moreno, A. R.; Nagy, G. J.; Nobre, C. & Villamizar, A. 2007. In: Parry, M. L.; Canziani, O. F.; Palutikof, J. P.; Van der Linden, P. J. & Hanson, C. E. eds. Climate Change 2007: Impacts, Adaptation and Vulnerability. Contribution of Working Group II to the Fourth Assessment Report of the Intergovernmental Panel on Climate Change. Cambridge, Cambridge University Press p. 581-615.).
Distribution modeling. Species distribution modelling is rooted in ecological niche theory because it models a fragment fundamental niche of the species, which is defined as the "climatic niche" (Pearson & Dawson, 2003Pearson, R. & Dawson, T. 2003. Predicting the impacts of climate change on the distribution of species: are bioclimate envelope models useful? Global Ecology and Biogeography 12:361-367.). Our study was based on maximum entropy modeling of the current and future distribution of M. sanmartini. This technique estimates a target probability distribution by finding the probability distribution of maximum entropy, subject to a set of constraints that represent our incomplete information about the target distribution (Phillips et al., 2006Phillips, S. J.; Anderson, R. P. & Schapire, R. E. 2006. Maximum entropy modeling of species geographic distributions. Ecological Modeling 190:231-259.). Namely, the model estimates the potential distribution of a species by linking its sample locations with a set of environmental variables; the output of the model gives the suitability of each cell, as a function of its environmental similarity to those cells with the species was collected.
We obtained occurrence data of M. sanmartini from 13 locations: 10 from Uruguay and 3 from Brazil. The main sources were herpetological collections from Uruguay [Colección de Zoología Vertebrados, Facultad de Ciencias (ZVCB) and Museo Nacional de Historia Natural (MNHN)] and the scientific literature (Núñez et al., 2004Núñez, D.; Maneyro, R. Langone, J. & De Sá, R. O. 2004. Distribución geográfica de la fauna de anfibios del Uruguay. Smithsonian Herpetological Information Service 134:1-34.; Zank et al., 2013Zank, C.; Colombo, P.; Adams, G.; Borba, D. & Borges-Martins, M. 2013. New country record and geographic distribution map for the San Martin red-bellied toad Melanophryniscus sanmartini Klappenbach, 1968 (Amphibia, Bufonidae). Herpetology Notes 6:555-557.). For current and future modeling, 37 environmental variables (Tab. I), acquired from the Worldclim database were included (Hijmans et al., 2005Hijmans, R. J.; Cameron, S. E.; Parra, J. L.; Jones, P. G. & Jarvis, A. 2005. Very high resolution interpolated climate surfaces for global land areas. International Journal of Climatology 25:1965-1978.). Climate variables were monthly averages of several meteorological stations during 1950-2000, while altitude corresponded to the "Shuttle Radar Topography Mission" (SRTM) (Hijmans et al., 2005Hijmans, R. J.; Cameron, S. E.; Parra, J. L.; Jones, P. G. & Jarvis, A. 2005. Very high resolution interpolated climate surfaces for global land areas. International Journal of Climatology 25:1965-1978.). All environmental layers had a spatial resolution of 2.5 minutes.
List of environmental variables included in the Maxent modelling of current and future potential distribution of Melanophryniscus sanmartini Klappenbach, 1968. Data source: Worldclim. Variables numbers indicates the month (i.e. Tmin1= minimum temperature of January).
Modeling was conducted with Maxent software version 3.3.3k (Phillips et al., 2006Phillips, S. J.; Anderson, R. P. & Schapire, R. E. 2006. Maximum entropy modeling of species geographic distributions. Ecological Modeling 190:231-259.). We used the default settings of Maxent: 500 iterations, duplicate records removal, convergence threshold (0.00001), and regularization parameter β (1) (Phillips et al., 2006Phillips, S. J.; Anderson, R. P. & Schapire, R. E. 2006. Maximum entropy modeling of species geographic distributions. Ecological Modeling 190:231-259.). To analyze the relationship among variables we selected linear, quadratic and interactive effects features. The contribution of each environmental variable to the model was evaluated with a Jackknife test. Due to the low number of occurrence records, the sample was not divided into test and training samples. The models performance were evaluated through the area under the curve (AUC), obtained from the receiver operating characteristic curve (ROC). AUC represents an overall measure of model performance across all thresholds and strengths of a prediction and summarizes the model's ability to rank presence records higher than absences records (Franklin, 2010Franklin, J. 2010. Mapping species distributions: spatial inference and prediction. Cambridge, Cambridge University Press. 320p.). Although small sample sizes might lead to a decreased in the model predictability, it has been shown that Maxent has good performance even when using small sample sizes (Hernandez et al., 2006Hernandez, P. A.; Graham, C. H.; Master, L. L. & Albert, D. L. 2006. The effect of sample size and species characteristics on performance of different species distribution modeling methods. Ecography 29(5):773-785.). We first applied the "Minimum training presence" threshold to convert continuous maps into presence-absence distribution, as suggested for endemic and narrowly distributed species (L. Gomes-Cortes, unpubl. data).
Species distribution models estimate the potential distribution of species based on presence-only data (Franklin, 2010Franklin, J. 2010. Mapping species distributions: spatial inference and prediction. Cambridge, Cambridge University Press. 320p.). To obtain an 'adjusted distribution', it is useful to incorporate information on the locations where the species is absent, avoiding overestimation of its geographical extent (Pineda & Lobo, 2009Pineda, E. & Lobo, J. M. 2009. Assessing the accuracy of species distribution models to predict amphibian species richness patterns. Journal of Animal Ecology 78:182-190.). Here we applied the method proposed by Pineda & Lobo (2009)Pineda, E. & Lobo, J. M. 2009. Assessing the accuracy of species distribution models to predict amphibian species richness patterns. Journal of Animal Ecology 78:182-190. to check for omission or commission errors based on well-known cells of amphibians in Uruguay, which comprises the greater portion of M. sanmartini known distribution. We started by pre-selecting those cells with 100 or more amphibian records. Such "sampling effort" was described as adequate for sampling amphibian species richness (Canavero et al., 2010bCanavero, A.; Brazeiro, B.; Camargo, A.; da Rosa, I.; Maneyro, R. & Núñez, D. 2010b. Amphibian diversity of Uruguay: Background knowledge, inventory completeness and sampling coverage. Boletín de la Sociedad Zoológica de Uruguay 19(2ª época):2-19.). The number of records was considered as an indicator of sampling effort (Hortal & Lobo, 2005Hortal, J. & Lobo, J. M. 2005. An ED-based protocol for optimal sampling of biodiversity. Biodiversity and Conservation 14:2913-2047.). Then we built a matrix of species records by cell and apply different species richness estimators: Chao1, Chao2 and Jacknife 1 using the program EstimateS v8.2. (Appendix 1 Appendix 1: 1. Identification of well-known cells for amphibians in Uruguay. Nonparametric estimators of species richness Chao1= S + a2/2b S: number of species observed a: number of species represented by one individual in the sample b: number of species represented by two individual in the sample Chao2= S + L2/2M L: singletons (number of species with only a single occurrence in the sample) M: doubletons (number of species with exactly two occurrences in the sample) Jack 1= S+L (m-1/m) m: total number of samples ). Those cells with an observed richness equal to or greater than 75% of maximum richness given by the estimators were consider a 'well-known cells', and therefore observed absences were validated as true. Then we adjusted the original model seeking the best fit with the occurrences and new "true absences". This methodology allowed us to improve the results validation and reduce commission errors.
Climate and land use change scenarios. To assess the future distribution of M. sanmartini in the Campos region (southern Brazil and Uruguay), we used the output of the AOGCM of the Hadley Centre -HADCM3- for 2050. This model was selected because downloads study suggest that it has one of the best performance to fit the climate of this region (Bidegain & Camilloni, 2006Bidegain, M. & Camilloni, I. 2006. Performance of GCMs and climate future scenarios for Southeastern South AmericaIn: International Conference on Southern Hemisphere Meteorology and Oceanography (ICSHMO), 8, Foz do Iguaçu, Proceedings. São José dos Campos, INPE, p. 223-226.). Future modelling was done under two IPCC socioeconomic scenarios: A2 (severe) and B2 (moderate) (IPCC, 2001IPCC. 2001. Cambio Climático 2001: Informe de síntesis. London, IPCC. 38p.). Assessment of the effects of LULCC was made on the basis that both advancement of crops and tree plantations negatively affect the viability of M. sanmartini through loss of natural habitat and degradation of soils and water (Foley et al., 2005Foley, J. A.; Defries, R.; Asner, G. P.; Barford, C.; Bonan, G.; Carpenter, S. R.; Chapin, F. S.; Coe, M. T.; Daily, G. C.; Gibbs, H. K.; Helkowski, J. H.; Holloway, T.; Howard, E. A.; Kucharik, C. J.; Monfreda, C.; Patz, J. A.; Prentice, I. C.; Ramankutty, N. & Snyder P. K. 2005. Global consequences of land use. Science 309:570-574.).
In order to explore current and future impacts of land-use change on the distribution of M. sanmartini, we analyzed the surface area currently affected by agriculture and tree plantations and under a land-use change scenario for 2030. Due to the lack of information about the land use change and future scenarios of change from southern Brazil, the effects of LULCC were analyzed only for Uruguay portion of distribution. First, we overlapped the current distribution with a land-use map of Uruguay, generated from satellite imagery analysis (LANDSAT 5TM, scale 1:120.000) from 2012 (Achkar et al., 2012Achkar, M.; Brazeiro, A. & Bartesaghi, L. 2012. Principales amenazas para la conservación de la biodiversidad de Uruguay. Informe Técnico. Montevideo, Convenio MGAP/PPR - Facultad de Ciencias/Vida Silvestre/ Sociedad Zoológica del Uruguay/CIEDUR. 21p.). Then, maps of modeled future distribution for each scenario (A2 and B2) were overlapped with a map of land-use change scenario developed for 2030, based on expectations of production growth under the assumption of maximum expansion of soybean cultivation and forestry in Uruguay (Brazeiro et al., 2008Brazeiro, A.; Achkar, A.; Toranza, C. & Barthesagui, L. 2008. Potenciales impactos del cambio de uso de suelo sobre la biodiversidad terrestre de Uruguay. In: Volpedo, A. V. & Fernández-Reyes, L. eds. Efecto de los cambios globales sobre la biodiversidad. Madrid, Programa CYTED, p. 7-21.). We thus obtained maps that reflected the degree of land alteration due to crops and forestry, within those areas where the potential presence of the species was predicted. This analysis was done only for Uruguay, due to the lack of land-use change scenarios for southeastern Brazil. However, the land-use change trends are very similar in the whole Campos region (Gautreau, 2014Gautreau, P. 2014. Forestación, territorio y ambiente. 25 años de silvicultura transnacional en Uruguay, Brasil y Argentina. Montevideo, Ediciones Trilce. 293p.).
RESULTS
Distribution models. According to our model M. sanmartini is currently distributed in Uruguay and southern Brazil. The distribution model was robust with an AUC of 0.997. The validation procedure applied here detected 26 'well-known cells' for amphibians for Uruguay (Appendix 1 Appendix 1: 1. Identification of well-known cells for amphibians in Uruguay. Nonparametric estimators of species richness Chao1= S + a2/2b S: number of species observed a: number of species represented by one individual in the sample b: number of species represented by two individual in the sample Chao2= S + L2/2M L: singletons (number of species with only a single occurrence in the sample) M: doubletons (number of species with exactly two occurrences in the sample) Jack 1= S+L (m-1/m) m: total number of samples ). This analysis indicates that M. sanmartini is absent from all of western and central Uruguay. Based on the foregoing, we discard the a priori selected threshold (minimum training presence= 0.304), and applied a larger and more conservative threshold (lowest 10% percentile in the training records= 0.683). The presence/absence distribution obtained covers all the species' records, with the exception of one locality in Sierra de San Miguel (Fig. 1). The use of smaller thresholds to include this record lead to an overestimated distribution with a significant increase in commission errors. The extent of occurrence of the species occupies 79,665 km2, which mainly comprises hilly grasslands. The Jacknife test indicated that minimum temperature of June was the variable with the highest gain when used in isolation, while December precipitation and altitude were the environmental variables that decreased the gain the most when they were omitted.
For both IPCC scenarios (A2 and B2) the AUC was > 0.995. Both models predicted an expansion of the geographical range of M. sanmartini (Fig. 1), but none model capture the San Miguel location. For 2050 the suitable area for the species would occupy 218,710 km2 and 121,737 km2 according to A2 and B2 scenarios, respectively. This implies a potential expansion of the species of 175% and 53% under the A2 and B2 scenarios, respectively. The two studied scenarios predict an expansion of the range size of M. sanmartini in the west and southwest direction, while the Río de la Plata represents a geographic barrier for the southwards expansion of the species.

Current and future potential distribution of Melanophryniscus sanmartini Klappenbach, 1968 modeled with Maxent program using climate variables and applying '10th percentile training presence' threshold.
Potential effects of land-use change. A large proportion of the M. sanmartini distribution range is in Uruguay (72% -57,793 km2). The assessment of land use cover reveals that at present 12% of the species distribution range in Uruguay is used for agro-forestry purposes, with 6% corresponding to agricultural areas and 6% to forested areas (Fig. 2). Crops are located mainly in lowlands, while forestry is distributed in the hilly areas and ravines (Fig. 2).

Current land-use within the distribution area of Melanophryniscus sanmartini Klappenbach, 1968 in Uruguay. Distribution of crops and exotic forest plantations (light gray) are shown separately within the distribution of the species.
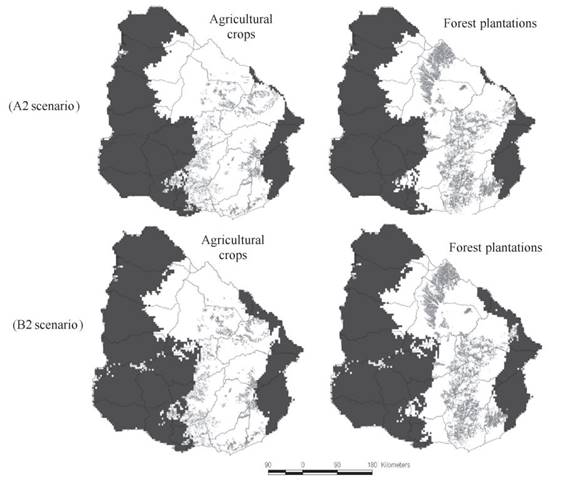
Even though the distribution range of M. sanmartini could expand by 2050, the area devoted to agriculture and exotic forest plantations in Uruguay would also increase according to the LULCC scenario (Fig. 3). By mid-century about 22% and 25% of the projected distribution of M. sanmartini in Uruguay would be devoted to crops and forestry under A2 and B2 scenarios respectively (Fig. 3). It should be highlighted that even when the proportion of cultures and forest plantations increase in the future, according to the models the total area not under agro-forest systems or 'cultures-free area' in the distribution of M. sanmartini would also increase with respect to the present (Fig. 4).
Combine effects of land-use and land cover change and climate change on the potential distribution of Melanophryniscus sanmartini Klappenbach, 1968 by mid-century in Uruguay. Distribution of crops and exotic forest plantations (light gray) are shown separately within the future distribution range of the species, under A2 and B2 emission scenarios.

Projected change in the total area of distribution and in the area free of agro-forest crops of Melanophryniscus sanmartini Klappenbach, 1968 under two emission scenarios by mid-century.
DISCUSSION
Species distribution models are considered a useful tool to predict species' potential distribution (Thuiller et al., 2006Thuiller, W.; Lavorel, S.; Sykes, M. T. & Araújo, M. B. 2006. Using niche-based modelling to assess the impact of climate change on tree functional diversity in Europe. Diversity and Distributions 12:49-60.; Franklin, 2010Franklin, J. 2010. Mapping species distributions: spatial inference and prediction. Cambridge, Cambridge University Press. 320p.). Our results suggest that the current distribution of M. sanmartini is higher than the currently known distribution. The model predicts an expansion of the M. sanmartini distribution by mid-century, under both IPCC scenarios considered. Moreover, the species expansion in range would exceed the loss of suitable habitats due to land-use change projected for Uruguay.
Our study suggest a continuous potential distribution of M. sanmartini across the landscape, although the known distribution is considered disjunct (Lavilla & Langone, 2004Lavilla, E. & Langone, J. 2004. Melanophryniscus sanmartini. In: IUCN 2013. IUCN Red List of Threatened Species. Version 2013.1. Available at: <Available at: http://www.iucnredlist.org
>. Accessed on: 19/11/2013.
http://www.iucnredlist.org...
). The species is associated with ravines and the biological corridor 'Sierras del Este - Serra do Sudeste', a system of low hills extending from southern Brazil to southeastern Uruguay.
The potential distribution of M. sanmartini predicted here is far smaller, about half of the modelled distribution proposed by Zank et al. (2014Zank, C.; Becker, F. G.; Abadie, M.; Baldo, D.; Maneyro, R.& Borges-Martins, M.2014. Climate change and the distribution of Neotropical red-bellied toads (Melanophryniscus, Anura, Amphibia): How to prioritize species and populations? PLoS ONE 9:1-11.). Aside from the use of different AOGCM and sets of climatic variables (see Zank et al., 2014Zank, C.; Becker, F. G.; Abadie, M.; Baldo, D.; Maneyro, R.& Borges-Martins, M.2014. Climate change and the distribution of Neotropical red-bellied toads (Melanophryniscus, Anura, Amphibia): How to prioritize species and populations? PLoS ONE 9:1-11.), there is a key factor determining such a difference between both modelling studies. The validation procedure applied here contributes to avoid commission errors, and thus allows us to get a distribution more similar to the 'realized distribution' of the species (Pineda & Lobo, 2009Pineda, E. & Lobo, J. M. 2009. Assessing the accuracy of species distribution models to predict amphibian species richness patterns. Journal of Animal Ecology 78:182-190.). Likewise, the applied threshold (i.e. '10th percentile training presence') to get presence/absence maps is conservative in estimating species distribution (Zhu et al., 2012Zhu, G.; Petersen, M. J. & Bu, W. 2012. Selecting biological meaningful environmental dimensions of low discrepancy among ranges to predict potential distribution of bean plataspid invasion. PLoS ONE 7(9):e46247.), and avoids the overestimation (Jarnevich & Reynolds, 2011Jarnevich, C. S. & Reynolds, L. V. 2011. Challenges of predicting the potential distribution of a slow-spreading invader: a habitat suitability map for an invasive riparian tree. Biological Invasions 13(1):153-163.). This is particularly relevant when studying endangered species.
The model-predicted absence of M. sanmartini at the Sierra de San Miguel -where the species was actually recorded - deserves special attention. The Maxent output predicts low suitability of San Miguel locality for this species. Such omission error is related to the selected threshold, which predicts absent the 10% most extreme presence observation, assuming that extreme could represent errors or unusual microclimatic condition in a cell (Morueta-Holme et al., 2010Morueta-Holme, N.; Flojgaard, C. & Svenning, J. C. 2010. Climate change risks and conservation implications for a threatened small-range mammal species. PLoS ONE 5:e10360.). The record at Sierra de San Miguel is reliable, but the site-specific climatic conditions of this locality are unusual within the range size of M. sanmartini. Sierra de San Miguel is very close to the coastline and has a strong oceanic influence, therefore temperatures are lower than the other localities where the species is found (Dinama, 2005Dinama. 2005. Análisis de la estadística climática y desarrollo y evaluación de escenarios climáticos e hidrológicos de las principales cuencas hidrográficas del Uruguay y de su Zona Costera (Río Uruguay, Río Negro, Laguna Merín, Río de la Plata y Océano Atlántico). Montevideo, Unidad de Cambio Climático/MVOTMA. 85p.). Despite the climatic difference and the relative geographic isolation, this locality have the typical 'hilly physiognomy' of the habitat used for M. sanmartini. This suggest that the presence of this amphibian in Sierra de San Miguel could be better explained by habitat than by climatic suitability. Anyway, despite the minor omission error of the model in the case of San Miguel, the procedure applied here to select the proper threshold allowed us to prevent major commission errors.
In contrast with previous models for M. sanmartini (Zank et al., 2014Zank, C.; Becker, F. G.; Abadie, M.; Baldo, D.; Maneyro, R.& Borges-Martins, M.2014. Climate change and the distribution of Neotropical red-bellied toads (Melanophryniscus, Anura, Amphibia): How to prioritize species and populations? PLoS ONE 9:1-11.), our model suggests an expansion in distribution range by mid-century under the IPCC scenarios considered (A2 and B2). Our predictions agree with the recently reported effect of climate change on the amphibians of Uruguay (Toranza et al., 2012Toranza, C.; Brazeiro, A.& Maneyro, R.2012. Efectos del Cambio Climático sobre la Biodiversidad: El caso de los anfibios de Uruguay. In: Picasso, V.; Cruz, G.; Astigarraga, L. & Terra, R. eds. Cambio y variabilidad climática: Respuestas Interdisciplinarias Montevideo, Espacio Interdisciplinario, p. 35-50.). This result also coincides with the poleward expansion expected for subtropical amphibians under climatic conditions projected for the 21st century in South America (Lawler et al., 2009Lawler, J. J.; Shafer, S. L.; White, D.; Kareiva, P.; Maurer, E. P.; Blaustein, A. R. & Bartlein P. J. 2009. Projected climate-induced faunal change in the Western Hemisphere. Ecology 90:588-597.). Amphibian distribution in temperate regions is highly constrained by low temperatures (Wiens et al., 2006Wiens, J. J.; Graham, C. H.; Moen, D. S.; Smith, S. A. & Reeder, T. W. 2006. Evolutionary and Ecological causes of the Latitudinal Diversity Gradient in Hylid Frogs: Treefrog Trees Unearth the Roots of High Tropical Diversity. The American Naturalist 168:579-596.). According to our analysis the minimum temperature of the coldest month had a strong influence on M. sanmartini distribution. The predicted increases in temperature could favor the expansion of the species in the future, representing therefore an opportunity to recover its status from the near threatened category. Melanophryniscus sanmartini could take an advantage of this opportunity to expand depending on habitat availability in future landscapes as mediated by land use change.
LULCC is primarily responsible for the global amphibian decline (Todd et al., 2009Todd, B. D.; Luhring, T. M.; Rothermel, B. B. & Gibbons, J. W. 2009. Effects of forest removal on amphibian migrations: implications for habitat and landscape connectivity. Journal of Applied Ecology 46:554-561.). Forestry expansion has been identified as the main risk factor for M. sanmartini (Lavilla & Langone, 2004Lavilla, E. & Langone, J. 2004. Melanophryniscus sanmartini. In: IUCN 2013. IUCN Red List of Threatened Species. Version 2013.1. Available at: <Available at: http://www.iucnredlist.org
>. Accessed on: 19/11/2013.
http://www.iucnredlist.org...
). Our study shows that 12% of its distribution is currently affected by agro-forestry activities. Moreover, according to land use change scenarios the total surface area of crops and forestry will increase in coming decades. Despite the projected expansion of suitable climatic zones for the species, its conservation and eventual expansion in the future depends upon habitat availability and quality.
Another effect of LULCC is habitat fragmentation (Foley et al., 2005Foley, J. A.; Defries, R.; Asner, G. P.; Barford, C.; Bonan, G.; Carpenter, S. R.; Chapin, F. S.; Coe, M. T.; Daily, G. C.; Gibbs, H. K.; Helkowski, J. H.; Holloway, T.; Howard, E. A.; Kucharik, C. J.; Monfreda, C.; Patz, J. A.; Prentice, I. C.; Ramankutty, N. & Snyder P. K. 2005. Global consequences of land use. Science 309:570-574.; Fischer & Lindenmayer, 2007Fischer, J. & Lindenmayer, D. 2007. Landscape modification and habitat fragmentation: a synthesis. Global Ecology and Biogeography 16:265-280.). One of the main impacts of fragmentation is limiting species movement between patches of suitable habitat, due to the presence of a hostile landscape matrix that generates isolation (Weinsheimer et al., 2010Weinsheimer, F.; Mengistu, A. A. & Rödder, D.2010. Potential distribution of threatened Leptopelis spp. (Anura, Arthroleptidae) in Ethiopia derived from climate and land-cover data. Endangered Species Research 9:117-124.). Previous studies show the negative impact of fragmentation on the persistence of amphibian populations by limiting their ability to disperse (Funk et al., 2005Funk, W. C.; Blouin, M. S.; Corn, P. S.; Maxell, B. A.; Pilliod, D. S.; Amish, S. & Allendorf, F. W. 2005. Population structure of Columbia spotted frogs (Rana luteiventris) is strongly affected by the landscape. Molecular Ecology 14:483-496.) and increasing demographic stochasticity (Cushman, 2006Cushman, S. A. 2006. Effects of habitat loss and fragmentation on amphibians: A review and prospectus. Biological Conservations 28:231-240.). The effects of the agro-forestry expansion on the fragmentation of M. sanmartini habitat are still unknown.
The consequences of predicted climate change on species could be considered as a threat or an opportunity; undoubtedly an expansion in the size of a species range is an opportunity. However, it is necessary to implement management measures aimed to ensure survival and effectively allow the expansion of M. sanmartini. The Campos region is one of the most globally threatened biomes due to land use changes and also one of the least protected (Overbeck et al., 2007Overbeck, G. E.; Müller, S. C.; Fidelis, A.; Pfadenhauer, J.; Pillar, V. D.; Blanco, C. C.; Boldrini, I. I.; Both, R. & Forneck, E. D. 2007. Brazil's neglected biome: The South Brazilian Campos. Perspectives in Plant Ecology, Evolution and Systematics 9:101-116.). Conservation actions are urgent in order stop the loss of natural habitat and curb species extinction.
Studies such as this show the importance of considering the projections of both, climate and land use change, in order to implement effective strategies for long-term conservation. A deeper understanding of the biology of M. sanmartini would increase the effectiveness of management measures to be implemented to conserve this species, currently categorized as "Near Threatened".
Acknowledgments
C.T. thank National Graduate Fellowship from ANII (Agencia Nacional de Investigación e Innovación) and the Master's Program for Biology of PEDECIBA (Programa de Desarrollo de las Ciencias Básicas), Facultad de Ciencias, Universidad de la República, Uruguay. Authors thank Christine Lucas for revision of English.
REFERENCES
- Achkar, M.; Brazeiro, A. & Bartesaghi, L. 2012. Principales amenazas para la conservación de la biodiversidad de Uruguay. Informe Técnico. Montevideo, Convenio MGAP/PPR - Facultad de Ciencias/Vida Silvestre/ Sociedad Zoológica del Uruguay/CIEDUR. 21p.
- Alford, R. A. & Richards, S. J. 1999. Global Amphibian Declines: A Problem in Applied Ecology. Annual Review of Ecology and Systematics 30:133-165.
- Arbeletche, P. & Carballo, C. 2007. Dinámica agrícola y cambios en el paisaje. Revista Cangüé 29:55-59.
- Bai, C.; Liu, X.; Fisher, M. C.; Garner, T. W. & Li, Y. 2012. Global and endemic Asian lineages of the emerging pathogenic fungus Batrachochytrium dendrobatidis widely infect amphibians in China. Diversity and Distributions 18(3):307-318.
- Becker, C. G.; Fonseca, C. R.; Baptista Haddad, C. F.; Fernandes Batista, R. & Prado, P. I. 2007. Habitat split and the global decline of amphibians. Science 318:1775-1777.
- Bidegain, M. & Camilloni, I. 2006. Performance of GCMs and climate future scenarios for Southeastern South AmericaIn: International Conference on Southern Hemisphere Meteorology and Oceanography (ICSHMO), 8, Foz do Iguaçu, Proceedings. São José dos Campos, INPE, p. 223-226.
- Bosch, J.; Carrascal, L. M.; Durán, L.; Walker, S. & Fisher, M. C. 2007. Climate change and outbreaks of amphibian chytridiomycosis in a montane area of Central Spain; is there a link? Proceedings of the Royal Society B: Biological Sciences 274:253-260.
- Brazeiro, A. 2015. Eco-Regiones de Uruguay: Biodiversidad, presiones y conservación. Aportes a la estrategia nacional de biodiversidad. Montevideo, Facultad de Ciencias, CIEDUR, VS-Uruguay, SZU. 122p.
- Brazeiro, A.; Achkar, A.; Toranza, C. & Barthesagui, L. 2008. Potenciales impactos del cambio de uso de suelo sobre la biodiversidad terrestre de Uruguay. In: Volpedo, A. V. & Fernández-Reyes, L. eds. Efecto de los cambios globales sobre la biodiversidad. Madrid, Programa CYTED, p. 7-21.
- Canavero, A.; Carreira, S.; Langone, J. A.; Achaval, F.; Borteiro, C.; Camargo, A.; Rosa, I.; Estrades, A.; Fallabrino, A.; Kolenc, F.; López-mendilaharsu, M. M.; Maneyro, R.; Meneghel, M.; Nuñez, D.; Prigioni, C. M. & Ziegler, L. 2010a. Conservation status assessment of the amphibians and reptiles of Uruguay. Iheringia, Série Zoologia 100:5-12.
- Canavero, A.; Brazeiro, B.; Camargo, A.; da Rosa, I.; Maneyro, R. & Núñez, D. 2010b. Amphibian diversity of Uruguay: Background knowledge, inventory completeness and sampling coverage. Boletín de la Sociedad Zoológica de Uruguay 19(2ª época):2-19.
- Collins, J. P. & Crump, M. L. 2009. Extinction in Our Times: Global Amphibian Decline. Oxford, Oxford University Press. 304p.
- Cushman, S. A. 2006. Effects of habitat loss and fragmentation on amphibians: A review and prospectus. Biological Conservations 28:231-240.
- Dinama. 2005. Análisis de la estadística climática y desarrollo y evaluación de escenarios climáticos e hidrológicos de las principales cuencas hidrográficas del Uruguay y de su Zona Costera (Río Uruguay, Río Negro, Laguna Merín, Río de la Plata y Océano Atlántico). Montevideo, Unidad de Cambio Climático/MVOTMA. 85p.
- Fischer, J. & Lindenmayer, D. 2007. Landscape modification and habitat fragmentation: a synthesis. Global Ecology and Biogeography 16:265-280.
- Foden, W.; Mace, G.; Vié, J.; Angulo, A.; Butchart, S.; Devantier, L.; Dublin, H.; Gutsche, A.; Stuart, S. & Turak, E. 2008. Species susceptibility to climate change impacts. In: Vié, J. C.; Hilton-Taylor, C. & Stuart, S.N. eds. The 2008 Review of the IUCN Red List of Threatened Species. Gland, IUCN, p. 77-87.
- Foley, J. A.; Defries, R.; Asner, G. P.; Barford, C.; Bonan, G.; Carpenter, S. R.; Chapin, F. S.; Coe, M. T.; Daily, G. C.; Gibbs, H. K.; Helkowski, J. H.; Holloway, T.; Howard, E. A.; Kucharik, C. J.; Monfreda, C.; Patz, J. A.; Prentice, I. C.; Ramankutty, N. & Snyder P. K. 2005. Global consequences of land use. Science 309:570-574.
- Franklin, J. 2010. Mapping species distributions: spatial inference and prediction. Cambridge, Cambridge University Press. 320p.
- Funk, W. C.; Blouin, M. S.; Corn, P. S.; Maxell, B. A.; Pilliod, D. S.; Amish, S. & Allendorf, F. W. 2005. Population structure of Columbia spotted frogs (Rana luteiventris) is strongly affected by the landscape. Molecular Ecology 14:483-496.
- Gautreau, P. 2014. Forestación, territorio y ambiente. 25 años de silvicultura transnacional en Uruguay, Brasil y Argentina. Montevideo, Ediciones Trilce. 293p.
- GeoUruguay. 2008. GEOUruguay. Informe del Estado del Ambiente. Montevideo, Programa de Naciones Unidas para el Medio Ambiente (PNUMA), Centro Latino Americano de Ecología Social (CLAES) & Dirección Nacional de Medio Ambiente (DINAMA). 352p.
- Haretche, F.; Mai, P. & Brazeiro, A.2012. Woody flora of Uruguay: inventory and implication within the Pampean region. Acta Botanica Brasilica 26(3):537-552.
- Hernandez, P. A.; Graham, C. H.; Master, L. L. & Albert, D. L. 2006. The effect of sample size and species characteristics on performance of different species distribution modeling methods. Ecography 29(5):773-785.
- Hijmans, R. J.; Cameron, S. E.; Parra, J. L.; Jones, P. G. & Jarvis, A. 2005. Very high resolution interpolated climate surfaces for global land areas. International Journal of Climatology 25:1965-1978.
- Hortal, J. & Lobo, J. M. 2005. An ED-based protocol for optimal sampling of biodiversity. Biodiversity and Conservation 14:2913-2047.
- IPCC. 2001. Cambio Climático 2001: Informe de síntesis. London, IPCC. 38p.
- Jarnevich, C. S. & Reynolds, L. V. 2011. Challenges of predicting the potential distribution of a slow-spreading invader: a habitat suitability map for an invasive riparian tree. Biological Invasions 13(1):153-163.
- Jobbágy, E. G.; Vasallo, M.; Farley, K. A.; Piñeiro, G.; Garbulsky, M. F.; Nosetto, M. D.; Jackson, R. B. & Paruelo, J. M. 2006 Forestación en pastizales: hacia una visión integral de sus oportunidades y costos ecológicos. Agrociencia 10:109-124.
- Kottek, M.; Grieser, J.; Beck, C.; Rudolf, B. & Rubel, F. 2006. World Map of the Köppen-Geiger climate classification updated. Meteorologische Zeitschrift 15:259-263.
- Lavilla, E. & Langone, J. 2004. Melanophryniscus sanmartini. In: IUCN 2013. IUCN Red List of Threatened Species. Version 2013.1. Available at: <Available at: http://www.iucnredlist.org >. Accessed on: 19/11/2013.
» http://www.iucnredlist.org - Lawler, J. J.; Shafer, S. L.; White, D.; Kareiva, P.; Maurer, E. P.; Blaustein, A. R. & Bartlein P. J. 2009. Projected climate-induced faunal change in the Western Hemisphere. Ecology 90:588-597.
- Magrin, G.; Gay García, C.; Cruz Choque, D.; Giménez, J. C.; Moreno, A. R.; Nagy, G. J.; Nobre, C. & Villamizar, A. 2007. In: Parry, M. L.; Canziani, O. F.; Palutikof, J. P.; Van der Linden, P. J. & Hanson, C. E. eds. Climate Change 2007: Impacts, Adaptation and Vulnerability. Contribution of Working Group II to the Fourth Assessment Report of the Intergovernmental Panel on Climate Change. Cambridge, Cambridge University Press p. 581-615.
- Maneyro, R. & Carreira, S. 2012. Guía de anfibios del Uruguay. Montevideo, Ediciones de la Fuga. 207p.
- Maneyro, R. & Kwet, A. 2008. Amphibians in the border region between Uruguay and Brazil: Updated species list with comments on taxonomy and natural history (Part I: Bufonidae). Stuttgarter Beiträge zur Naturkunde A 1:95-121.
- Morrone, J. J. 2001. Biogeografía de América Latina y el Caribe. Zaragoza, M&T - Manuales & Tesis, Vol. 3, SEA. 148p.
- Morueta-Holme, N.; Flojgaard, C. & Svenning, J. C. 2010. Climate change risks and conservation implications for a threatened small-range mammal species. PLoS ONE 5:e10360.
- Núñez, D.; Maneyro, R. Langone, J. & De Sá, R. O. 2004. Distribución geográfica de la fauna de anfibios del Uruguay. Smithsonian Herpetological Information Service 134:1-34.
- Overbeck, G. E.; Müller, S. C.; Fidelis, A.; Pfadenhauer, J.; Pillar, V. D.; Blanco, C. C.; Boldrini, I. I.; Both, R. & Forneck, E. D. 2007. Brazil's neglected biome: The South Brazilian Campos Perspectives in Plant Ecology, Evolution and Systematics 9:101-116.
- Pearson, R. & Dawson, T. 2003. Predicting the impacts of climate change on the distribution of species: are bioclimate envelope models useful? Global Ecology and Biogeography 12:361-367.
- Phillips, S. J.; Anderson, R. P. & Schapire, R. E. 2006. Maximum entropy modeling of species geographic distributions. Ecological Modeling 190:231-259.
- Pineda, E. & Lobo, J. M. 2009. Assessing the accuracy of species distribution models to predict amphibian species richness patterns. Journal of Animal Ecology 78:182-190.
- Pounds, J. A. 2001. Climate and amphibian declines. Nature 410:639-640.
- Pounds, J. A.; Fogden, M. P. & Campbell, J. H. 1999. Biological response to climate change on a tropical mountain. Nature 398:611-615.
- Rödder, D.; Kielgast, J.; Bielby, J.; Schmidtlein, S.; Bosch, J.; Garner, T. W. J.; Veith, M.; Walker, S. Fisher, M. C.& Lötters, S. 2009. Global amphibian extinction risk assessment for the panzootic chytrid fungus. Diversity 1:52-66.
- Stuart, S. N.; Chanson, J. S.; Cox, N. A.; Young, B. E.; Rodrigues, A. S. L.; Fischman, D. L. & Waller, R. W. 2004. Status and trends of amphibian declines and extinctions worldwide. Science 306:1783-1786.
- Thuiller, W.; Lavorel, S.; Sykes, M. T. & Araújo, M. B. 2006. Using niche-based modelling to assess the impact of climate change on tree functional diversity in Europe. Diversity and Distributions 12:49-60.
- Todd, B. D.; Luhring, T. M.; Rothermel, B. B. & Gibbons, J. W. 2009. Effects of forest removal on amphibian migrations: implications for habitat and landscape connectivity. Journal of Applied Ecology 46:554-561.
- Toranza, C.; Brazeiro, A.& Maneyro, R.2012. Efectos del Cambio Climático sobre la Biodiversidad: El caso de los anfibios de Uruguay. In: Picasso, V.; Cruz, G.; Astigarraga, L. & Terra, R. eds. Cambio y variabilidad climática: Respuestas Interdisciplinarias Montevideo, Espacio Interdisciplinario, p. 35-50.
- Weinsheimer, F.; Mengistu, A. A. & Rödder, D.2010. Potential distribution of threatened Leptopelis spp. (Anura, Arthroleptidae) in Ethiopia derived from climate and land-cover data. Endangered Species Research 9:117-124.
- Wiens, J. J.; Graham, C. H.; Moen, D. S.; Smith, S. A. & Reeder, T. W. 2006. Evolutionary and Ecological causes of the Latitudinal Diversity Gradient in Hylid Frogs: Treefrog Trees Unearth the Roots of High Tropical Diversity. The American Naturalist 168:579-596.
- Zank, C.; Colombo, P.; Adams, G.; Borba, D. & Borges-Martins, M. 2013. New country record and geographic distribution map for the San Martin red-bellied toad Melanophryniscus sanmartini Klappenbach, 1968 (Amphibia, Bufonidae). Herpetology Notes 6:555-557.
- Zank, C.; Becker, F. G.; Abadie, M.; Baldo, D.; Maneyro, R.& Borges-Martins, M.2014. Climate change and the distribution of Neotropical red-bellied toads (Melanophryniscus, Anura, Amphibia): How to prioritize species and populations? PLoS ONE 9:1-11.
- Zhu, G.; Petersen, M. J. & Bu, W. 2012. Selecting biological meaningful environmental dimensions of low discrepancy among ranges to predict potential distribution of bean plataspid invasion. PLoS ONE 7(9):e46247.
Appendix 1:
1. Identification of well-known cells for amphibians in Uruguay.
Nonparametric estimators of species richness
Chao1= S + a2/2b
S: number of species observed
a: number of species represented by one individual in the sample
b: number of species represented by two individual in the sample
Chao2= S + L2/2M
L: singletons (number of species with only a single occurrence in the sample)
M: doubletons (number of species with exactly two occurrences in the sample)
Jack 1= S+L (m-1/m)
m: total number of samples
Publication Dates
-
Publication in this collection
30 June 2015
History
-
Received
15 Oct 2014 -
Accepted
16 June 2015