Abstract
Leprosy is an infectious and contagious spectral disease accompanied by a series of immunological events triggered by the host response to the aetiologic agent, Mycobacterium leprae . The induction and maintenance of the immune/inflammatory response in leprosy are linked to multiple cell interactions and soluble factors, primarily through the action of cytokines. The purpose of the present study was to evaluate the serum levels of tumour necrosis factor (TNF)-α and its soluble receptors (sTNF-R1 and sTNF-R2) in leprosy patients at different stages of multidrug treatment (MDT) in comparison with non-infected individuals and to determine their role as putative biomarkers of the severity of leprosy or the treatment response. ELISA was used to measure the levels of these molecules in 30 healthy controls and 37 leprosy patients at the time of diagnosis and during and after MDT. Our results showed increases in the serum levels of TNF-α and sTNF-R2 in infected individuals in comparison with controls. The levels of TNF-α, but not sTNF-R2, decreased with treatment. The current results corroborate previous reports of elevated serum levels of TNF-α in leprosy and suggest a role for sTNF-R2 in the control of this cytokine during MDT.
leprosy; TNF-α; sTNF-R1; sTNF-R2
Leprosy is the oldest known human chronic infectious disease and is caused by Mycobacterium leprae ( Hastings & Opromolla 1994Hastings R, Opromolla D 1994. Leprosy. In J CK, Pathology of leprosy , 2nd ed., Churchill Livingstone, Edinburgh, p. 266-268. , Mendonça et al. 2008Mendonça VA, Costa RD, Brito-Melo GEA, Antunes CM, Teixeira AL 2008. Imunologia da hanseníase. An Bras Dermatol 83 : 343-350. ). It is the leading infectious cause of motor disability. Despite the significant decrease in its prevalence over the past 50 years, its transmission continues and leprosy remains a major public health problem in developing countries ( Rodrigues & Lockwood 2011Rodrigues LC, Lockwood D 2011. Leprosy now: epidemiology, progress, challenges and research gaps. Lancet Infect Dis 11 : 464-470. ).
Leprosy is characterised by chronic granulomatous inflammation of the skin and peripheral nerves and the clinical presentation differs according to the type of adaptive immune response developed by the host ( Rodrigues & Lockwood 2011Rodrigues LC, Lockwood D 2011. Leprosy now: epidemiology, progress, challenges and research gaps. Lancet Infect Dis 11 : 464-470. ). The immunopathogenesis of leprosy is primarily due to interaction among subsets of T cells, antigen-presenting cells and M. leprae antigens, generating a clinicopathologic spectrum categorised according to the Ridley-Jopling criteria, which are based on skin lesions and bacterial load ( Ridley & Jopling 1962Ridley DS, Jopling WH 1962. A classification of leprosy for research purposes. Lepr Rev 33 : 119-128. ). Tuberculoid disease displays few lesions with no detectable mycobacteria and is the result of enhanced cell-mediated immunity with a predominant T-helper (Th)1 immune response characterised by increased release of interferon (IFN)-γ, interleukin (IL)-2, tumour necrosis factor (TNF)-α and lymphotoxin-α, intense phagocytic activity and granuloma development with CD4 + lymphocyte infiltration ( Modlin 1994Modlin RL 1994. Th1-Th2 paradigm: insights from leprosy. J Invest Dermatol 102 : 828-832. , Spellberg & Edwards Jr 2001Spellberg B, Edwards Jr JE 2001. Type 1/type 2 immunity in infectious diseases. Clin Infect Dis 32 : 76-102. ). Alternatively, lepromatous leprosy patients (LL) have multiple lesions with varying degrees of bacterial load and the immune response is characterised by diminished cell-mediated immunity with a predominant Th2 immune response, poor granuloma formation associated with high levels of IL-4, IL-5 and IL-10 and a preponderance of CD8 + lymphocytes in the lesions ( Modlin 1994Modlin RL 1994. Th1-Th2 paradigm: insights from leprosy. J Invest Dermatol 102 : 828-832. , Spellberg & Edwards Jr 2001Spellberg B, Edwards Jr JE 2001. Type 1/type 2 immunity in infectious diseases. Clin Infect Dis 32 : 76-102. ). Between these two poles are borderline leprosy types, in which patients have multiple lesions and unstable immunity.
Despite advances in the understanding of the pathogenesis of leprosy and the development of new therapeutic strategies, there is a need for the identification and/or validation of biomarkers that can be used for early diagnosis, for discrimination between different forms of the disease and, moreover, as prognostic markers ( Spencer et al. 2012Spencer JS, Duthie MS, Geluk A, Balagon MF, Kim HJ, Wheat WH, Chatterjee D, Jackson M, Li W, Kurihara JN, Maghanoy A, Mallari I, Saunderson P, Brennan PJ, Dockrell HM 2012. Identification of serological biomarkers of infection, disease progression and treatment efficacy for leprosy. Mem Inst Oswaldo Cruz 107 (Suppl. I): 79-89. ). In this scenario, considering the diversity of the clinical forms of leprosy and that the outcome of infection appears to depend on the predominant T lymphocyte subpopulation and when and how a certain cytokine is produced ( Scollard et al. 2006aScollard DM, Adams LB, Gillis TP, Krahenbuhl JL, Truman RW, Williams DL 2006a. The continuing challenges of leprosy. Clin Microbiol Rev 19 : 338-381. ), immune mediators and their receptors can be regarded as putative biomarkers in leprosy.
TNF-α, a cytokine released by several cell types, although primarily by macrophages, is considered to be essential for protective immunity and plays a role in granuloma formation. TNF-α has also been shown to be an important tissue damage mediator in the absence of regulatory factors ( Kindler et al. 1989Kindler V, Sappino AP, Grau GE, Piguet PF, Vassalli P 1989. The inducing role of tumor necrosis factor in the development of bactericidal granulomas during BCG infection. Cell 56 : 731-740. ). TNF-α-induced biological activities are mediated by two structurally related, but functionally distinct receptors: TNF-R1 (55 kDa) and TNF-R2 (75 kDa). TNF-R1 is expressed by all cell types, whereas TNF-R2 is primarily expressed by T and B lymphocytes, endothelial cells and myeloid cells. Both receptors can be cleaved at the cell surface and released as soluble forms into the circulation (sTNF-R1 and sTNF-R2) ( Aderka et al. 1992Aderka D, Engelmann H, Maor Y, Brakebusch C, Wallach D 1992. Stabilization of the bioactivity of tumor necrosis factor by its soluble receptors. J Exp Med 175 : 323-329. , Aderka 1996Aderka D 1996. The potential biological and clinical significance of the soluble tumor necrosis factor receptors. Cytokine Growth Factor Rev 7 : 231-240. ). The homeostatic relationships between cytokines and their natural inhibitors play an important role in the pathogenesis of acute and chronic inflammatory diseases. The soluble forms of the receptors compete with the cell surface receptors for “free” TNF-α. Therefore, they can act to antagonise the effects of the cytokine, as carriers of TNF-α through different compartments or as cytokine stabilisers extending the TNF-α half-life ( Aderka et al. 1992Aderka D, Engelmann H, Maor Y, Brakebusch C, Wallach D 1992. Stabilization of the bioactivity of tumor necrosis factor by its soluble receptors. J Exp Med 175 : 323-329. , Aderka 1996Aderka D 1996. The potential biological and clinical significance of the soluble tumor necrosis factor receptors. Cytokine Growth Factor Rev 7 : 231-240. , Corvino et al. 2007Corvino CL, Mamoni RL, Fagundes GZ, Blotta MH 2007. Serum interleukin-18 and soluble tumour necrosis factor receptor 2 are associated with disease severity in patients with paracoccidioidomycosis. Clin Exp Immunol 147 : 483-490. ). It has been reported that serum levels of sTNF-R1 and sTNF-R2 may have predictive value for the clinical severity of infectious diseases such as malaria, tuberculosis and bacterial endocarditis ( Modlin et al. 1988Modlin RL, Melancon-Kaplan J, Young SM, Pirmez C, Kino H, Convit J, Rea TH, Bloom BR 1988. Learning from lesions: patterns of tissue inflammation in leprosy. Proc Natl Acad Sci USA 85 : 1213-1217. , Kern et al. 1993Kern WV, Engel A, Schieffer S, Prummer O, Kern P 1993. Circulating tumor necrosis factor alpha (TNF), soluble TNF receptors and interleukin-6 in human subacute bacterial endocarditis. Infect Immun 61 : 5413-5416. , Keuter et al. 1994Keuter M, Dharmana E, Gasem MH, van der Ven-Jongekrijg J, Djokomoeljanto R, Dolmans WM, Demacker P, Sauerwein R, Gallati H, van der Meer JW 1994. Patterns of proinflammatory cytokines and inhibitors during typhoid fever. J Infect Dis 169 : 1306-1311. , Munk et al. 1999Munk ME, Anding P, Schettini AP, Cunha MG, Kaufmann SH 1999. Soluble tumor necrosis factor alpha receptors in sera from leprosy patients. Infect Immun 67 : 423-425. ).
The serum levels of cytokines, cytokine receptors, cell activation markers and anti-phenolic glycolipid-1 antibodies have been investigated across the leprosy spectrum and reaction types ( Moubasher et al. 1998aMoubasher AD, Kamel NA, Zedan H, Raheem DD 1998a. Cytokines in leprosy. I. Serum cytokine profile in leprosy. Int J Dermatol 37 : 733-740. , Faber et al. 2004Faber WR, Iyer AM, Fajardo TT, Dekker T, Villahermosa LG, Abalos RM, Das PK 2004. Serial measurement of serum cytokines, cytokine receptors and neopterin in leprosy patients with reversal reactions. Lepr Rev 75 : 274-281. , Iyer et al. 2007Iyer A, Hatta M, Usman R, Luiten S, Oskam L, Faber W, Geluk A, Das P 2007. Serum levels of interferon-γ, tumour necrosis factor-α, soluble interleukin-6R and soluble cell activation markers for monitoring response to treatment of leprosy reactions. Clin Exp Immunol 150 : 210-216. , Silva et al. 2007Silva EA, Iyer A, Ura S, Lauris JR, Naafs B, Das PK, Vilani-Moreno F 2007. Utility of measuring serum levels of anti-PGL-I antibody, neopterin and C-reactive protein in monitoring leprosy patients during multi-drug treatment and reactions. Trop Med Int Health 12 : 1450-1458. ). To our knowledge, only one study has assessed the serum levels of sTNF-R1 and sTNF-R2 in leprosy, but they were assessed during the investigation of markers for reversal reactions, not during multidrug therapy (MDT) ( Faber et al. 2004Faber WR, Iyer AM, Fajardo TT, Dekker T, Villahermosa LG, Abalos RM, Das PK 2004. Serial measurement of serum cytokines, cytokine receptors and neopterin in leprosy patients with reversal reactions. Lepr Rev 75 : 274-281. ).
In this study, we investigated whether TNF-α and its soluble receptors can be regarded as biomarkers for monitoring leprosy patients during MDT. With modification of the pro-inflammatory status of leprosy patients during MDT, changes in the serum levels of different mediators, such as TNF-α and sTNFRs, are also expected.
PATIENTS, MATERIALS AND METHODS
Patients - This was an exploratory, descriptive, longitudinal study, including 37 new leprosy cases followed throughout MDT and 30 non-infected individuals (NI) from an endemic area. This study was conducted at the Dermatology Day Care Clinic of the Eduardo de Menezes Hospital, Sanitary Dermatology Reference Centre of the Minas Gerais State Hospital Foundation (FHEMIG), in Belo Horizonte, Brazil, from May 2006-December 2007.
Data collection began after the project was approved by the Committee of Ethics in Research of Eduardo de Menezes Hospital and Santa Casa de Misericórdia , Belo Horizonte. All of the subjects were asked to provide their written informed consent to participate.
The diagnosis and classification of leprosy were based on a clinical assessment including a detailed history, careful medical and dermatological examinations and detection of acid-fast bacilli in skin-slit smears. Only patients who showed a positive response to treatment with complete clinical remission were included in this study, preventing any confounding effect due to a lack of response to treatment. No recruited patient developed leprosy reactions during the treatment follow-up.
The following variables were assessed: sex, age, number of skin and nerve lesions, bacilloscopy, ML Flow serology and the Operational Criteria of the World Health Organization ( WHO 1997WHO - World Health Organization 1997. A guide to eliminating leprosy as a public health problem , 2nd ed., WHO, Geneva, 106 pp. , 1998WHO - World Health Organization 1998. WHO Expert Committee on Leprosy: seventh report , WHO, Geneva, 43 pp. ). Serum samples were used to measure the levels of TNF-α and sTNF-R1 and sTNF-R2. In cases of leprosy, blood collection was performed three times (pretreatment with MDT, 2nd dose and post-MDT); in the healthy controls, blood was collected only once. Fewer patients underwent peripheral blood collection at the second dose than at the pre and post-treatment time points due to non-attendance rate of 42%.
Determination of TNF-α, sTNF-R1 and sTNF-R2 levels in the serum - After blood centrifugation, the serum was collected and stored at -80ºC until analysis. As routinely performed in our laboratory, serum levels of TNF-α, sTNF-R1 and sTNF-R2 were measured by sandwich ELISA following the protocol provided by the manufacturer (R&D Systems, Minneapolis, MS, USA) ( Alessandri et al. 2006Alessandri AL, Souza AL, Oliveira SC, Macedo GC, Teixeira MM, Teixeira AL 2006. Concentrations of CXCL8, CXCL9 and sTNFR1 in plasma of patients with pulmonary tuberculosis undergoing treatment. Inflamm Res 55 : 528-533. , Barbosa et al. 2011Barbosa IG, Huguet RB, Mendonça VA, Sousa LP, Neves FS, Bauer ME, Teixeira AL 2011. Increased plasma levels of soluble TNF receptor I in patients with bipolar disorder. Eur Arch Psychiatry Clin Neurosci 261 : 139-143. ). All samples were assessed in duplicate. The results were expressed in pg/mL. The intra-assay variability and inter-assay variability were below 10%. The detection limits for these assays were 3 pg/mL for TNF-α and 5 pg/mL for sTNF-R1 and sTNF-R2.
Statistical analysis - For data analyses, the following methods were used: measures of central tendency and variability, the Mann-Whitney U test for the comparison of TNF-α, sTNF-R1 and sTNF-R2 levels between the patients (pre-MDT) and controls, the Wilcoxon test for comparing the molecule levels pre-MDT and in other stages and the generalised linear model ( Pisa et al. 1990Pisa P, Gennene M, Soder O, Ottenhoff T, Hansson M, Kiessling R 1990. Serum tumor necrosis factor levels and disease dissemination in leprosy and leishmaniasis. J Infect Dis 161 : 988-991. ) for repeated measures with three factors (F test), comparing the kinetics of the molecule levels throughout treatment. In addition, receiver operating characteristic (ROC) curves ( van der Schouw et al. 1992van der Schouw YT, Verbeek AL, Ruijs JH 1992. ROC curves for the initial assessment of new diagnostic tests. Fam Pract 9 : 506-511. ) were calculated to define the best cut-off point for the prediction of a positive leprosy case. Statistical significance was set at p < 0.05.
RESULTS
Demographic and clinical features - The clinical features of the 37 leprosy patients enrolled in this study are presented in Table . The control group (NI) was composed of 30 NI from the endemic area, matched by age and sex [median age, years (range): 46.5 (26-75); sex M/F: 17/13].
Adult males approximately 50 years old represent the majority of the leprosy patients (54.1%). The patients were classified according to the WHO Operational Criteria. Thirty-three patients (89.2%) were classified as multibacillary and four as paucibacillary. Thirty-one cases (83.8%) showed more than five cutaneous lesions with more than one peripheral nerve affected.
Changes in TNF-α, sTNF-R1 and sTNF-R2 levels during MDT treatment - During the development of leprosy and, moreover, throughout MDT treatment, the levels of critical inflammatory cytokines and their modulators changed. In this regard, the median TNF-α level was approximately 13-fold higher in pre-treatment patients (65 pg/mL) than in control subjects (5 pg/mL). This level diminished in a statistically significant manner after the second dose (~5 pg/mL) and levels comparable to those of the controls were maintained thereafter ( Fig. 1 ).
serum levels of tumour necrosis factor (TNF)-α from leprosy patients in different time points along multidrug therapy (MDT). Traces represent median values. NI: non-infected subjects; Post: Mycobacterium leprae infected subjects after treatment; Pre: M. leprae infected subjects before treatment; second dose: M. leprae infected subjects after second dose of MDT; *: p ≤ 0.05 between NI-Pre; #: p ≤ 0.05 between Pre, second dose and Post.
As significant changes in the serum levels of TNF-α were observed after treatment, we next analysed the levels of sTNF-R1 and sTNF-R2. The levels of sTNF-R1 did not differ between any of the time points studied ( Fig. 2 ). However, the sTNF-R2 levels were higher in leprosy patients (median of 2,359 pg/mL) when compared with the uninfected control group (median of 1,940 pg/mL) ( Fig. 3 ). After the second MDT dose, there was a significant increase in sTNF-R2 levels (median of 2,738 pg/mL), which remained elevated after treatment ( Fig. 3 ). To better characterise the involvement of sTNF-R2 during leprosy treatment, we used a generalised linear model for repeated measures with three factors (F test) to compare the kinetics of this molecule throughout treatment. The results confirmed that the levels of sTNF-R2 increased after the second MDT dose and remained elevated after treatment.
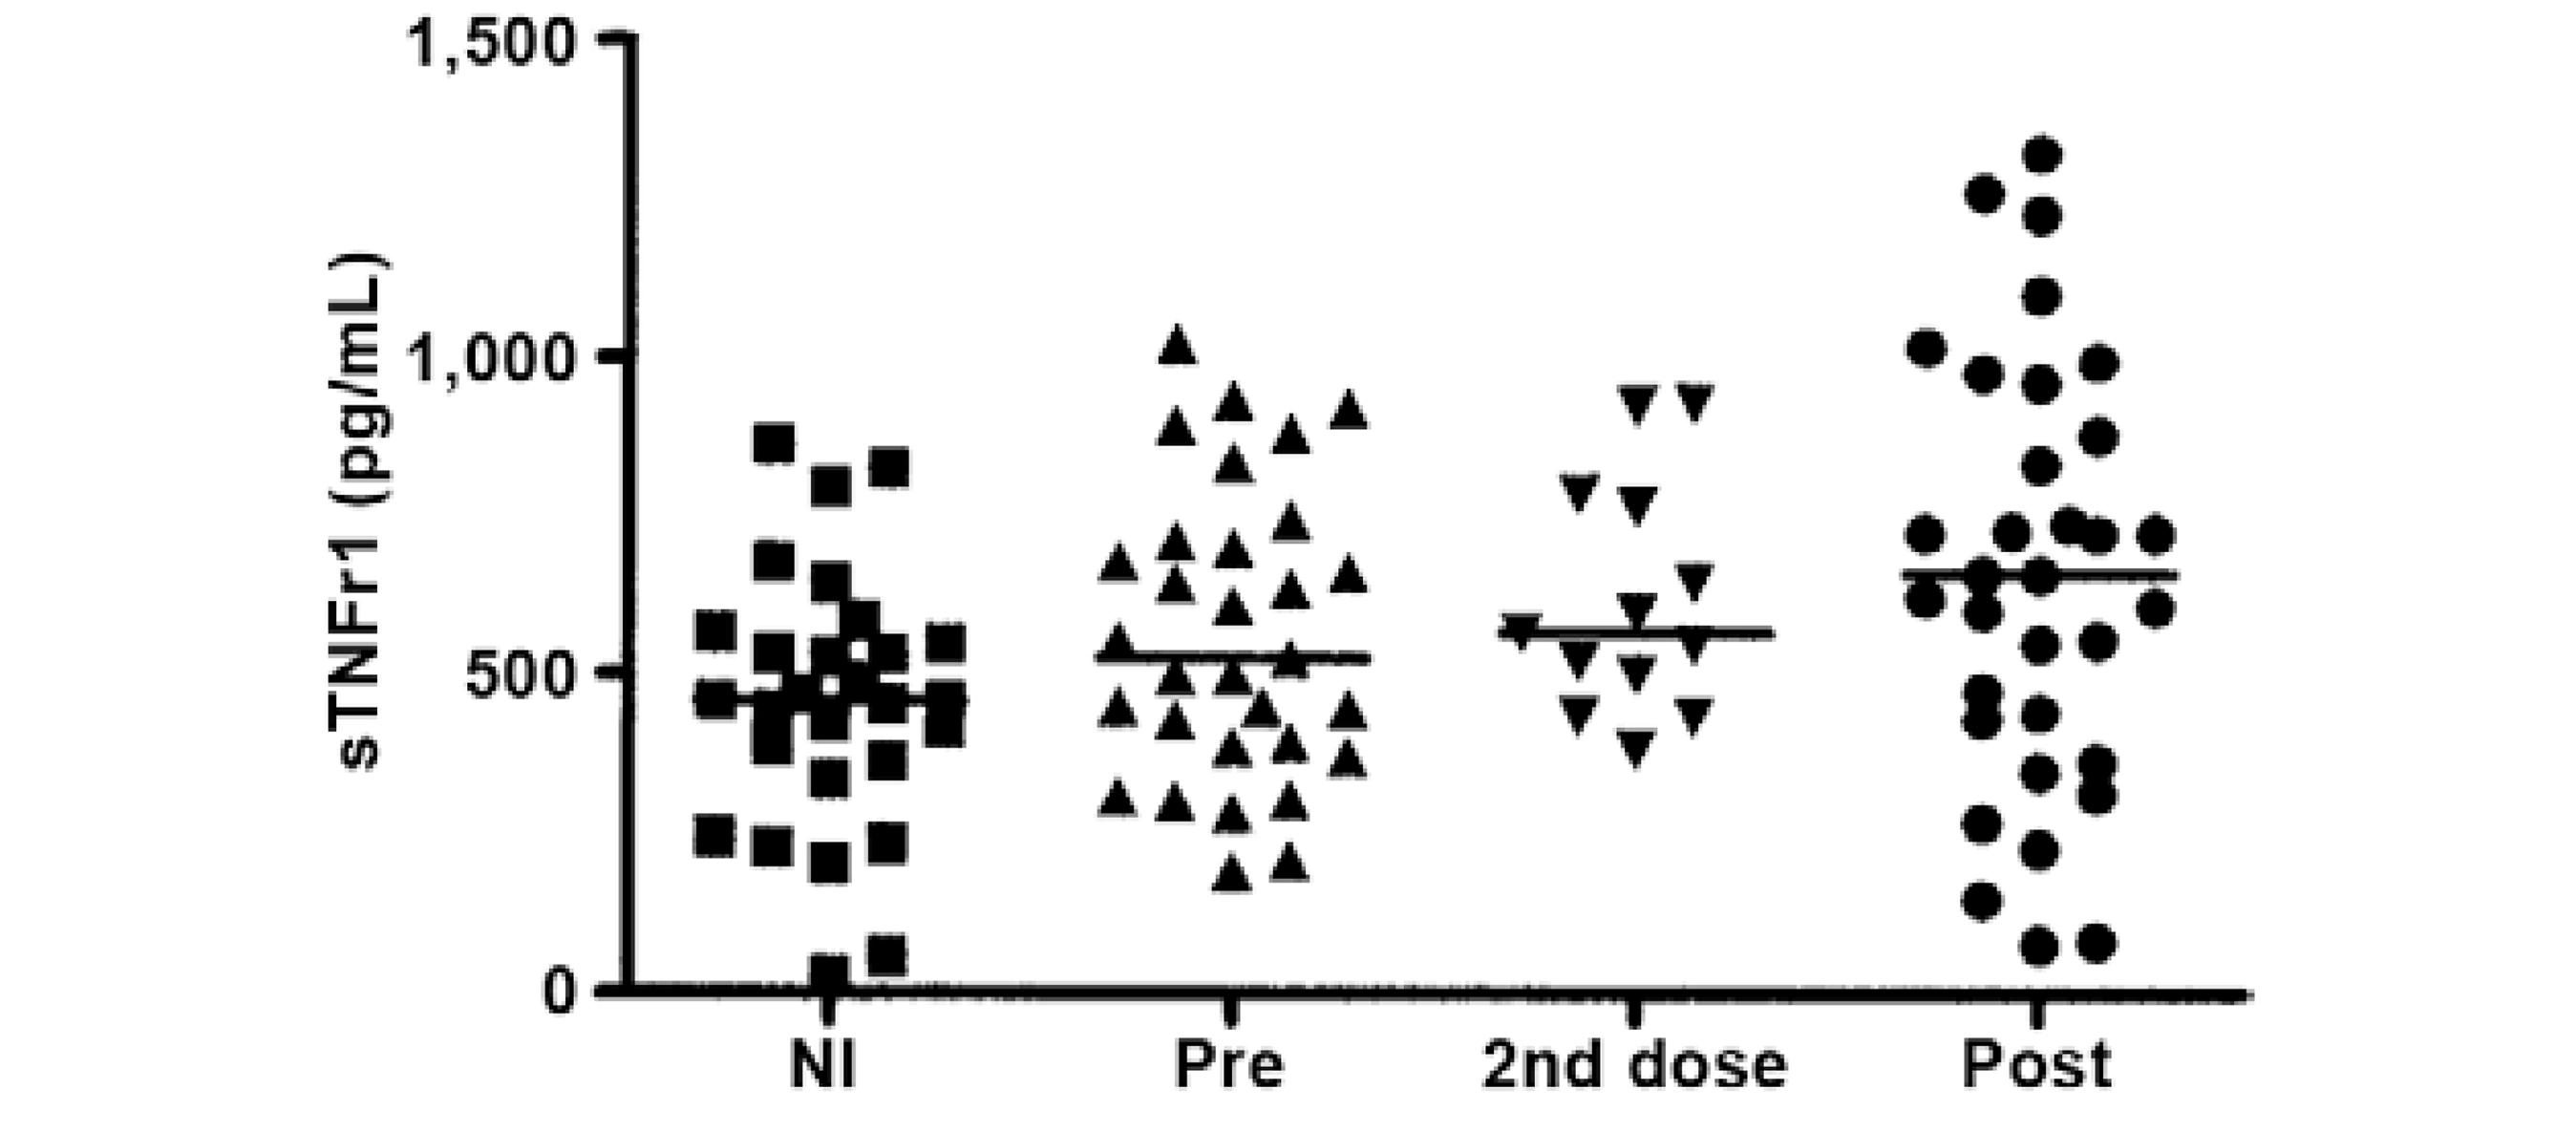
serum levels of soluble tumour necrosis factor 1 (sTNFR1) from leprosy patients in different time points along multidrug therapy (MDT). Traces represent median values. NI: non-infected subjects; Post: Mycobacterium leprae infected subjects after treatment; Pre: M. leprae infected subjects before treatment; second dose: M. leprae infected subjects after second dose of MDT.
serum levels of soluble tumour necrosis factor 2 (sTNFR2) from leprosy patients in different time points along multidrug therapy (MDT). Traces represent median values. NI: non-infected subjects; Post: Mycobacterium leprae infected subjects after treatment; Pre: M. leprae infected subjects before treatment; second dose: M. leprae infected subjects after second dose of MDT; *: p ≤ 0.05 between NI and Pre, second dose and Post; #: p ≤ 0.05 between pre and second dose.
To assess the potential of these molecules as biomarkers of leprosy diagnosis, we performed ROC curve analyses for both TNF-α and sTNF-R2. The ROC curve indicated that TNF-α had a moderate power for the prediction of a positive leprosy diagnosis. A cut-off point of 2.5 pg/mL had 89.2% sensitivity and 70% specificity for the probability of a positive diagnosis. Similarly, the ROC curve for sTNF-R2 showed a moderate correlation with the diagnosis of a positive leprosy case. A cut-off point of 2,096 pg/mL had 78.4% sensitivity and 57% specificity for the probability of a positive diagnosis.
DISCUSSION
During M. leprae infection, the levels of TNF-α must be controlled to maintain the balance between a pro-inflammatory protective status and an immune-mediated processes capable of inducing skin and neural damage. Indeed the production of TNF-α in response to M. leprae infection appears to contribute to the development of skin and nerve damage ( Scollard et al. 2006bScollard DM, Joyce MP, Gillis TP 2006b. Development of leprosy and type 1 leprosy reactions after treatment with infliximab: a report of 2 cases. Clin Infect Dis 43 : e19-22. , Hernandez et al. 2011Hernandez MO, Fulco TO, Pinheiro RO, Pereira RM, Redner P, Sarno EN, Lopes UG, Sampaio EP 2011. Thalidomide modulates Mycobacterium leprae -induced NF-kappaB pathway and lower cytokine response. Eur J Pharmacol 670 : 272-279. ). In this scenario, we hypothesised that the level(s) of TNF-α and/or its receptors (sTNF-R1 and sTNF-R2) could be regarded as molecular markers of the disease. We showed here that the levels of TNF-α and sTNF-R2 were upregulated in leprosy and that the levels of TNF-α diminished with treatment. Moreover, these two molecules could be used as biomarkers of leprosy diagnosis.
TNF-α plays a central role in initiating and regulating the cytokine cascade during an inflammatory response. This cytokine is produced as a membrane-bound precursor molecule of 26 kDa that is cleaved by the TNF-α-converting enzyme to produce a 17-kDa active cytokine ( Rubio-Perez & Morillas-Ruiz 2012Rubio-Perez JM, Morillas-Ruiz JM 2012. A review: inflammatory process in Alzheimer’s disease, role of cytokines. ScientificWorldJournal 2012 : 756357. ). In mycobacterial infections, TNF-α is crucial for pathogen control and for modulating the immune response. For instance, the suppression of TNF-α is associated with the reactivation of latent tuberculosis ( Keane et al. 2001Keane J, Gershon S, Wise RP, Mirabile-Levens E, Kasznica J, Schwieterman WD, Siegel JN, Braun MM 2001. Tuberculosis associated with infliximab, a tumor necrosis factor alpha-neutralizing agent. N Engl J Med 345 : 1098-1104. ). In leprosy, the pro-inflammatory cytokine TNF-α has been detected in skin lesions across the clinical spectrum of the disease and appears to play an important role in granuloma formation, being crucial to the development of anti-mycobacterial immunity ( Kindler et al. 1989Kindler V, Sappino AP, Grau GE, Piguet PF, Vassalli P 1989. The inducing role of tumor necrosis factor in the development of bactericidal granulomas during BCG infection. Cell 56 : 731-740. , Hirsch et al. 1994Hirsch CS, Yoneda T, Averill L, Ellner JJ, Toossi Z 1994. Enhancement of intracellular growth of Mycobacterium tuberculosis in human monocytes by transforming growth factor-beta 1. J Infect Dis 170 : 1229-1237. , Saunders & Cooper 2000Saunders BM, Cooper AM 2000. Restraining mycobacteria: role of granulomas in mycobacterial infections. Immunol Cell Biol 78 : 334-341. ). TNF-α has also been detected in biopsies taken from leprosy patients with reactional skin lesions, including both leprosy type 1 reactions and erythema nodosum (ENL) ( Saunders & Cooper 2000Saunders BM, Cooper AM 2000. Restraining mycobacteria: role of granulomas in mycobacterial infections. Immunol Cell Biol 78 : 334-341. , Lockwood et al. 2011Lockwood DN, Suneetha L, Sagili KD, Chaduvula MV, Mohammed I, van Brakel W, Smith WC, Nicholls P, Suneetha S 2011. Cytokine and protein markers of leprosy reactions in skin and nerves: baseline results for the North Indian INFIR cohort. PLoS Negl Trop Dis 5 : e1327. ). In this sense, it has been suggested that TNF-α also plays a key role in tissue damage in leprosy.
Here, we showed a statistically significant difference in the serum levels of TNF-α between leprosy patients and NI controls. This finding is consistent with previous studies involving non-treated leprosy patients ( Moubasher et al. 1998aSarno EN, Grau GE, Vieira LM, Nery JA 1991. Serum levels of tumour necrosis factor-alpha and interleukin-1 beta during leprosy reactional states. Clin Exp Immunol 84 : 103-108. ). However, according to Sarno et al. (1991)Sarno EN, Grau GE, Vieira LM, Nery JA 1991. Serum levels of tumour necrosis factor-alpha and interleukin-1 beta during leprosy reactional states. Clin Exp Immunol 84 : 103-108. , the results of studies examining TNF-α levels in the serum of leprosy patients have often been controversial. For instance, using ELISA, Pisa et al. (1990)Pisa P, Gennene M, Soder O, Ottenhoff T, Hansson M, Kiessling R 1990. Serum tumor necrosis factor levels and disease dissemination in leprosy and leishmaniasis. J Infect Dis 161 : 988-991. identified higher TNF-α levels in the serum of multibacillary patients than in paucibacillary patients. Conversely, Silva and Foss (1989)Silva CL, Foss NT 1989. Tumor necrosis factor in leprosy patients. J Infect Dis 159 : 787-790. conducted a cytotoxicity bioassay and found that 75% of tuberculoid patients (TT) showed increased TNF-α levels, which ranged from 280-340 U/mL, whereas the levels in all the examined LL patients were considered to be within the normal limits (< 60 U/mL). These authors also demonstrated higher TNF-α levels in the serum and supernatants of peripheral blood mononuclear cell cultures from TT when compared with LL subjects. In the present study, we also demonstrated that circulating TNF-α levels decreased throughout MDT, indicating that the decline of this inflammatory cytokine occurs in parallel with effective anti-leprosy treatment.
Several studies have investigated blood-based biomarkers, including TNF-α, for the diagnosis of leprosy infection and to monitor treatment efficacy and reactions. For instance, TNF-α concentrations have been shown to decrease with corticosteroid treatment and parallel clinical improvement in leprosy patients with ENL ( Iyer et al. 2007Iyer A, Hatta M, Usman R, Luiten S, Oskam L, Faber W, Geluk A, Das P 2007. Serum levels of interferon-γ, tumour necrosis factor-α, soluble interleukin-6R and soluble cell activation markers for monitoring response to treatment of leprosy reactions. Clin Exp Immunol 150 : 210-216. ). Another study found that the TNF-α serum levels were increased in leprosy patients with a reversal reaction even after the completion of prednisone treatment, suggesting persistent immune activity ( Faber et al. 2004Faber WR, Iyer AM, Fajardo TT, Dekker T, Villahermosa LG, Abalos RM, Das PK 2004. Serial measurement of serum cytokines, cytokine receptors and neopterin in leprosy patients with reversal reactions. Lepr Rev 75 : 274-281. ). In this scenario of mixed results, it has been difficult to define specific biomarkers for leprosy. Furthermore, we suggest that the applicability of the serial measurement of cytokines such as TNF-α as a leprosy biomarker is limited, as these markers do not appear to be specific to the disease.
Our study also found increased serum levels of sTNFR-2 in pre-treatment leprosy patients in comparison with NI controls. This result was expected because patients demonstrated higher levels of TNF-α and soluble TNF receptors act to control the bioavailability of this cytokine ( Aderka 1996Aderka D 1996. The potential biological and clinical significance of the soluble tumor necrosis factor receptors. Cytokine Growth Factor Rev 7 : 231-240. ). Moreover, this finding corroborates the results described in cases of pulmonary tuberculosis, which similar to leprosy, is a mycobacterial disease associated with granuloma formation. It has been reported that the levels of sTNF-R1 and sTNF-R2 are elevated at diagnosis and reach control levels after four-six months of anti-tuberculosis treatment ( Munk et al. 1999Munk ME, Anding P, Schettini AP, Cunha MG, Kaufmann SH 1999. Soluble tumor necrosis factor alpha receptors in sera from leprosy patients. Infect Immun 67 : 423-425. , Alessandri et al. 2006Alessandri AL, Souza AL, Oliveira SC, Macedo GC, Teixeira MM, Teixeira AL 2006. Concentrations of CXCL8, CXCL9 and sTNFR1 in plasma of patients with pulmonary tuberculosis undergoing treatment. Inflamm Res 55 : 528-533. ).
Interestingly, sTNF-R2 levels increased after the second dose of MDT and remained elevated even after the completion of treatment. These receptors can act as TNF-α antagonists; TNF-α carriers, stabilisers of TNF-α activity, prolonging its half-life and TNF-α “buffers”, inhibiting the effects of elevated TNF-α concentrations ( Aderka 1996Aderka D 1996. The potential biological and clinical significance of the soluble tumor necrosis factor receptors. Cytokine Growth Factor Rev 7 : 231-240. ). Our results suggest that throughout treatment, a progressive decrease occurs in the inflammatory status of leprosy patients, which is in agreement with previous studies reporting decreases in pro-inflammatory cytokines and chemokines such as IL-1β ( Moubasher et al. 1998bMoubasher AD, Kamel NA, Zedan H, Raheem DD 1998b. Cytokines in leprosy. II. Effect of treatment on serum cytokines in leprosy. Int J Dermatol 37 : 741-746. ), IFN-γ, TNF-α ( Madan et al. 2011Madan NK, Agarwal K, Chander R 2011. Serum cytokine profile in leprosy and its correlation with clinico-histopathological profile. Lepr Rev 82 : 371-382. ) CXCL10/IP10 and CXCL11/eotaxin ( Rawat et al. 2013Rawat KD, Chahar M, Reddy PV, Gupta P, Shrivastava N, Gupta UD, Natrajan M, Katoch VM, Katoch K, Chauhan DS 2013. Expression of CXCL10 (IP-10) and CXCL11 (I-TAC) chemokines during Mycobacterium tuberculosis infection and immunoprophylaxis with Mycobacterium indicus pranii (Mw) in guinea pig. Infect Genet Evol 13 : 11-17. ) in leprosy and other mycobacterial infections following treatment.
The general limitations of this study include the loss of patients during follow-up, which prevented sample collection at all stages of MDT, the absence of the Ridley-Jopling classification, the lack of control of patient-related factors, such as genetic factors and nutritional status, the classification of patients based solely on clinical parameters and, finally, the small number of molecules analysed, limiting our ability to establish a proper association between leprosy treatment and inflammatory status.
In conclusion, this study is the first to demonstrate modulation of the levels of TNF-α and its soluble receptors, primarily sTNFR2, during MDT in leprosy. In this context, sTNF-R2 could be acting as a “buffer” or an antagonist of TNF-α. More importantly, we also showed that molecules in this inflammatory pathway, e.g., TNF-α and sTNFR-2, are markers for leprosy diagnosis and treatment. Nevertheless, TNF-α and sTNFR-2 are involved in several inflammatory conditions, compromising their specificity. However, they should be regarded as candidate molecules for composing a blood-based biomarker panel for leprosy, a tenet that must be confirmed in future studies.
REFERENCES
- Aderka D 1996. The potential biological and clinical significance of the soluble tumor necrosis factor receptors. Cytokine Growth Factor Rev 7 : 231-240.
- Aderka D, Engelmann H, Maor Y, Brakebusch C, Wallach D 1992. Stabilization of the bioactivity of tumor necrosis factor by its soluble receptors. J Exp Med 175 : 323-329.
- Alessandri AL, Souza AL, Oliveira SC, Macedo GC, Teixeira MM, Teixeira AL 2006. Concentrations of CXCL8, CXCL9 and sTNFR1 in plasma of patients with pulmonary tuberculosis undergoing treatment. Inflamm Res 55 : 528-533.
- Barbosa IG, Huguet RB, Mendonça VA, Sousa LP, Neves FS, Bauer ME, Teixeira AL 2011. Increased plasma levels of soluble TNF receptor I in patients with bipolar disorder. Eur Arch Psychiatry Clin Neurosci 261 : 139-143.
- Corvino CL, Mamoni RL, Fagundes GZ, Blotta MH 2007. Serum interleukin-18 and soluble tumour necrosis factor receptor 2 are associated with disease severity in patients with paracoccidioidomycosis. Clin Exp Immunol 147 : 483-490.
- Faber WR, Iyer AM, Fajardo TT, Dekker T, Villahermosa LG, Abalos RM, Das PK 2004. Serial measurement of serum cytokines, cytokine receptors and neopterin in leprosy patients with reversal reactions. Lepr Rev 75 : 274-281.
- Hastings R, Opromolla D 1994. Leprosy. In J CK, Pathology of leprosy , 2nd ed., Churchill Livingstone, Edinburgh, p. 266-268.
- Hernandez MO, Fulco TO, Pinheiro RO, Pereira RM, Redner P, Sarno EN, Lopes UG, Sampaio EP 2011. Thalidomide modulates Mycobacterium leprae -induced NF-kappaB pathway and lower cytokine response. Eur J Pharmacol 670 : 272-279.
- Hirsch CS, Yoneda T, Averill L, Ellner JJ, Toossi Z 1994. Enhancement of intracellular growth of Mycobacterium tuberculosis in human monocytes by transforming growth factor-beta 1. J Infect Dis 170 : 1229-1237.
- Iyer A, Hatta M, Usman R, Luiten S, Oskam L, Faber W, Geluk A, Das P 2007. Serum levels of interferon-γ, tumour necrosis factor-α, soluble interleukin-6R and soluble cell activation markers for monitoring response to treatment of leprosy reactions. Clin Exp Immunol 150 : 210-216.
- Keane J, Gershon S, Wise RP, Mirabile-Levens E, Kasznica J, Schwieterman WD, Siegel JN, Braun MM 2001. Tuberculosis associated with infliximab, a tumor necrosis factor alpha-neutralizing agent. N Engl J Med 345 : 1098-1104.
- Kern WV, Engel A, Schieffer S, Prummer O, Kern P 1993. Circulating tumor necrosis factor alpha (TNF), soluble TNF receptors and interleukin-6 in human subacute bacterial endocarditis. Infect Immun 61 : 5413-5416.
- Keuter M, Dharmana E, Gasem MH, van der Ven-Jongekrijg J, Djokomoeljanto R, Dolmans WM, Demacker P, Sauerwein R, Gallati H, van der Meer JW 1994. Patterns of proinflammatory cytokines and inhibitors during typhoid fever. J Infect Dis 169 : 1306-1311.
- Kindler V, Sappino AP, Grau GE, Piguet PF, Vassalli P 1989. The inducing role of tumor necrosis factor in the development of bactericidal granulomas during BCG infection. Cell 56 : 731-740.
- Lockwood DN, Suneetha L, Sagili KD, Chaduvula MV, Mohammed I, van Brakel W, Smith WC, Nicholls P, Suneetha S 2011. Cytokine and protein markers of leprosy reactions in skin and nerves: baseline results for the North Indian INFIR cohort. PLoS Negl Trop Dis 5 : e1327.
- Madan NK, Agarwal K, Chander R 2011. Serum cytokine profile in leprosy and its correlation with clinico-histopathological profile. Lepr Rev 82 : 371-382.
- Mendonça VA, Costa RD, Brito-Melo GEA, Antunes CM, Teixeira AL 2008. Imunologia da hanseníase. An Bras Dermatol 83 : 343-350.
- Modlin RL 1994. Th1-Th2 paradigm: insights from leprosy. J Invest Dermatol 102 : 828-832.
- Modlin RL, Melancon-Kaplan J, Young SM, Pirmez C, Kino H, Convit J, Rea TH, Bloom BR 1988. Learning from lesions: patterns of tissue inflammation in leprosy. Proc Natl Acad Sci USA 85 : 1213-1217.
- Moubasher AD, Kamel NA, Zedan H, Raheem DD 1998a. Cytokines in leprosy. I. Serum cytokine profile in leprosy. Int J Dermatol 37 : 733-740.
- Moubasher AD, Kamel NA, Zedan H, Raheem DD 1998b. Cytokines in leprosy. II. Effect of treatment on serum cytokines in leprosy. Int J Dermatol 37 : 741-746.
- Munk ME, Anding P, Schettini AP, Cunha MG, Kaufmann SH 1999. Soluble tumor necrosis factor alpha receptors in sera from leprosy patients. Infect Immun 67 : 423-425.
- Pisa P, Gennene M, Soder O, Ottenhoff T, Hansson M, Kiessling R 1990. Serum tumor necrosis factor levels and disease dissemination in leprosy and leishmaniasis. J Infect Dis 161 : 988-991.
- Rawat KD, Chahar M, Reddy PV, Gupta P, Shrivastava N, Gupta UD, Natrajan M, Katoch VM, Katoch K, Chauhan DS 2013. Expression of CXCL10 (IP-10) and CXCL11 (I-TAC) chemokines during Mycobacterium tuberculosis infection and immunoprophylaxis with Mycobacterium indicus pranii (Mw) in guinea pig. Infect Genet Evol 13 : 11-17.
- Ridley DS, Jopling WH 1962. A classification of leprosy for research purposes. Lepr Rev 33 : 119-128.
- Rodrigues LC, Lockwood D 2011. Leprosy now: epidemiology, progress, challenges and research gaps. Lancet Infect Dis 11 : 464-470.
- Rubio-Perez JM, Morillas-Ruiz JM 2012. A review: inflammatory process in Alzheimer’s disease, role of cytokines. ScientificWorldJournal 2012 : 756357.
- Sarno EN, Grau GE, Vieira LM, Nery JA 1991. Serum levels of tumour necrosis factor-alpha and interleukin-1 beta during leprosy reactional states. Clin Exp Immunol 84 : 103-108.
- Saunders BM, Cooper AM 2000. Restraining mycobacteria: role of granulomas in mycobacterial infections. Immunol Cell Biol 78 : 334-341.
- Scollard DM, Adams LB, Gillis TP, Krahenbuhl JL, Truman RW, Williams DL 2006a. The continuing challenges of leprosy. Clin Microbiol Rev 19 : 338-381.
- Scollard DM, Joyce MP, Gillis TP 2006b. Development of leprosy and type 1 leprosy reactions after treatment with infliximab: a report of 2 cases. Clin Infect Dis 43 : e19-22.
- Silva CL, Foss NT 1989. Tumor necrosis factor in leprosy patients. J Infect Dis 159 : 787-790.
- Silva EA, Iyer A, Ura S, Lauris JR, Naafs B, Das PK, Vilani-Moreno F 2007. Utility of measuring serum levels of anti-PGL-I antibody, neopterin and C-reactive protein in monitoring leprosy patients during multi-drug treatment and reactions. Trop Med Int Health 12 : 1450-1458.
- Spellberg B, Edwards Jr JE 2001. Type 1/type 2 immunity in infectious diseases. Clin Infect Dis 32 : 76-102.
- Spencer JS, Duthie MS, Geluk A, Balagon MF, Kim HJ, Wheat WH, Chatterjee D, Jackson M, Li W, Kurihara JN, Maghanoy A, Mallari I, Saunderson P, Brennan PJ, Dockrell HM 2012. Identification of serological biomarkers of infection, disease progression and treatment efficacy for leprosy. Mem Inst Oswaldo Cruz 107 (Suppl. I): 79-89.
- van der Schouw YT, Verbeek AL, Ruijs JH 1992. ROC curves for the initial assessment of new diagnostic tests. Fam Pract 9 : 506-511.
- WHO - World Health Organization 1997. A guide to eliminating leprosy as a public health problem , 2nd ed., WHO, Geneva, 106 pp.
- WHO - World Health Organization 1998. WHO Expert Committee on Leprosy: seventh report , WHO, Geneva, 43 pp.
Publication Dates
-
Publication in this collection
6 Dec 2013
History
-
Received
2 May 2013 -
Accepted
26 Sept 2013