Abstract
We propose a method to analyse the 2009 outbreak in the region of Botucatu in the state of São Paulo (SP), Brazil, when 28 yellow fever (YF) cases were confirmed, including 11 deaths. At the time of the outbreak, the Secretary of Health of the State of São Paulo vaccinated one million people, causing the death of five individuals, an unprecedented number of YF vaccine-induced fatalities. We apply a mathematical model described previously to optimise the proportion of people who should be vaccinated to minimise the total number of deaths. The model was used to calculate the optimum proportion that should be vaccinated in the remaining, vaccine-free regions of SP, considering the risk of vaccine-induced fatalities and the risk of YF outbreaks in these regions.
yellow fever; vaccination; side-effects; mathematical models; optimisation; risk estimation
Yellow fever (YF) is an haemorrhagic fever caused by the prototype member of the genus Flavivirus (a name which translates from Latin as "yellow virus") family Flaviridae (Monath 2001Monath TP 2001. Yellow fever: an update. Lancet Infect Dis 1: 11-20. , Moreno et al. 2011Moreno ES, Barata RCB 2011. Municipalities of higher vulnerability to sylvatic yellow fever occurrence in the São Paulo state, Brazil. Rev Inst Med Trop São Paulo 53: 335-339. ). This family comprises approximately 70 viruses (Moreno et al. 2011Moreno ES, Barata RCB 2011. Municipalities of higher vulnerability to sylvatic yellow fever occurrence in the São Paulo state, Brazil. Rev Inst Med Trop São Paulo 53: 335-339.), most of which are transmitted by arthropod insects (hence the name arthropod born viruses or arboviruses). Genomic sequence analysis suggests that the YF virus evolved from other mosquito-borne viruses 3,000 years ago (Zanotto et al. 1996Zanotto PMA, Gould EA, Gao GF, Harvey PH, Holmes EC 1996. Population dynamics of flaviruses revealed by molecular phylogenies. Proc Natl Acad Sci 93: 548-553.). It is an infection endemic in the tropical forests of Africa and Central and South America (Barnett 2004Barnett ED 2004. Yellow fever: epidemiology and control. Clin Infect Dis 44: 850-856.). In these regions, YF is enzootic and it is maintained by circulating in non-human primates and is transmitted by diurnally active mosquitoes (Haemagogus spp and Sabethes spp in the Americas and Aedes spp in Africa). During occupational or recreational activities in forest areas, susceptible individuals are bitten by mosquitoes carrying the YF virus and develop the clinical disease with varying degrees of severity. These individuals may eventually return infected to their home cities, which is of particular concern in urban regions infested by Aedes aegypti (YF vector of the urban cycle of the disease), the same transmitter of dengue fever and the mosquito responsible for huge YF outbreaks in urban centres in the past.
With 738 cases and 478 deaths, the last outbreak of urban YF in Brazil happened in Rio de Janeiro in 1928-1929 and in 1942, Brazil was declared free of YF by the Pan American Health Organization (Monath 1991Monath T 1991. Yellow fever. In GT Strickland (ed.), Tropical medicine, 7th ed., WB Saunders Company, Phildelphia, p. 233-238.). In 1958, the 20 year national campaign for the eradication of Ae. aegypti was successful and the mosquito disappeared from Brazilian cities. In 1967, the mosquito re-infested the states of Pará and Maranhão, but this re-infestation was short-lived and the mosquito was again eradicated in 1973. Unfortunately, in 1976 Ae. aegypti invaded Brazil again through the port of Salvador, state of Bahia, and spread throughout the country, infesting more than 80% of the Brazilian cities since then. Urban YF has never resurged and the diseased remained enzootic, causing occasional sporadic human cases (Costa et al. 2011Costa ZGA, Elkhoury ANM, Romano APM, Flannery B 2011. Historical development and evolution of epidemiological surveillance and control of yellow fever in Brazil. Rev Pan-Amaz Saude 2: 11-26., Moreno & Barata 2011Moreno ES, Barata RCB 2011. Municipalities of higher vulnerability to sylvatic yellow fever occurrence in the São Paulo state, Brazil. Rev Inst Med Trop São Paulo 53: 335-339.).
Recently, however, YF re-emerged in the Central and Southeast Regions of Brazil, causing 51 cases and 21 deaths from 2008-2009 (Fortaleza et al. 2009Fortaleza CMCB, Rocha R, Aragão VDN, Almeida RAMB 2009. Syndromic surveillance and the reemergence of yellow fever in São Paulo state, Brazil, 2009. J Venom Anim Toxins Incl Trop Dis 15: 186-189.). As a consequence, public health authorities intensified the YF vaccination programme. In the state of São Paulo (SP), approximately eight million doses of YF vaccine were administered between 1999-2008. This amount corresponds to approximately 19% of the entire state population (cve.saude.sp.gov.br/cgi/deftohtm.exe?cvetab/pnisp/pnidos.def).
In this paper, we propose a method to analyse the 2009 outbreak in the region of Botucatu, SP, when 28 YF cases were confirmed, including 11 deaths (Mascheretti et al. 2013Mascheretti M, Tengan CH, Sato HK, Suzuki A, Souza RP, Maeda M, Brasil R, Pereira M, Tubaki RM, Wanderley DMV, Fortaleza CMCB, Ribeiro AF, Yellow Fever Group 2013. Yellow dever: reemerging in the state of São Paulo, 2009. Rev Saude Publica 47: 1-9.). At the time of the outbreak, the Secretary of Health of the State of São Paulo vaccinated one million people, causing the death of five individuals, an unprecedented number of YF vaccine-induced fatalities. We apply a mathematical model described previously to optimise the proportion of people who should be vaccinated to minimise the total number of deaths (Massad et al. 2005Massad E, Coutinho FA, Burattini MN, Lopez LF, Struchiner CJ 2005. Yellow fever vaccination: how much is enough. Vaccine 23: 3908-3914. ). The model was used to calculate the optimum proportion that should be vaccinated in the remaining, vaccine-free regions of SP, considering the risk of vaccine-induced fatalities and the risk of YF outbreak in these regions. This work should be viewed as a methodological proposal rather than a definitive public health intervention policy.
MATERIALS AND METHODS
If p is the proportion of the population that is pre-emptively vaccinated in campaigns before outbreaks, we can express the expected total number of deaths or serious adverse events, D(p), due to vaccination and potential YF outbreaks as (Bauch et al. 2003Bauch CT, Galvani AP, Earn DJ 2003. Group interest versus self-interest in smallpox vaccination policy. Proc Natl Acad Sci 100: 10564-10567., Massad et al. 2005Massad E, Coutinho FA, Burattini MN, Lopez LF, Struchiner CJ 2005. Yellow fever vaccination: how much is enough. Vaccine 23: 3908-3914.):
D(p) = Nh {pdv + r(1- p)[πyf (p)dyf + πv(p)d*v (p)]}
where N h is the size of the human population, d v is the probability of developing serious adverse events (including deaths) after being pre-emptively vaccinated, r is the risk of an outbreak, d yf is the probability of dying of YF, pyf (p) is the probability of getting the infection if not vaccinated, π v(p) is the probability of receiving the vaccine during the outbreak and d * v (p) is the probability of developing serious adverse events (including death) from the vaccine received during the outbreak. The quantity d v , the risk of vaccine-induced fatality rate, was assumed to be equal to 5.0 x 10⁻⁶ doses-1, which was the value observed in 2009 in the region of Botucatu (Mascheretti et al. 2013Mascheretti M, Tengan CH, Sato HK, Suzuki A, Souza RP, Maeda M, Brasil R, Pereira M, Tubaki RM, Wanderley DMV, Fortaleza CMCB, Ribeiro AF, Yellow Fever Group 2013. Yellow dever: reemerging in the state of São Paulo, 2009. Rev Saude Publica 47: 1-9.). The risk of outbreak (r) is described below. The quantities d yf (p), π yf (p), π v(p) and d * v (p) were calculated through a dynamic system described in The dynamical system, Supplementary data. Therefore, we are considering the possibility of vaccination before and during an eventual outbreak.
The term Nh pd v in equation is the number of serious adverse events (including deaths) of those individuals pre-emptively vaccinated in campaigns before outbreaks. The second term in equation, N h r(1- p)[(d yf (p) - d * v (p))π yf (p) + π v(p)d * v (p)] is the number of serious adverse events (including deaths) after an outbreak, due to death by YF infection and of serious adverse events (including deaths) due to vaccination during the outbreak.
We then minimise D(p) on the unit interval (0 ≤ p ≤ 1) to determine the group optimum, p gr,which is the cover- age level that would have to be imposed to minimise the total expected number of serious adverse events (including deaths).
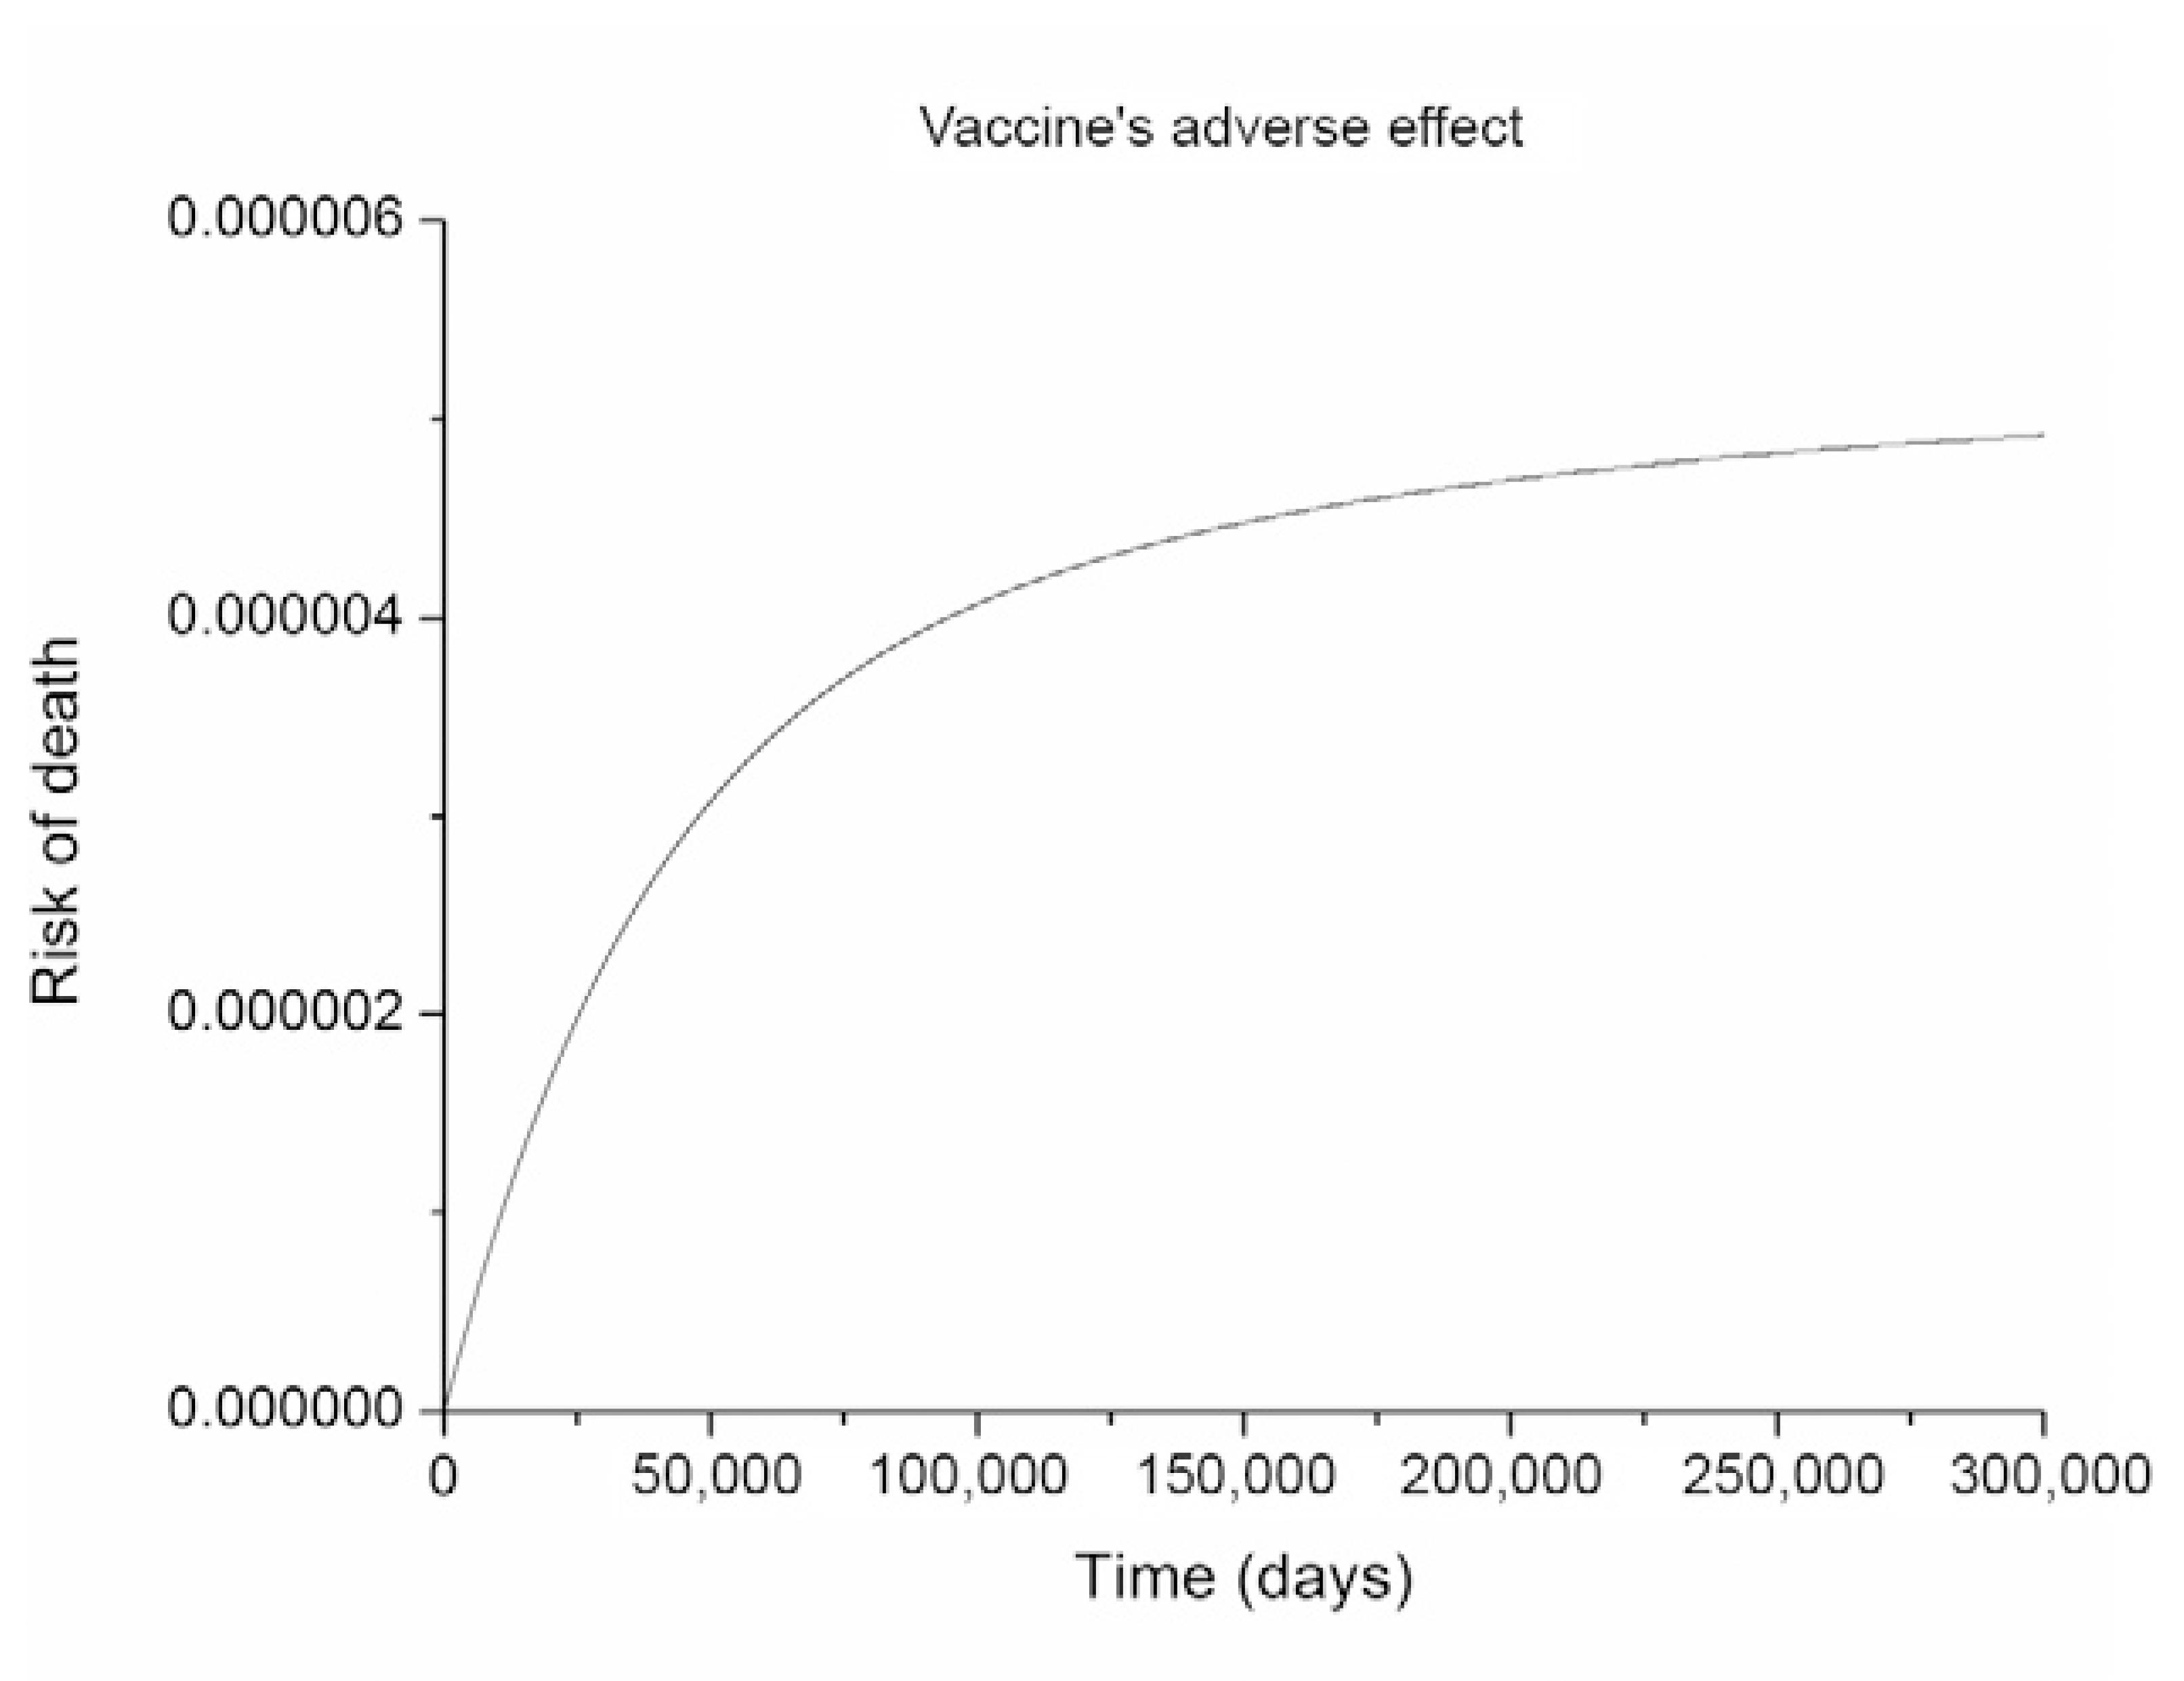
The results of the equation simulation (Table I) are presented in Figs 1-3, considering the risk of vaccine-induced fatality rate of 5.0 x 10⁻⁶ dose-1 observed in 2009 in the region of Botucatu (Mascheretti et al. 2013Mascheretti M, Tengan CH, Sato HK, Suzuki A, Souza RP, Maeda M, Brasil R, Pereira M, Tubaki RM, Wanderley DMV, Fortaleza CMCB, Ribeiro AF, Yellow Fever Group 2013. Yellow dever: reemerging in the state of São Paulo, 2009. Rev Saude Publica 47: 1-9.) for various estimated risks of outbreaks (see below).
simulation of model (The dynamical system, Supplementary data) showing that the parameters chosen reproduce, in the equilibrium, the observed risk of vaccine-induced death after the Botucatu outbreak. The time scale is not relevant because the intent is just to demonstrate that the vaccination rate applied determined a lethality at equilibrium compatible with the one observed.
simulation of model (The dynamical system, Supplementary data) showing that the parameters chosen reproduce, in the equilibrium, the observed number of YF cases and deaths during the Botucatu outbreak.
results of the simulation of D(p) / Nh from equation (main text), representing the per capita probability of death either by the disease or the vaccine. A: the three-dimensional figure showing D(p) / Nh as a function of proportion of preemptive vaccination, p, and the risk of outbreak, r; B: a profile of A, with only the risk of outbreaks, as in Supplementary Table II. The red triangles correspond to the minimum values of each curve.
We then applied the Delphi method to estimate the potential risk of outbreaks in several regions of SP (Dalkey & Helmer 1963Dalkey N, Helmer O 1963. An experimental application of the Delphi method to the use of experts. Manage Sci 9: 458-467., Massad et al. 1999Massad E, Burattini MN, Ortega NR 1999. Fuzzy logic and measles vaccination: designing a control strategy. Int J Epidemiol 28: 550-557., Ortega et al. 2003Ortega N, Barros LC, Massad E 2003. Fuzzy gradual rules in epidemiology. Kybernetes 32: 460-477.). The method was originally developed as a systematic, interactive forecasting method which relies on a panel of experts. The experts answer questionnaires in two or more rounds. After each round, a facilitator provides an anonymous summary of the experts' forecasts from the previous round as well as the reasons they provide for their judgments. Therefore, experts are encouraged to revise their earlier answers based on the replies of other members of their panel. During this process, the range of the answers will decrease and the group will converge towards the "correct" answer. Finally, the process is stopped after a pre-defined stop criterion (e.g., number of rounds, achievement of consensus and stability of results) and the mean or median scores of the final rounds determine the results.
During four meetings, the professionals of epidemiological surveillance, laboratory, vector control and the environment of the Centre of Epidemiological Surveillance, Adolpho Lutz Institute, Superintendence of Endemics Control and São Paulo Secretariat of the Environment discussed the risk of introduction of YF in new regions. We evaluated and assigned a score to define the risk in the epidemiological surveillance groups without recommendation of vaccination. The following variables were scored as 0, +1 or +2: presence of sylvatic vector, presence of Ae. aegypti, presence of non-human primates, dengue cases, river basin, climatic conditions, landscape, vegetation, fragmentation, proximity to the area of vaccine recommendation and rural population. The urbanisation density, the number of buildings per area of each region, was represented by the scores 0, -1 or -2. The eventual presence of non-explained deaths of non-human primates in any of the regions was not included in the risk analysis because, according to the current vaccination policy, if the non-human primate corpse is negative for the YF virus, then the risk is considered zero. If, in contrast, it is positive for YF, then the risk is considered 100% and the vaccination recommendation strategy is triggered. The results are shown in Table II.
Based on the Delphi scores, it was possible to estimate the relative risks of outbreaks for each region using the case of Botucatu as a reference. The risk assigned to Botucatu was equal to 40% or 0.4. This value was chosen because it is the minimum risk that resulted in 100% optimum vaccination coverage. In other words, the value of the risk assigned to Botucatu was such that no other risk value greater than that results in optimum coverage less than 100%. Therefore, it is the minimum risk that has 100% of coverage as the optimum level. According to Fig. 3B, we see that for 0% of vaccination, the total mortality in Botucatu (uppermost line) is approximately 11 (the actual observed value) and for 100% it was five (also the actual observed number of deaths due to the vaccine). All the other risks attributed to the regions were calculated as a linear proportion of the reference risk assigned to Botucatu. The results are shown in Supplementary Table I.
Fig. 4 shows the map of SP with the proposed optimal vaccination strategies for the unaffected areas. The calculated optimum proportion for vaccination against YF according to model (The dynamical system, Supplementary data) is shown in Supplementary Table II and Fig. 3A, B.
map of the state of São Paulo with the proposed optimal vaccination strategies for the unaffected areas. "Recommended" means indiscriminate vaccination of 100% of the area.
DISCUSSION
Since its reintroduction in Brazilian regions in 1976, Ae. aegyptispread throughout the country, infesting more than 80% of urban centres (Costa et al. 2011Costa ZGA, Elkhoury ANM, Romano APM, Flannery B 2011. Historical development and evolution of epidemiological surveillance and control of yellow fever in Brazil. Rev Pan-Amaz Saude 2: 11-26.).
The current circulation of YF virus in SP was associated with the high mobility of susceptible humans to enzootic YF areas. The virus eventually returned as viraemia to the Ae. aegypti infested home cities, which represents an enormous risk for urban YF re-emergence. Vaccination, therefore, is the main tool available to prevent the catastrophe represented by the re-emergence of urban YF. Even if we consider an unprecedented high rate of serious vaccine-induced adverse effects similar to the one observed in the Botucatu outbreak, vaccinating a high proportion of susceptible people in still unaffected areas should be indicated.
Presently, the surveillance policy against YF by the Brazilian Ministry of Health consists of maintaining high vaccination coverage of the so-called "recommendation" areas (dark green in Fig. 4) and triggering a mass vaccination action intended to cover entire areas where virus circulation is detected either in humans or non-human primates. This type of indiscriminate vaccination policy is far from optimum and therefore, an analysis such as the one proposed in this paper could help optimise the vaccination coverage necessary in each area.
Our results were based on the high level of vaccine-induced mortalities never observed before. If we consider the more accepted levels of vaccine-induced mortality proportions such as 2.5 deaths per one million doses as in Massad et al. (2005)Massad E, Coutinho FA, Burattini MN, Lopez LF, Struchiner CJ 2005. Yellow fever vaccination: how much is enough. Vaccine 23: 3908-3914., the optimum vaccination doses required for minimising the total probability of death would be even higher than the levels we are proposing for the still unaffected areas. It is important to emphasise, however, that the aim of this paper was to propose a methodology to estimate the optimum vaccination strategies that would minimise the death both by the disease and by the vaccine.
In addition to the vaccine-induced mortality frequency, another critical parameter considered by our model is the expected risk of outbreak. We applied a relatively simple method for estimating those risks, but a more sophisticated analysis of the outbreak risk for each unaffected area would refine our results. Moreover, our model assumes various oversimplifications of the dynamics of YF such as the absence of an age component in transmission and several other sources of heterogeneities. The quality of the data used, collection system and its accuracy of association between vaccination and related deaths are weaknesses of our estimations. Our work, therefore, should be viewed as a methodological proposal rather than a definitive public health intervention policy.
If a vaccination strategy such as the one proposed in this paper is actually implemented in the regions where the optimum vaccination proportion is less than 100%, then the fraction of the population that should be vaccinated would be calculated by fractioning the risk regionally within the area.
- Barnett ED 2004. Yellow fever: epidemiology and control. Clin Infect Dis 44: 850-856.
- Bauch CT, Galvani AP, Earn DJ 2003. Group interest versus self-interest in smallpox vaccination policy. Proc Natl Acad Sci 100: 10564-10567.
- Costa ZGA, Elkhoury ANM, Romano APM, Flannery B 2011. Historical development and evolution of epidemiological surveillance and control of yellow fever in Brazil. Rev Pan-Amaz Saude 2: 11-26.
- Dalkey N, Helmer O 1963. An experimental application of the Delphi method to the use of experts. Manage Sci 9: 458-467.
- Fortaleza CMCB, Rocha R, Aragão VDN, Almeida RAMB 2009. Syndromic surveillance and the reemergence of yellow fever in São Paulo state, Brazil, 2009. J Venom Anim Toxins Incl Trop Dis 15: 186-189.
- Mascheretti M, Tengan CH, Sato HK, Suzuki A, Souza RP, Maeda M, Brasil R, Pereira M, Tubaki RM, Wanderley DMV, Fortaleza CMCB, Ribeiro AF, Yellow Fever Group 2013. Yellow dever: reemerging in the state of São Paulo, 2009. Rev Saude Publica 47: 1-9.
- Massad E, Burattini MN, Ortega NR 1999. Fuzzy logic and measles vaccination: designing a control strategy. Int J Epidemiol 28: 550-557.
- Massad E, Coutinho FA, Burattini MN, Lopez LF, Struchiner CJ 2005. Yellow fever vaccination: how much is enough. Vaccine 23: 3908-3914.
- Monath T 1991. Yellow fever. In GT Strickland (ed.), Tropical medicine, 7th ed., WB Saunders Company, Phildelphia, p. 233-238.
- Monath TP 2001. Yellow fever: an update. Lancet Infect Dis 1: 11-20.
- Moreno ES, Barata RCB 2011. Municipalities of higher vulnerability to sylvatic yellow fever occurrence in the São Paulo state, Brazil. Rev Inst Med Trop São Paulo 53: 335-339.
- Moreno ES, Rocco IM, Bergo ES, Brasil RA, Siciliano MM, Suzuki A, Silveira VR, Bisordi I, Souza RP, Yellow Fever Working Group 2011. Reemergence of yellow fever: detection of transmission in the state of São Paulo, Brazil, 2008. Rev Soc Bras Med Trop 44: 290-296.
- Ortega N, Barros LC, Massad E 2003. Fuzzy gradual rules in epidemiology. Kybernetes 32: 460-477.
- Zanotto PMA, Gould EA, Gao GF, Harvey PH, Holmes EC 1996. Population dynamics of flaviruses revealed by molecular phylogenies. Proc Natl Acad Sci 93: 548-553.
-
Financial support: LIM01-HCFMUSP, CNPq, FAPESP
Publication Dates
-
Publication in this collection
27 Feb 2015 -
Date of issue
Apr 2015
History
-
Received
22 Sept 2014 -
Accepted
12 Jan 2015