
Abstract
This study has developed a scenery analysis model which has integrated decision-making tools on investments: prospective scenarios (Grumbach Method) and systems dynamics (hard modeling), with the innovated multivariate analysis of experts. It was designed through analysis and simulation scenarios and showed which are the most striking events in the study object as well as highlighted the actions could redirect the future of the analyzed system. Moreover, predictions are likely to be developed through the generated scenarios. The model has been validated empirically with road freight transport data from state of Rio Grande do Sul, Brazil. The results showed that the model contributes to the analysis of investment because it identifies probabilities of events that impact on decision making, and identifies priorities for action, reducing uncertainties in the future. Moreover, it allows an interdisciplinary discussion that correlates different areas of knowledge, fundamental when you wish more consistency in creating scenarios.
Keywords
Decisions on investment; Scenarios analysis; Prediction model; Road freight transportation
Resumo
Neste estudo, buscou-se desenvolver um modelo de análise de cenários que integrou ferramentas para apoio à tomada de decisão nos investimentos: Cenários prospectivos (Método Grumbach) e Dinâmica de sistemas (modelagem hard), com a inovação da introdução da análise multivariada pelos peritos. A contribuição do modelo é a maior objetividade e clareza na análise que se dá através de simulação de cenários, com identificação dos eventos e das ações redirecionadoras mais impactantes, num sistema interativo em que novas previsões são possíveis de serem desenvolvidas através dos cenários gerados. O modelo foi validado no setor de transporte rodoviário de cargas do estado do Rio Grande do Sul. Os resultados mostraram que o modelo contribui para a análise de investimentos, pois identifica probabilidades de acontecimentos que interferem na tomada de decisão, bem como identifica prioridades de ações para a redução de incertezas no futuro. Além do mais, permite uma discussão interdisciplinar que correlaciona diferentes áreas do conhecimento, fundamental quando se deseja maior consistência na construção de cenários.
Palavras-chave
Decisão sobre investimentos; Análise de cenários; Modelo de Previsão; Transporte Rodoviário de Cargas
Resumen
En este estudio se busca desarrollar un modelo de análisis en que se integran herramientas de apoyo a la toma de decisiones de inversiones: escenarios prospectivos (método Grumbach) y dinámica de sistemas (hard modelling), mediante la innovación del análisis multivariado realizado por los expertos. El modelo contribuye con una mayor objetividad y precisión en el análisis y permite identificar los eventos y acciones más efectivos, en un sistema interactivo en que nuevas predicciones pueden desarrollarse por medio de la simulación de escenarios. Se ha validado el modelo en el sector de transporte de carga por carretera del estado de Rio Grande do Sul. Los resultados demuestran que el modelo contribuye al análisis de inversión, pues identifica probabilidades de eventos que interfieren en la toma de decisiones, así como indica prioridades de acciones para reducir incertidumbres en el futuro. Además, permite un debate interdisciplinario que correlaciona diferentes áreas del conocimiento, lo que es fundamental cuando se desea una mayor coherencia en la creación de escenarios.
Palabras clave
Decisión de inversiones; análisis de escenarios; Modelo de predicción; Transporte de carga por carretera
Introduction
Prediction models are widely used in both business and public sectors. They are useful either for planning as for sensitivity analysis, as to the environmental changes for effective decision making. Thus there is a constant search to improve these models, so that errors and risks of the decision makers are minimized. This study includes some gaps since it works both in the prospection of opportunities as in the simulation, fundamental characteristics when analyzing investments influenced by a number of risks and uncertainties, which need to systematize a logical process to a wider range of analysis. These are not usual characteristics in the literature and the resulted model established a reflection on the integration of approaches on two tools: one that analyzes the variables under the static point of view (Prospective Scenarios) and another under the dynamic (System Dynamics).
Integrated models had provided superior results when tested for a given decision-making. Example is the model proposed by Mattos (2008)Mattos, R. S. d (2008). Integração de modelos econométrico e de insumo-produto para previsões de longo prazo da demanda de energia no Brasil. Estudos Econômicos, 38(4), 675-699., which integrated econometric tools for time series with input-output models and brought contribution because it has established investment opportunities according to the configuration of each elaborated scenario. Nishikawa (2014)Nishikawa, W. E. (2014). Modelo de estresse macroeconômico da inadimplência para bancos de atacado. also proposed an integrative model to determine the behavior of financial defaults composed of macroeconomic variables and their correlations with a macroeconomic event, such as an economic crisis.
Specifically for sectorial scenarios for decision support with participation of experts, the model proposed by Blois and Souza (2008)Blois, H. D., & Souza, J. C. (2008). Cenários prospectivos e a dinâmica de sistemas: Proposta de um modelo para o setor calçadista. Revista De Administração De Empresas, 48(3), 35-45. integrated prospective scenarios to the dynamic systems, providing a qualitative description of the phenomenon and quantitative developments. This study has the incorporation of experts differential, which is not so widespread in the literature, with a convenience of allowing easy understanding and participation of experts in the construction and analysis of scenarios. This feature is important because it allows an interdisciplinary discussion that correlates different areas of knowledge, which is essential when you want more consistency in building scenarios.
In the present study, a change was proposed to the model developed by Blois and Souza (2008)Blois, H. D., & Souza, J. C. (2008). Cenários prospectivos e a dinâmica de sistemas: Proposta de um modelo para o setor calçadista. Revista De Administração De Empresas, 48(3), 35-45., incorporating the step “multivariate regression analysis” before performing the integration. The inclusion of this step can be considered a breakthrough since it enables the identification of correlations between variables for subsequent integration, thereby improving its consistency. Thus, this model will have as empirical field the freight transportation sector in the Regional Development Council (COREDE) Production, state of Rio Grande do Sul, Brazil, from 2016 to 2020.
The article is structured in four sessions. The first section, is where the study was contextualized and the problem and objectives were presented, the second section provides a brief review of the literature. The third describes the methodological choices. Then, the data was analyzed and discussed, so the model reaches the final format. Finally, we present the conclusions of this study.
Literature review
The proposed model will imply integrating the tools of prospective scenarios and system dynamics. Therefore, both theoretical and literature reviews are supported by these references.
Prospective scenarios as a decision support tool
Schwartz (2000)Schwartz, P. (2000). A arte da visão de longo prazo: planejando o futuro em um mundo de incertezas. São Paulo: Best Seller. considers scenario as a tool to organize perceptions of future environments in which today's decisions will be based, which means they are “future stories” that can help in recognizing the changing aspects of the environment and assist in adaptation to them. The main objective of this process is to establish strategies that are compatible with all possible future events, since regardless of what happens in the future, you should be prepared to face it. Godet (1993)Godet, M. (1993). Manual de prospectiva estratégica: Da antecipação à acção. Lisbon: Don Quixote. Traslation from J. Freitas e Silva conceptualizes scenario as a whole formed by the coherent description of a future situation and for the referral imagined and created from events that allow to pass the source situation to the future situation. Buarque (2003)Buarque, S. C. (2003, February). Metodologia e técnicas de construção de cenários globais e regionais. Textos Para Discussão, 939. IPEA. complements explaining that although uncertainties cannot be eliminated, nor categorically defined, the future trajectories of reality studied, methods of constructing scenarios, contribute to restrict the possible evolutions of reality. Thus, it can be said that the construction of scenarios contribute, in particular to an integrated reality network of internal and external relations in the business context, in order to indicate goals and directions for the actions with a certain safety. Marcial and Grumbach (2012)Marcial, E. C., & Grumbach, R. J. S. (2012). Cenários prospectivos: como construir um futuro melhor (5th ed.). Rio de Janeiro: FGV. identify the scenarios as important decision support tool since they allow leaders to take risky decisions with transparency, identifying opportunities and threats to business, promoting the development and analysis of new options before changes in external environment, and that provide a vision that can be shared by members of the organization or a specific sector.
Currently, we underline the construction of scenarios in the face of the need for planning in both operative and decisive dimensions, aiming to have informative subsidies to better forecast events by reducing negative impacts, in a duly substantiated process of a proactive perspective. The scenario tool has been used with different approaches to predict environmental issues. Prado, Moya, and Vatopoulos (2013)Prado, N., Moya, J., & Vatopoulos, A. K. (2013). Prospective scenarios on energy efficiency and CO2 emissions in the European iron & steel industry. Petten: European Commission. analyzed the potential for improving energy efficiency and reducing CO2 emissions in the fuel sector by 2030. Ratcliffe and Krawczyk (2011)Ratcliffe, J., & Krawczyk, E. (2011). Imagineering city futures: The use of prospective through scenarios in urban planning. Futures, 43, 642-653. Retrieved from: www.elsevier.com/locate/futures
www.elsevier.com/locate/futures...
used the scenarios tool to point priority needs and application of resources in urban planning. For socioeconomic issues, Viguié, Hallegatte, and Rozenberg (2014)Viguié, V., Hallegatte, S., & Rozenberg, J. (2014). Downscaling long term socio-economic scenarios at city scale: A case study on Paris. Technological Predicting and Social Change, 87, 305-324. developed a model to simulate the evolution of the urban area of Paris between 1900 and 2100. These examples show the use of the tool for investment analysis purposes, regardless of the area where one wants to investigate.
However, Marcial and Costa (2012)Marcial, E. L., & Costa, A. J. L. (2012). O uso de cenários prospectivos na estratégia empresarial: evidência especulativa ou Inteligência Competitiva? Enanpad, Anais: Eletrônicos Enanpad, Campinas. state that there are only four methods that Fall under the prospective settings (set of investigations which are intended to predict long-term in the field of humanities). The description by Godet; the description by Schwartz – also known as GBN method; the description by Porter; and the method described by Grumbach. Such methods have some common features, such as: (I) they begin with the definition of the problem that will be scenerized (Godet and Grumbach make such a definition to define the system, as the GBN, and Porter, the strategic question); (II) they conduct historical studies and description of the current situation; and (III) they ask experts and/or specialists. In addition, all four methods are concerned with the consistency of the generated scenarios, and none of them have a speedy procedure in updating and comparing data, they present difficulties in handling a large number of variables and their trends. Regarding the differences, they focus on the mechanisms of analysis that were used, since each has its respective technique to generate different scenarios, as shown in Fig. 1.
Comparing analysis mechanisms used by different methods. Source: Adapted from Marcial and Costa (2012)Marcial, E. L., & Costa, A. J. L. (2012). O uso de cenários prospectivos na estratégia empresarial: evidência especulativa ou Inteligência Competitiva? Enanpad, Anais: Eletrônicos Enanpad, Campinas..
System dynamics as a decision support tool
Maani and Cavana (2000)Maani, K. E., & Cavana, R. Y. (2000). System thinking and modeling: Understanding change and complexity. New Zealand: Pearson Education New Zealand limited. emphasized the distinction between two approaches to system dynamics (SD), the soft and the hard. The soft approach is characterized by generating debates about reality, using multiple dimensions (different objectives) in the problem specification. It is also an approach which the objectives are insights or the learning. In the hard approach, diagrams of stock and flows are used, which are suitable for simulation. This approach uses “the principle of the bath”, which means, the accumulated flows in the stocks reflects the greater flow input than at the tap of the drain outflow. If the amount of the accumulated flow in the stocks decreases, it means the flow of the drain is higher than the tap. This principle can be applied to any future prediction system of the analyzed object by simply knowing exactly both input and output rates. The hard SD approach is also being used with different approaches. Examples are the model proposed by Souza (2010)Souza, M. N. (2010). Dinâmica de sistemas e a modelagem com o uso do programa STELLA dos recursos hídricos da bacia do Rio Preto, afluente do Rio Paracatu. Revista Ibero-Americana de Ciências Ambientais, 1(1), 16-42., built to identify the reasons for the drought in the Rio Paracatu in northeastern Brazil; by Lemenih (2014)Lemenih, M. (2014). Modelling the future of Boswellia papyrifera population and its frankincense production. Journal of Arid Environments, 105, 33-40. which identified as the events of rates impacted to the rapid decline of forest species Boswellia papyrifera in Ethiopia, the Araújo's model (Araújo, 2013Araújo, M. A. R. (2013). Modelo em dinâmica de sistemas para gestão da capacidade de aeroportos brasileiros Dissertation (Master in Production Engineering). Natal, RN: Universidade Federal do Rio Grande do Norte. Centro de Tecnologia. Programa de Pós-Graduação em Engenharia da Produção., 96 f.) which served to simulate passenger demand in thirteen Brazilian airports at peak hours; Sverdrup, Ragnarsdottir, and Koca (2014)Sverdrup, H. U., Ragnarsdottir, K. V., & Koca, D. (2014). On modelling the global copper mining rates, market supply, copper price and the end of copper reserves. Resources, Conservation and Recycling, 87, 158-174. which aimed to provide for the exhaustion of the copper mines on the planet. These examples reinforce the role of the hard SD modeling as an important decision support tool for investments.
Following, the methodological scheme that guided the integration between prospective scenarios to the systems dynamics is presented which will be tested in road freight transportation.
Methodology
This is an exploratory and inductive logic study, when knowledge is based on specialists experience and generalization derived from cases of observations of tangible reality. This is an applied research, it aims to raise causes and solutions to practical problems experienced in the field of Administration. As for its process, the research is qualitative and quantitative, developed through case study, where road freight transport experts participated in the construction and analysis of data, they were addressed through minimum meetings and semi-structured interviews during the first half of 2015, in northeastern of Rio Grande do Sul. The information was raised by facts or events that had impact on the object of study, and served in the diagnosis, construction and analysis of scenarios and future predictions.
Model analysis
First of all, the model predicts a diagnosis of endogenous and exogenous issues that impacted positively and negatively the surveyed sector. This diagnosis should be made by experts to identify which are the events that actually impact on the object of study. In this stage of the model, the tool used are the scenarios, the method was the Grumbach (Marcial & Grumbach, 2012Marcial, E. C., & Grumbach, R. J. S. (2012). Cenários prospectivos: como construir um futuro melhor (5th ed.). Rio de Janeiro: FGV.). The choice of this method occurred because of the consistency and availability of Pointwise Unconstrained Minimization Approach software (PUMAPUMA 4,0 [Computer software]. Retrieved from: http://www.brainstorming.com.br.
http://www.brainstorming.com.br...
). This method also sets up an interval in events and provides this to occur through a Delphi panel. After that, the model also provides new assessment, which is intended to indicate the degree of influence and dependence between events, through another Delphi panel. In the last step of the method Grumbach (Marcial & Grumbach, 2012Marcial, E. C., & Grumbach, R. J. S. (2012). Cenários prospectivos: como construir um futuro melhor (5th ed.). Rio de Janeiro: FGV.), the scenarios are generated and interpreted, showing the probability or not of occurrence of future events.
The integration of the prospective scenarios with Systems Dynamics (SD) is through IThinkIthink, plataforn stella [Computer software]. Retrieved from www.iseesystems.com.
www.iseesystems.com...
software, a Stella group property, for the same reasons that led to the choice of method Grumbach. At this stage, the events must be quantified to receive a statistical analysis before integration. In the improvement proposed in this study, this is the new step inserted, aiming to identify an event (or independent variable), which represents the quantitative evolution of the analyzed sector. This step also seeks correlations between the independent variable with other events (or dependent variables). If there are correlations, the influences should be allocated on a linear regression equation considered in the predictions of the system dynamic SD. The variables (or events) with no correlation should receive further treatment, which is an assessment of the experts through notes to be inserted into the SD tool.
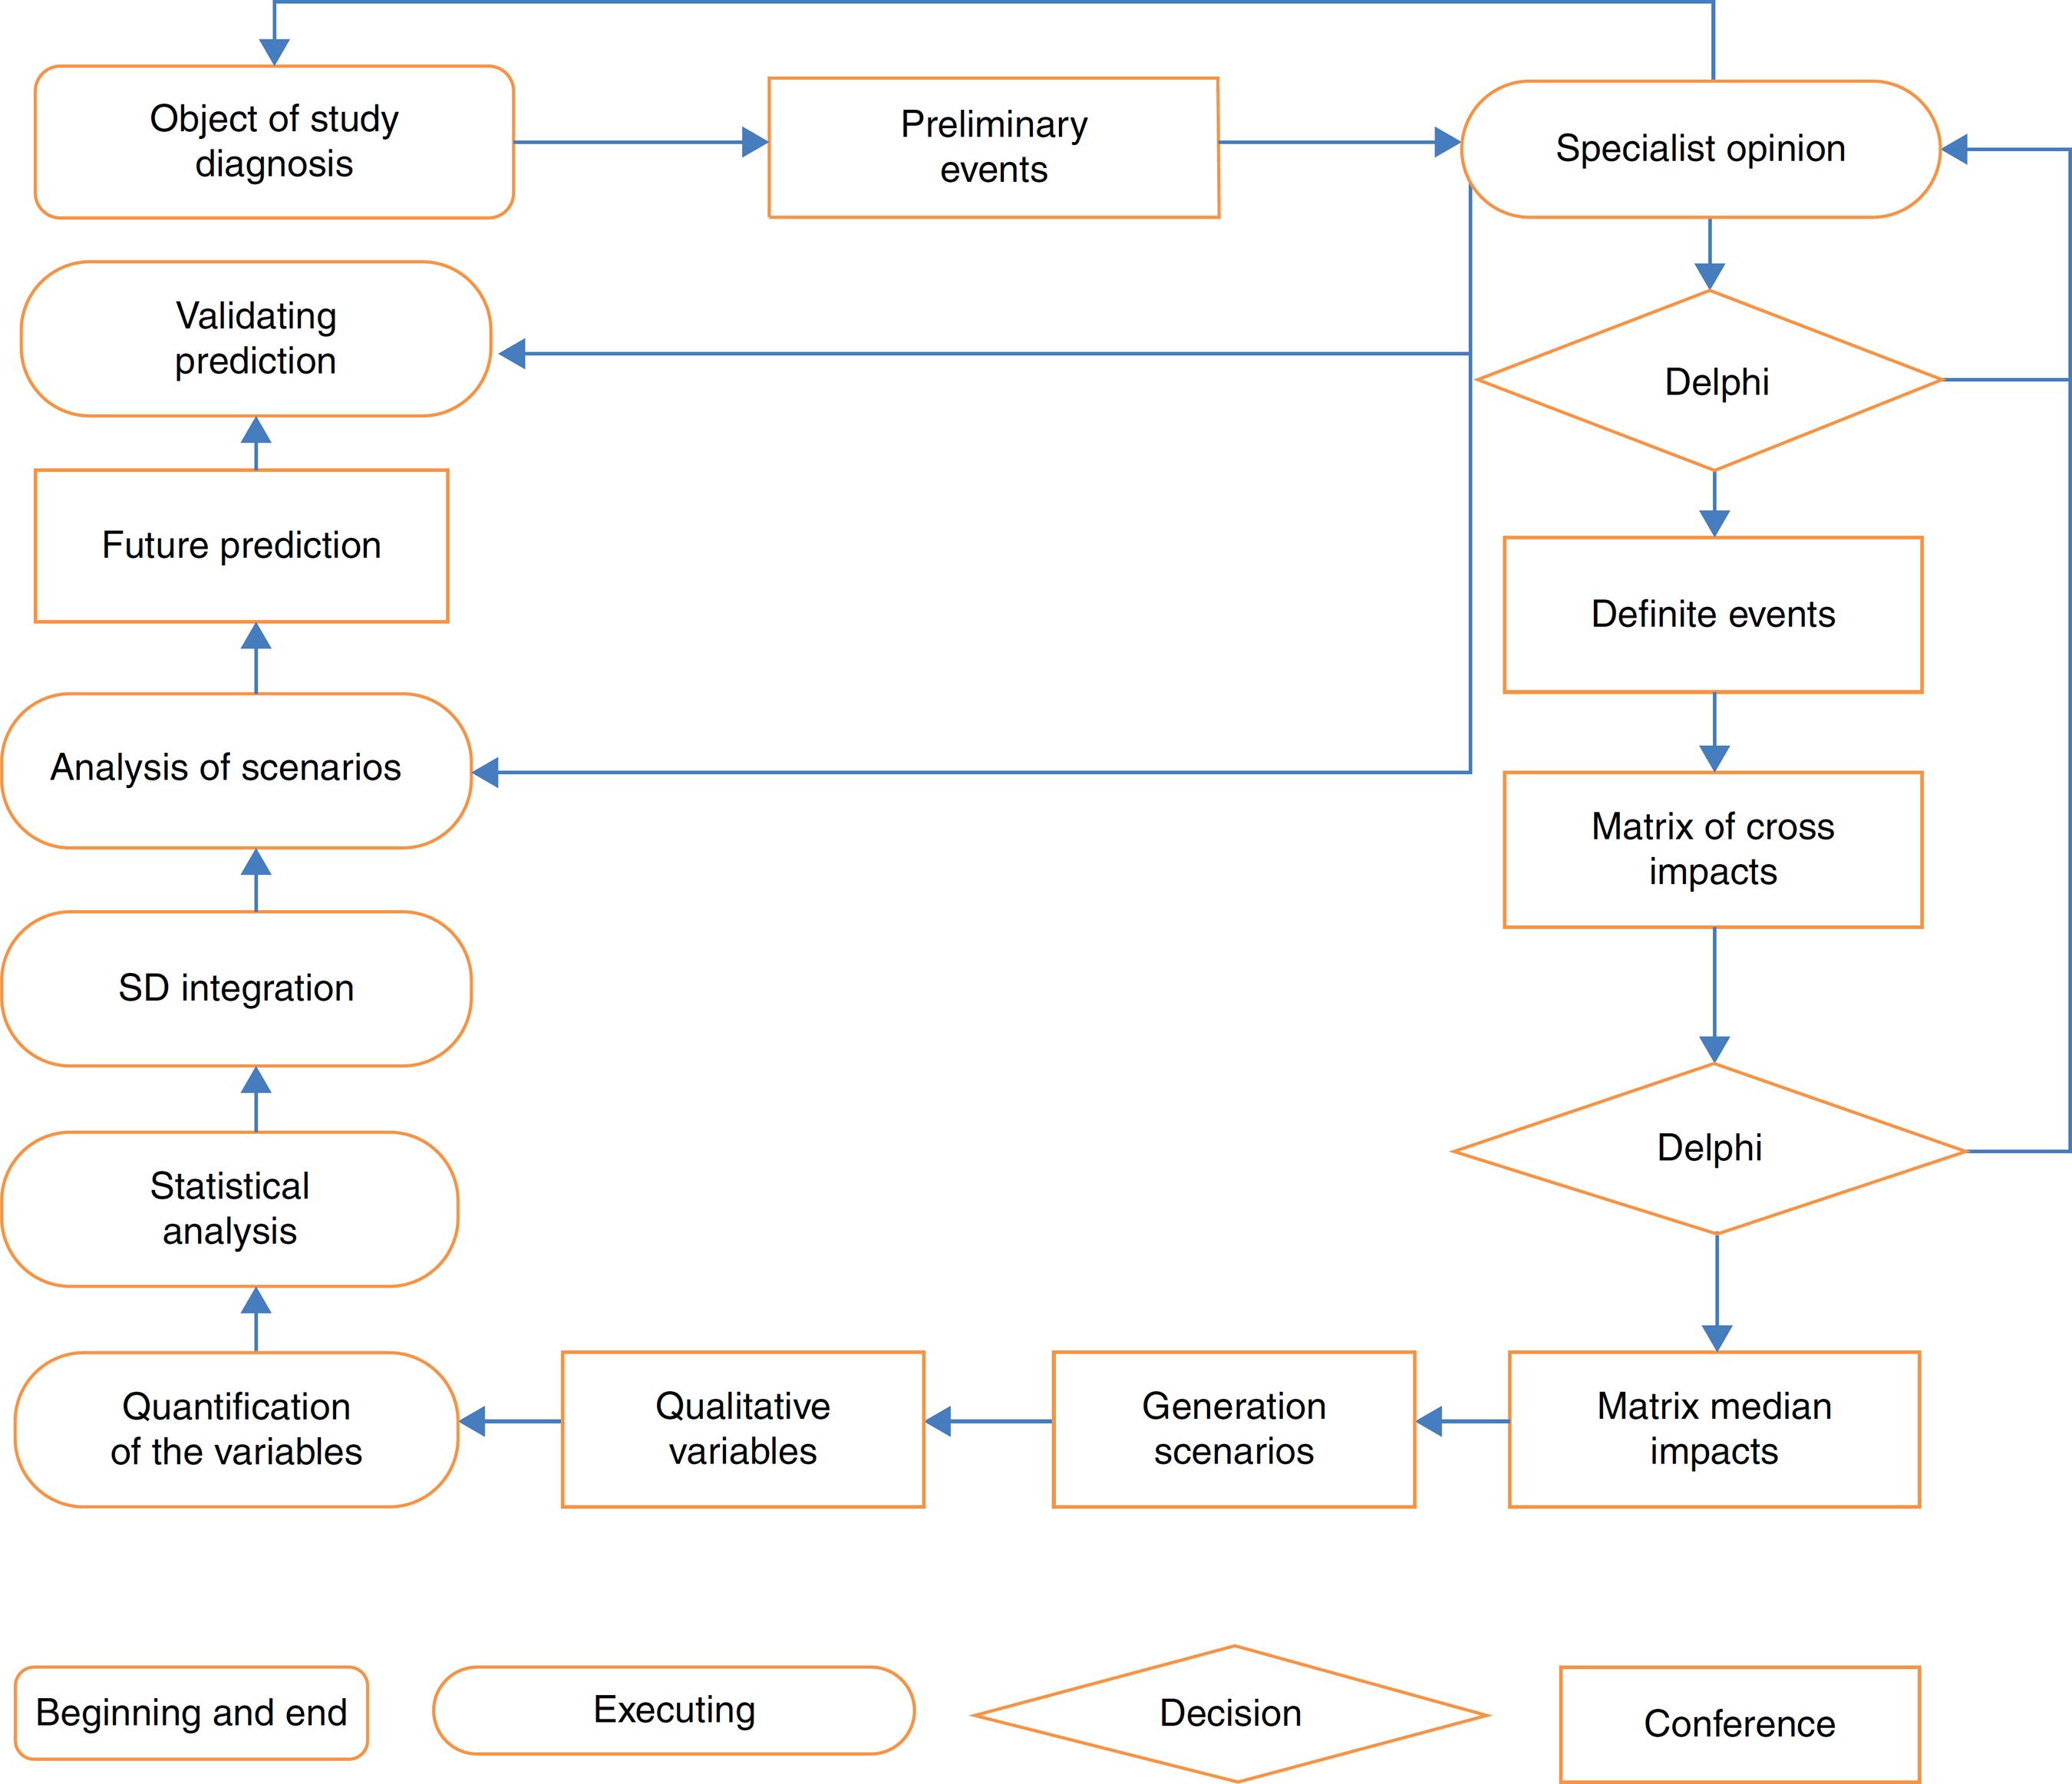
Fig. 2 shows the methodological development that guided the research.
To test this proposed model, we selected a territory located to the northeast of Rio Grande do Sul, named COREDE production region. This region has 21 cities, 6002.7 km2 of area and population of 342,442 inhabitants (FEE, 2015Fundação de Economia e Estatística. Retrieved from www.fee.rs.gov.br.
www.fee.rs.gov.br...
). The composition its Gross Domestic Product (GDP) for 2010 was represented as follows: services with 63.96%, industry with 26.86% and the remaining 9.18% to the agricultural sector (FEE, 2015Fundação de Economia e Estatística. Retrieved from www.fee.rs.gov.br.
www.fee.rs.gov.br...
). Another important feature of COREDE is the location, that is, an important road junction between some Brazilian states and the Mercosul countries. The economic representation and location of the region show the importance of planning for the road freight transportation sector through investment evaluation models.
Model validation
The application of the model started in the first half of 2015 with meetings with ten experts. As Camargo points, there is no specific formula to determine an optimal number of participants in a Delphi research model. Studies at the Rand Corporation, by Dalkey et al. demonstrated minimal request of seven components. The option of ten experts was the availability and their interest in participating in all stages of research. The expert group is constituted as follows: two representatives of the freight transportation sector; three businessmen of the sector; an union representative; a government representative; and three professors and researchers on freight transportation in COREDE production. The purpose of these meetings was to establish the diagnosis of the transportation sector in the region. Therefore, it was proposed that they describe endogenous and exogenous events that positively and negatively impacted on the industry in the last ten years.
The Grumbach method establishes that the last period to be considered in the observation of the events should be at least twice as established in the future prospection. It was established five years, since Marcial and Grumbach (2012)Marcial, E. C., & Grumbach, R. J. S. (2012). Cenários prospectivos: como construir um futuro melhor (5th ed.). Rio de Janeiro: FGV. recommend that future scenarios do not have a time frame of less than that period. And this period was established also by limitation of past information. In selecting events, the experts participated of the brainstorming technique, which were expressed 25 preliminary future events, occurring over the next five years (from January 1, 2016 to 31 December 2020), which were classified into macroeconomic, regional and sectorial events, listed below:
-
Macroeconomic Events
-
(1) Dollar Valuation
-
(2) Increasing diesel price
-
(3) World economy FALL
-
(4) Rio Grande do Sul economy FALL
-
(5) Brazilian tax reform
-
(6) Increasing interest rate
-
(7) Increasing taxes
-
-
Regional Events
-
(8) Construction of a Freight airport in COREDE Production
-
(9) Local (COREDE Production) Rail service offer increasing
-
(10) Increasing local (COREDE Production) agricultural production
-
(11) Increasing number of industries in the production COREDE
-
(12) Creation of a local (COREDE Production) logistics platform
-
-
Industry Events
-
(13) Unsafe roads in COREDE Production
-
(14) Increasing toll price
-
(15) Increasing freight rate
-
(16) Fleet modernization in COREDE Production
-
(17) Delays in freight rates payment
-
(18) Increased use of technology by hauliers
-
(19) Increasing costs of vehicle maintenance
-
(20) Increase the number of hauliers cooperatives in COREDE Production
-
(21) More local (COREDE Production) logistics operators
-
(22) Better Federal and State roads
-
(23) Easier credit access to purchase vehicles
-
(24) Increase in freight vehicles theft in Brazil
-
(25) Rising costs due to impact of Law 12619, which monitors the transport of freight
-
Obeying the evolution model, we performed a Delphi panel, in which the experts were individually interrogated by means of a questionnaire. The objective of this panel was to reduce to ten the number of events. This number is set by the large number of scenarios generated, which is equal to 1024 or 210. Therefore, it took two rounds of Delphi to reduce the score standard deviation to a limit acceptable to the Grumbach method. The choice of the final events, presented below, followed the criteria: events that presented probability ≥60% (likely to occur in the next 5 years) and relevance ≥7 (very high in relation to the object of study). From this stage, the following only ten events listed were considered in the development of the model:
-
(2) Increasing diesel price
-
(3) World economy Drop
-
(4) Rio Grande do Sul's economy Fall
-
(6) Increasing interest rate
-
(8) Construction of a Freight airport in COREDE Production
-
(9) Local (COREDE Production) Rail service offer increasing
-
(12) Creation of a local (COREDE Production) logistics platform
-
(14) Increasing toll price
-
(19) Increasing costs of vehicle maintenance
-
(20) Increase the number of hauliers cooperatives in COREDE Production
At first glance, it is clear that the ten final events, four are macroeconomic and unfavorable to the sector, one is regional and favorable, and five are sectoral, and from these, four are unfavorable to the sector. This first period shows a reduced chance of action for the transportation sector because the measures to reverse this projection depend on changes in the current macroeconomic policy. Next, the matrix of median impacts was built and therefore the matrix of cross impacts was sent to experts. In this matrix, the degree of influence and dependence of the final events are given, as shown in Fig. 3.
(25) Rising costs due to impact of Law 12619, which monitors the transport of freight
This array of median impacts is an important investment analysis tool because it allows the managers to have a perspective on the degree of influence and dependence between events. In Fig. 4, in quadrant II, the events appear: “Increasing local (COREDE Production) agricultural production”, “Increasing interest rate” Rio Grande do Sul's economy FALL”, “Increasing taxes”, and “Increasing diesel price”, that is, very influential events and less dependent. Any action on them will impact the others, but other actions will not affect them. The matrix reinforces the difficulty that the road transport sector will face in charges in the coming years if no action is taken it is aimed changing them.
In quadrant III, the events are prepared “Increased use of technology by hauliers” and “Rising costs due to impact of Law 12619, which monitors the transport of freight”. These events are rather influential and little dependent that is any action in the other events will not impact them as well as any action on them will not impact us too. Events in this quadrant should not receive greater attention, they little interfere the object of study. Efforts to change them cause low impact on the transportation sector.
In quadrant IV, appear events “Increasing costs of vehicle maintenance”, “Increase in freight vehicles theft in Brazil”, and “unsafe roads in COREDE Production“. These events are very dependent and less influential. Any action on them will not impact us too much, but any action in the other impacts on them. Two events that appear in this quadrant are sectoral and unfavorable. They are also those who suffer the greatest impact if there is no change in the other. In other words, it is expected most precarious roads and a consequent increase in the cost of maintenance of freight vehicles in the analyzed region.
Determining the degree of influence and dependence between events is important because it directs the action planning of those events that can change the future of the system. Investors should note what are the priority actions to amend the future of the object of study. Special attention should be given to quadrant II events, because the sector's performance depends on macroeconomic actions which will be taken in the coming years.
Further, the software calculated the PUMA scenarios shown in Table 1. The method Grumbach uses Bayes theorem (which shows the relation between a conditional probability and its inverse) to perform calculations. The result is a binary system (occurrence or not the events over five years). Bayes theorem is characterized by the influence of the occurrence of an event on the probability of other occur. To address the impacts as conditional probabilities, it is necessary that the impacts and likely information by experts to be subjected to this theorem, exemplified as follows.
There are two events (A) and (B) to which the following are associated probabilities:
P (A) = probability of A occurring;
P (B) = probability B occurs;
P (A/B) = probability of occurring, provided that B has occurred;
P (B/A) = probability of B occurs, since A has occurred.
The theorem can also be explained by the following:
Table 1 shows that the top ten scenarios represent 61.35% of probability of occurrence for the next five years out, what justifies the emphasis on them only. These scenarios can be interpreted in various ways in the methodology proposed by Marcial and Grumbach (2012)Marcial, E. C., & Grumbach, R. J. S. (2012). Cenários prospectivos: como construir um futuro melhor (5th ed.). Rio de Janeiro: FGV.. The most widely used is that which divides them into three categories: most likely, trend and ideal.
Table 1 is designed for the simultaneous combination of the occurrence or not of the ten final events. It is noticed that the scenario 1, all events occur simultaneously. In the scenario 2, only the event 12 (increase in agricultural production in COREDE production) does not occur simultaneously with the others. For this calculation, the PUMA software calculated the possible scenarios, the combination of events or not events, as Bayes’ theorem.
The most likely scenario: Table 1 is represented by scenario 1, with 24% probability. In this analysis the experts also participated, giving priority to necessary actions for each of the events, which were divided as follows:
* Adverse events in the study object – is characterized as the occurrence of adverse events in the study object and the non-occurrence of favorable events. In these events, the actions taken in it can change the probabilities of occurrence in the future.
Event (14) Unsafe roads in COREDE production
The actions that can be done today, in the assessment of experts, to improve the road transport of freight for the next five years would be: mobilizing both logistical, independent operators, shippers and political representatives, aiming to direct more resources for corrective maintenance on roads in this region. The event is because the government of Rio Grande do Sul state resumed in 2013 a large part of the management of highways were under concession, mainly in COREDE production region. During the concession period (15 years), there was discontent of users in relation to the amount paid in tolls.
However, from the end of the concession, the government notices not to dispose of sufficient resources to perform maintenance on these roads, which generated most disagreement. The engagement of users in this short state management period has been the only guarantee for minimum maintenance in stretches of road with heavy flow of freight vehicles.
Event (20) Increasing costs of vehicle maintenance
The first effect generated by the poor condition of roads is reflected in the increase in the cost of maintenance, or inadequate roads end up increasing the need to replace parts in vehicles that make their use. What could be done now to reduce the impact would be to create hauliers cooperatives, which would offer the parts procurement service for both self-employed, and for operators. This measure could cheapen the acquisition of parts, accessories, tires, granting a greater bargaining power.
* Adverse events outside the study-objects are characterized by the occurrence of adverse events and the non-occurrence of favorable events to the study object and cannot change the probability of occurrence of the events. In such cases, the alternative sector is to create alternatives to protect against adversity.
Event (4) Rising costs due to impact of Law 12619, which monitors the transport of freight
One of the goals of the law was to guarantee the resting period for drivers, with the impact of the reduction of those roads that met long journeys. But also implied increase in the transportation costs. In the assessment of experts, an alternative to reduce the impact on the cost would be to use management technologies, which would enable to optimize the use of the fleet in transit establishing support activities, as scheduled supply, small repairs on vehicles when it is stopped, especially for independent hauliers.
Event (2) Increasing diesel price
Diesel is an important variable cost in road transport. Because it is a macroeconomic and unfavorable event, there are few alternatives to reduce the impact of this event. Shutdowns of hauliers that occurred in 2014 were aimed at sensitizing governments and society about the situation, which impacts the entire economy.
Event (3) Increase in freight vehicles theft in Brazil
Freight of high-value and easy trading on the parallel market (cigarettes, electronics, etc.) are the most targeted. Increased security technology use is the primary means to reduce this adverse event. As the cost for the acquisition of security and communication technologies in the transport sector has been decreasing, it is expected that the self-employed hauliers, who are the majority in the region, can make them a reality in the next five years, as for larger hauliers and logistics operators of these technologies are already a reality for some time.
Event (6) Rio Grande do Sul's economy Fall
Rio Grande do Sul's economy has shown significant fluctuations in GDP. Examples are the years 2008, when there was a decrease of −0.8% of GDP, and in 2010, an increase of 6.7% (FEE, 2014). These oscillations are also a reflection of agricultural feature of the state (average share of the agricultural sector is 27% of the state GDP). As the agricultural sector depends on climatic factors, rainfall fluctuations directly impact the production and indirectly in road freight transport. As being a macroeconomic event, the transport sector has no actions that can change the course of this event in the coming years.
Event (8) Increasing interest rate
Interest rates negatively impact the economy. When increase, interest cause the reduction in the circulation of products, which directly impacts the transportation sector. And the reduction of the flow of goods in SD up discouraging independent hauliers, larger hauliers and logistics operators to purchase and/or renewal of the fleet. Because this event is also macroeconomic and unfavorable, the analyzed sector will have difficulties, if no change of the interest rate policy for the next five years happens.
Event (9) Increasing taxes
As well as increasing interest rates, the tax increase negatively affects the performance of the transport sector and the economy as a whole, because it increases prices and restricts the purchasing power of goods. The transport sector also suffers the consequences, reducing investment and cost items such as fuel. This is another event that needs changes in macroeconomic policy by the executive power.
* Events favorable to study- object are characterized by the occurrence of favorable events and the non-occurrence of adverse events to the object of study. In this case, actions should be structured in the present so that the object of study knows best how to take advantage of future events that are favorable.
Event (12) Increasing local (COREDE Production) agricultural production
Although there are high level of mechanization and intensive use of artificial irrigation in the region, agricultural production in COREDE Production accompanies climate cycles. As the recent cycle of soybean, wheat and corn production (most representative cultures of the region) had a 27% reduction in total tons collected between 2010 and 2014 (FEE, 2015Fundação de Economia e Estatística. Retrieved from www.fee.rs.gov.br.
www.fee.rs.gov.br...
), experts believe in the end of that cycle and increasing production for the coming years. In this case the hauliers may take advantage of a possible increase in demand shuttle service for the next five years.
Event (19) Increased use of technology by the hauliers
The intensive use of information technology (IT) as routing systems, management and fleet control, communication with Central Route Charges, among others, has enabled the optimization of vehicles. These ITs interfere positively on the cost of the haulier, because we optimize equipment use, ponting shorter routes, indicating the shortest flow of vehicles on the roads, allowing better services occupation capacity, which reduces the cost per kilometer. Logistical and larger transporters operators already use these technologies on a large scale. However, self-employed hauliers still have difficulty acquiring ITs, particularly those aiming management. The action could be taken today to take advantage of this favorable event, they would be self-employed hauliers, set up cooperatives to purchase these services on favorable terms to their operations.
The trend scenario
For Marcial and Grumbach (2012)Marcial, E. C., & Grumbach, R. J. S. (2012). Cenários prospectivos: como construir um futuro melhor (5th ed.). Rio de Janeiro: FGV., the trend scenario is one that takes into account the possibility of disruptions to occur, that is, the emergence of facts that impact the object of study and therefore may interfere with future events. This study has not identified by experts any rupture, a fact that made it impossible to characterize this scenario. The same authors characterize the ideal scenario as one in which the favorable events occur and the unfavorable ones do not occur. This study has not identified any ideal scenario for the next five years.
Following the integration of Prospective Scenarios for System Dynamics will be displayed. The goal is to quantify the generated scenarios. In this context, before this integration step “choice of the dependent variable” was included in the model, in which the “registration of light vehicles, medium and heavy freight in the region” was the variable identified to represent the segment's behavior over the next five years.
The integration of Prospective Scenarios and System Dynamics
The integration of Prospective Scenarios and System Dynamics were used in the first ten scenarios (the probability of occurrence = 61.35%). Experts participating in the following developments and were consulted on the impact on the registration of freight vehicles in only seven events for the following reasons:
-
Previously made it a multivariate analysis ten events between the years 2003 and 2014. This analysis was performed using averages, minimum, medium and maximum, and it was found that there were only two event records (Law Impact of 12619, which regulates road freight transport and increased cost of transport), that is, the law was promulgated on 30/04/2012, and the impact on the costs can only be observed in the years 2013 and 2014, a fact that resulted in the exclusion of the first event of multivariate analysis.
-
Subsequently, based on analysis of R2, there have been the events that presented the best fit in the model. It was observed that would be the events “Increasing local (COREDE Production) agricultural production”, “Rio Grande do Sul's economy Fall“, “Increasing costs of vehicle maintenance”, “Increasing interest rate”, and “Unsafe roads in COREDE Production”. However, fewer events were sought (or independent variables), which would not significantly reduce R2. This procedure is important to prevent the existence of interaction between variables.
-
Analyzing THE VALUE of each variable, it was found that the events “Unsafe roads in COREDE Production” and “Rio Grande do Sul's economy Fall” had a higher 5% number, it is evidenced that were not significant for the regression model because it had previously been given a maximum error of 5% significance. Thus, they were also excluded.
-
Finally, we designed a new regression model without events “Increasing local (COREDE Production) agricultural production” and “Rio Grande do Sul's economy Fall”. In this regression model only events “Increasing costs of vehicle maintenance“, “Increasing interest rate”, and “precarious Index highways” were considered, and the regression equation was characterized as follows:
where CVR = freight vehicle registration; VMC = vehicle maintenance cost; IR = interest rate; PIH = precarious index of highways.
This equation is important because it determines which events impacts (input or output) on vehicle records according to simulation made by SD. Importantly the ten events were not considered in the qualitative assessment (not to change the probabilities of scenarios), but the three regression equation events (14, 20:08) received value = 0 (or nonoccurrence) because they are only to enter in the system as drawn rates of the regression equation.
The remaining seven events were submitted to scores assigned by experts, which aim to indicate the impact they cause on freight vehicles register over the next five years. Table 2 shows the events 14, 20 and 8, with value = 0 (not occurring) in all scenarios. Table 2 also shows the result of calculating the impact of tax on vehicle registration for the next five years, which is done by multiplying the occurrence or non-occurrence of events, by the average grade of the experts.
Given the regression equation and grades of experts used the Ithink software, Sttella platform. The simulation started with a randomization (1–100). The command is performed 60 times (representing sixty months, or five years ahead) and aims to randomly choose one of the ten possible scenarios. Since the probability of the first ten scenarios is 61.35%, it was considered this percentage as 100%, and accumulated probabilities of others. This enabled each randomization to be randomly chosen one of ten possible.
Fig. 4 shows the beginning of the simulation that is made by the “randomizer” and that is interconnected with the probabilities of the scenarios (S1P, S2P … SnP). Chosen one scenario, a connection is made with the average grade of the experts (SG1, SG2 … SGn). These means may be positive or negative. Being positive it will be directed to the “qualitative increase”; if negative to the “qualitative decrease”. This is the qualitative flow simulation that is at the bottom of Fig. 4.
At the top of Fig. 4 the “quantitative flow” is shown. The events of vehicle maintenance cost (MC1, MC2 … MCn), interest rate (IR1, IR2 … IRn) and precariousness index of highways (PI1, PI2 … PIn) received values were calculated by linear regression for the next five years. All these events are interconnected with the “quantitative entry”, which is the equation that shows influence for these events, and correlates the vehicle registration, demonstrated above. The qualitative and quantitative process are flows that serve to predict the freight vehicle registration for the next five years in COREDE Production/RS.
In Table 3, the result of the projection is displayed for the next 5 years through the SD.
Table 3 projects a decline in vehicle registration charges of 16.44%. This slowdown can be explained because of the seven events evaluated by experts, five were unfavorable to the sector, resulting in notes (or rates) always negative in the randomization. As for the rates of the three quantitative events were always positive, but with less impact. The current Brazilian economy may explain the perception of experts in the allocation of grades and, consequently, the result of the simulation. The region of COREDE production is not disconnected from the current policy that inhibits various sectors of the Brazilian economy, including transportation.
To better evaluate the results, in the following Table 4 it was made a comparison between the estimates of the SD with projections calculated using freight of vehicle registration data in the region in the last 8 years. In this projection, we reached the following equation of first degree with R2 = 0.9355:
Table 4 shows the opposite behavior between the simulations made by SD, with the regression of first degree. The regression model considered only historical data of the past 8 years, the registration of freight vehicles was on an increasing phase. In the simulation made by the SD established a temporal cut (2015), most of whose event was characterized as unfavorable to the object of study. Another way to validate the predictions made by the SD would identify the last periods with historical series that projected a reduction in the registration of vehicles in the region and confront what are the reasons for this performance. Thus, it was possible to select between the years 2003 and 2007, as shown in Table 5.
Table 5 also shows a significant level of GDP that shows a similar behavior of the current macroeconomic momentum of the Brazilian economy. Based on this historical series, there was a projection for the years 2008 to 2010, both using the SD as linear regression, and compared with the actual registration of vehicles in the projection years, according to Table 6.
Comparison of predicts for the registration of freight vehicles between the years 2008 to 2012.
Table 6 shows a smaller prediction error when the projection is made by SD with absolute average difference vehicles 2351, 8296 from linear regression, However, it is noteworthy that the first effective model validation can only be confronting the “actual number of freight of vehicles registered in the year 2016” with the projection made for the same year by SD, The advantage of the SD estimate made is to be a systemic model in which, in each new period, another diagnosis can be done and new events can be entered in the prospective, which would provide a predict adjustment, Another advantage is the possibility to insert ruptures, an important factor, but not pointed by the experts, The rupture allows the change of projection, if events are pointed out that can change course to the next few years, An example might be the price of diesel, If you were assigned a price reduction for a future period, the rupture could be inserted, and the impact measured by the experts, or by linear regression if there was correlation.
Conclusions
Risks and uncertainties of the future need to be minimized for greater efficiency in the use of resources, both public and private. This is the meaning of development models and the permanent search for their improvements. This study worked this anxiety that surrounds decision makers and structured an innovative model for scenario analysis that was successful with the integration of existing tools, but used individually in supporting decision-making on investments – Prospective Scenarios (Grumbach method) and system dynamics (hard modeling). Along with the innovation of introducing the multivariate analysis by experts, which can be highlighted as an academic contribution of long-range given the different areas of knowledge that can make use of these results, the model points objectively and clearly the events and redirecting actions more impactful, an interactive system in which new predictions are likely to be developed through the generated scenarios.
In this context, the model brings significant contributions to professional planning and corporate and government strategists, since it proved effective in reducing risks and future uncertainties when it evaluated the greater impact of events in the evolution of the analyzed system with the participation of experts. The model also enables the exploration and simulation by the characteristics of the tools that integrates when investments influenced by many variables are analyzed and it was validated with road freight transport data from state of Rio Grande do Sul.
The integration proposed in this study is different from other models of integration because it proved to be practical and democratic, using tools that allowed equality of opinions, both in construction and in the analysis and predictions levels. This feature also differs from other decision-making models, as it facilitates interdisciplinary, fundamental feature when you want to deepen on the investment analysis in the future. The pointing macroeconomic, regional and sectoral events require the exchange of knowledge in different areas, what strengthens the analyses to be more consistent in those events that can actually interfere in the analyzed segment.
In this sense, the model also allows for greater weight on the opinion of leaders who could eventually compromise the evolution of the analyzed system. This action was made possible by the availability of the Delphi method, which constantly monitors and reviews the opinions of experts.
It is recognized that the model has less possibility of contribution when applied in situations where there are greater macroeconomic events of negative impact, as it limits the action of managers in decision-making, making it difficult to redirect the sector analyzed, One example is high-tech segments, aimed at the foreign market, In such cases, when there is more macroeconomic events of negative impact, the action of decision makers will be limited decisions that can little alter the future of the industry, The model also showed the need for future studies to establish greater consistency in predictions, These studies could correlate the behavior of macroeconomic, sectoral and regional variables in the past, with the industry's behavior under study.
-
Peer Review under the responsibility of Departamento de Administração, Faculdade de Economia, Administração e Contabilidade da Universidade de São Paulo – FEA/USP.
References
- Araújo, M. A. R. (2013). Modelo em dinâmica de sistemas para gestão da capacidade de aeroportos brasileiros Dissertation (Master in Production Engineering). Natal, RN: Universidade Federal do Rio Grande do Norte. Centro de Tecnologia. Programa de Pós-Graduação em Engenharia da Produção., 96 f.
- Blois, H. D., & Souza, J. C. (2008). Cenários prospectivos e a dinâmica de sistemas: Proposta de um modelo para o setor calçadista. Revista De Administração De Empresas, 48(3), 35-45.
- Buarque, S. C. (2003, February). Metodologia e técnicas de construção de cenários globais e regionais. Textos Para Discussão, 939 IPEA.
- Fundação de Economia e Estatística. Retrieved from www.fee.rs.gov.br
» www.fee.rs.gov.br - Godet, M. (1993). Manual de prospectiva estratégica: Da antecipação à acção. Lisbon: Don Quixote. Traslation from J. Freitas e Silva
- Ithink, plataforn stella [Computer software]. Retrieved from www.iseesystems.com
» www.iseesystems.com - Lemenih, M. (2014). Modelling the future of Boswellia papyrifera population and its frankincense production. Journal of Arid Environments, 105, 33-40.
- Maani, K. E., & Cavana, R. Y. (2000). System thinking and modeling: Understanding change and complexity. New Zealand: Pearson Education New Zealand limited.
- Marcial, E. L., & Costa, A. J. L. (2012). O uso de cenários prospectivos na estratégia empresarial: evidência especulativa ou Inteligência Competitiva? Enanpad, Anais: Eletrônicos Enanpad, Campinas.
- Marcial, E. C., & Grumbach, R. J. S. (2012). Cenários prospectivos: como construir um futuro melhor (5th ed.). Rio de Janeiro: FGV.
- Mattos, R. S. d (2008). Integração de modelos econométrico e de insumo-produto para previsões de longo prazo da demanda de energia no Brasil. Estudos Econômicos, 38(4), 675-699.
- Nishikawa, W. E. (2014). Modelo de estresse macroeconômico da inadimplência para bancos de atacado
- Prado, N., Moya, J., & Vatopoulos, A. K. (2013). Prospective scenarios on energy efficiency and CO2 emissions in the European iron & steel industry. Petten: European Commission.
- PUMA 4,0 [Computer software]. Retrieved from: http://www.brainstorming.com.br
» http://www.brainstorming.com.br - Ratcliffe, J., & Krawczyk, E. (2011). Imagineering city futures: The use of prospective through scenarios in urban planning. Futures, 43, 642-653. Retrieved from: www.elsevier.com/locate/futures
» www.elsevier.com/locate/futures - Schwartz, P. (2000). A arte da visão de longo prazo: planejando o futuro em um mundo de incertezas. São Paulo: Best Seller.
- Sverdrup, H. U., Ragnarsdottir, K. V., & Koca, D. (2014). On modelling the global copper mining rates, market supply, copper price and the end of copper reserves. Resources, Conservation and Recycling, 87, 158-174.
- Souza, M. N. (2010). Dinâmica de sistemas e a modelagem com o uso do programa STELLA dos recursos hídricos da bacia do Rio Preto, afluente do Rio Paracatu. Revista Ibero-Americana de Ciências Ambientais, 1(1), 16-42.
- Viguié, V., Hallegatte, S., & Rozenberg, J. (2014). Downscaling long term socio-economic scenarios at city scale: A case study on Paris. Technological Predicting and Social Change, 87, 305-324.
Publication Dates
-
Publication in this collection
Jan-Mar 2017
History
-
Received
29 July 2015 -
Accepted
13 June 2016

 Source: Software Puma.
 Source: Authors (2015).