ABSTRACT
We measured variation and covariation in wing morphology in six populations of the fly Polietina orbitalis (Stein) (Diptera: Muscidae) to test for geographic morphological structure. Additionally, we examined the role of environmental variables in determining geographic variation in wing shape. We sampled five populations in the state of Paraná, southern Brazil (Colombo, Fênix, Guarapuava, Jundiaí do Sul and Ponta Grossa), and one in Paraguay (Mbaracayú). We choose 15 landmarks to describe the wing shape and size and 19 environmental variables to describe the local environmental conditions. Our results showed that P. orbitalis wing shape, but not size, varies geographically. A canonical variate analysis showed the existence of two clusters of populations based on wing shape. These groups compare populations in which the wing is slender with groups in which the wings are broad. These shape differences were correlated with variation in elevation, precipitation and temperature but were not allometric. Taken together, these results suggest that wing shape differences in P. orbitalis populations are due to a plastic response to local environmental conditions.
Keywords:
Diptera; Geometric morphometrics; Muscidae; Phenotypic plasticity
Introduction
Phenotypic plasticity is the ability of an organism to express different phenotypes depending on the environmental conditions faced (Agrawal, 2001Agrawal, A.A., 2001. Phenotypic plasticity in the interactions and evolution of species. Science 294, 321-326.). Such plasticity is therefore the consequence of the interaction between environmental variability and the developmental program (genotypic × environmental interaction; Scheiner, 1993Scheiner, S.M., 1993. Genetics and evolution of phenotypic plasticity. Annu. Rev. Ecol. Syst. 24, 35-68.) and is thus, one solution to the problem of adaptation to heterogeneous environments (Via et al., 1995Via, S., Gomulkiewicz, R., de Jong, G., Scheiner, S.M., Schlichting, C.D., Tienderen, P.H., 1995. Adaptive phenotypic plasticity: consensus and controversy. Trends Ecol. Evol. 10, 212-217.). Plasticity arises because environmental variability induces developmental changes, which alter the expression and connection between traits (Relyea, 2004Relyea, R.A., 2004. Integrating phenotypic plasticity when death is on the line: insights from predator–prey systems. In: Pigliucci, M., Preston, K. (Eds.), The Evolutionary Biology of Complex Phenotypes. Oxford University Press, Oxford, pp. 176–194.).
As a developmental response, plastic traits allow species to cope with environmental variability (temporal or spatial), enabling a fitness optimization (such as acclimatization) to these conditions (Ghalambor et al., 2007Ghalambor, C.K., Mckay, J.K., Carroll, S.P., Reznick, D.N., 2007. Adaptive versus non-adaptive phenotypic plasticity and the potential for contemporary adaptation in new environments. Funct. Ecol. 21, 394-407.). Although phenotypic plasticity has an effect on fitness, this effect could be adaptive, maladaptive or neutral (Scheiner, 1993Scheiner, S.M., 1993. Genetics and evolution of phenotypic plasticity. Annu. Rev. Ecol. Syst. 24, 35-68.; Pigliucci, 2005Pigliucci, M., 2005. Evolution of phenotypic plasticity: where are we going now? Trends Ecol. Evol. 20, 481-486.; Ghalambor et al., 2007Ghalambor, C.K., Mckay, J.K., Carroll, S.P., Reznick, D.N., 2007. Adaptive versus non-adaptive phenotypic plasticity and the potential for contemporary adaptation in new environments. Funct. Ecol. 21, 394-407.). Because any environmentally induced plasticity places phenotypes into different selective regimes, the fitness consequence, in both the short and long run, will determine whether the response is adaptive. For example, environmental variability that is persistent, causing persistent selection pressure, may lead to local population adaptation, with fitness peaks that are different for each population (Kawecki and Ebert, 2004Kawecki, T.J., Ebert, D., 2004. Conceptual issues in local adaptation. Ecol. Lett. 7, 1225-1241.).
Although morphological traits have been one of the characters most widely used to study phenotypic plasticity, any measurable trait, such as life history features, physiology and behavior could also be used (Whitman and Ananthakrishnan, 2009Whitman, D., Ananthakrishnan, T.N., 2009. Phenotypic Plasticity of Insects: Mechanisms and Consequences. Science Publishers, Enfield.). Insect body size and shape strongly respond to changes in temperature, with responses ranging from population differences (e.g., Hoffmann and Shirriffs, 2002Hoffmann, A.A., Shirriffs, J., 2002. Geographic variation for wing shape in Drosophila serrata. Evolution 5, 1068-1073.) to thermal clines in body size (Griffiths et al., 2005Griffiths, J.A., Schiffer, M., Hoffmann, A.A., 2005. Clinal variation and laboratory adaptation in the rainforest species Drosophila birchii for stress resistance, wing size, wing shape and development time. J. Evol. Biol. 18, 213-222.; van Heerwaarden and Sgrò, 2011van Heerwaarden, B., Sgrò, C.M., 2011. The effect of developmental temperature on the genetic architecture underlying size and thermal clines in Drosophila melanogaster and D. simulans from the east coast of Australia. Evolution 65, 1048-1067.). As size and shape impact performance and fitness (van Heerwaarden and Sgrò, 2011van Heerwaarden, B., Sgrò, C.M., 2011. The effect of developmental temperature on the genetic architecture underlying size and thermal clines in Drosophila melanogaster and D. simulans from the east coast of Australia. Evolution 65, 1048-1067.), these traits are of interest for the study of phenotypic plasticity.
Environmental variables are spatially structured, and this structuring could also lead to hierarchically structured morphological variation that could be either continuous (such as a cline) or discontinuous. Therefore, the recognition of such morphological discontinuities can lead to an understanding of the shaping of not only species boundaries but also intraspecific patterns of variation and covariation (Mateus et al., 2013Mateus, R.P., Moura, M.O., Manfrin, M.H., Monteiro, F.M., Sene, S.G., 2013. Contrasting patterns of within-species morphological variation in two cactophilic Drosophila species (Diptera: Drosophilidae). Neotrop. Entomol. 42, 384-392.).
The study of morphological variation has advanced at the same pace as the development of the corresponding analytical methods, thus allowing for a more accurate treatment of a variety of hypotheses (Adams et al., 2013Adams, D.C., Rohlf, F.J., Slice, D.E., 2013. A field comes of age: geometric morphometrics in the 21st century. Hystrix 24, 7-14.). Some phenotypic alteration can be very subtle and difficult to detect, and morphometry can be a useful tool for detecting such change, mainly that involving the size and form of organisms (Strauss and Bookstein, 1982Strauss, R.E., Bookstein, F.L., 1982. The truss: body form reconstruction in morphometrics. Syst. Zool. 31, 113-135.). The main strength of geometric morphometry over traditional morphometric methods is its ability to detect even subtle morphological variation. Additionally, geometric morphometry can separate the size and shape components of form (Adams et al., 2013Adams, D.C., Rohlf, F.J., Slice, D.E., 2013. A field comes of age: geometric morphometrics in the 21st century. Hystrix 24, 7-14.) by permitting analysis in a high-dimensional morphological space, which enables a graphical interpretation of shape changes.
Diptera provide a standard model system to study environmentally induced phenotypic changes. Several species exhibit variations in fitness-related and morphological traits (wing size and shape) that correlate with local selective pressures, mainly thermal selection (Reeve et al., 2000Reeve, M.W., Fowler, K., Partridge, L., 2000. Increased body size confers greater fitness at lower experimental temperature in male Drosophila melanogaster. J. Evol. Biol. 13, 836-844.; Hoffmann and Shirriffs, 2002Hoffmann, A.A., Shirriffs, J., 2002. Geographic variation for wing shape in Drosophila serrata. Evolution 5, 1068-1073.; Soto et al., 2007Soto, I.M., Carreira, V.P., Fanara, J.J., Hasson, E., 2007. Evolution of male genitalia: environmental and genetic factors affect genital morphology in two Drosophila sibling species and their hybrids. BMC Evol. Biol. 7, 1-11.; Aytekin et al., 2007Aytekin, A.M., Alten, B., Caglar, S.C., Ozbel, Y., Kaynas, S., Simsek, F.M., Kasap, O.E., Belen, A., 2007. Phenotypic variation among local populations of phlebotomine sand flies (Diptera: Psychodidae) in southern Turkey. J. Vector Ecol. 32, 226-234.; Marsteller et al., 2009Marsteller, S., Adams, D.C., Collyer, M.L., Cordon, M., 2009. Six cryptic species on a single species of host plant: morphometric evidence for possible reproductive character displacement. Ecol. Entomol. 34, 66-73.; Devicari et al., 2011Devicari, M., Lopes, A.R., Suesdek, L., 2011. Dimorfismo sexual de Aedes scapularis (Diptera: Culicidae). Biota Neotrop. 11, 165-169.; Demirci et al., 2012Demirci, B., Lee, Y., Lanzaro, G.C., Alten, B., 2012. Altitudinal genetic and morphometric variation among populations of Culex theileri Theobalt (Diptera: Culicidae) from northeastern Turkey. J. Vector Ecol. 37, 197-209.; Kjaersgaard et al., 2013Kjaersgaard, A., Pertoldi, C., Loeschcke, V., Blanckenhorn, W.U., 2013. The effect of fluctuating temperatures during development on fitness-related traits of Scatophaga stercoraria (Diptera: Scathophagidae). Environ. Entomol. 5, 1069-1078.; Hidalgo et al., 2015Hidalgo, K., Dujardin, J.P., Mouline, K., Dabiré, R.K., Renault, D., Simard, F., 2015. Seasonal variation in wing size and shape between geographic populations of the malaria vector Anopheles coluzzii in Burkina Faso (West Africa). Acta Trop. 143, 79-88.). However, these results are biased toward groups of medical and veterinary importance as well as model species, such as those belonging to the genus Drosophila. Although we expect that the life history traits of all ectotherms respond to temperature (Angilletta et al., 2004Angilletta, M.J., Steury, T.D., Sears, M.W., 2004. Temperature, growth rate, and body size in ectotherms: fitting pieces of a life-history puzzle. Integr. Comp. Biol. 44, 108-140.), those ectothermal species that are broadly distributed are expected to face steeper climate changes along their geographic range. Polietina orbitalis (Stein, 1904) (Diptera: Muscidae) are broadly distributed in forested areas of South America, including Brazil, Argentina, Bolivia, Peru and Paraguay (Löwenberg-neto and de Carvalho, 2013Löwenberg-neto, P., de Carvalho, C.J.B., 2013. Muscidae (Insecta: Diptera) of Latin America and the Caribbean: geographic distribution and check-list by country. Zootaxa 3650, 1-147.). Thus, the geographic range of P. orbitalis encompasses several biome types, each one defined by a set of specific environmental characteristics. Additionally, their range spans tropical and subtropical/temperate climates. Therefore, this species seems a model candidate to determine the influence of environmental conditions on morphology because its populations along a latitudinal/longitudinal gradient are under different thermal regimes. Consequently, we used geometric morphometry to characterize geographic patterns in P. orbitalis morphology (wing shape), expecting them to vary according to the environmental conditions under which each population evolved. Specifically, we tested for the following patterns and associations: (a) morphological interpopulational variation, (b) an association of morphological changes with latitude or longitude and (c) the climatic variables most strongly correlated with morphological changes.
Material and methods
We restricted our analysis to female specimens of P. orbitalis from southern Brazil and nearby Paraguay. The geographical extent of sampling was defined by the availability of an adequate sample size, and only females were sampled to avoid the effects of sexual dimorphism and a male sample size that was too small. The sample comprised the following specimens: 28 from Paraguay (Mbaracayú) and Jundiaí do Sul, 24 from Colombo and 30 from Fênix, Guarapuava, and Ponta Grossa (Fig. 1).
Map showing sites where P. orbitalis populations were collected: 1. Mbaracayú (25º17' S, 54º49' W) in Paraguay and 2. Fênix (23º54' S, 51º58' W), 3. Jundiaí do Sul (23º26' S, 50º14' W), 4. Guarapuava (25º23' S, 51º27' W), 5. Ponta Grossa (25º05' S, 50º09' W) and 6. Colombo (25º17' S, 49º13' W) in Brazil.
All the specimens were previously collected using Malaise traps. The Paraguayan population was collected at the Reserva Natural del Bosque Mbaracayú, and the Brazilian populations were sampled within the project "Levantamento da Fauna Entomológica no Estado do Paraná" (PROFAUPAR), from August 1986 to July 1988 (Marinoni and Dutra, 1993Marinoni, R.C., Dutra, R.R.C., 1993. Levantamento da fauna entomológica no Estado do Paraná. I. Introdução. Situação climática e florística de oito pontos de coleta. Dados faunísticos de agosto de 1986 a julho de 1987. Rev. Bras. Zool. 8, 31-73.). All the specimens belong to the Padre Jesus Santiago Moure entomological collection housed in the Zoology Department of the Universidade Federal do Paraná (DZUP).
To test our hypotheses, we used right wings as a morphological proxy. The wings were carefully removed and placed in absolute alcohol for 20 min, xylene for 10 min and then mounted between 14 mm coverslips with Entellan®. The dorsal side of the wing was photographed using a Dino-Lite Pro® microscope at 15× magnification. Voucher specimens, together with wing mounts, were deposited in the DZUP.
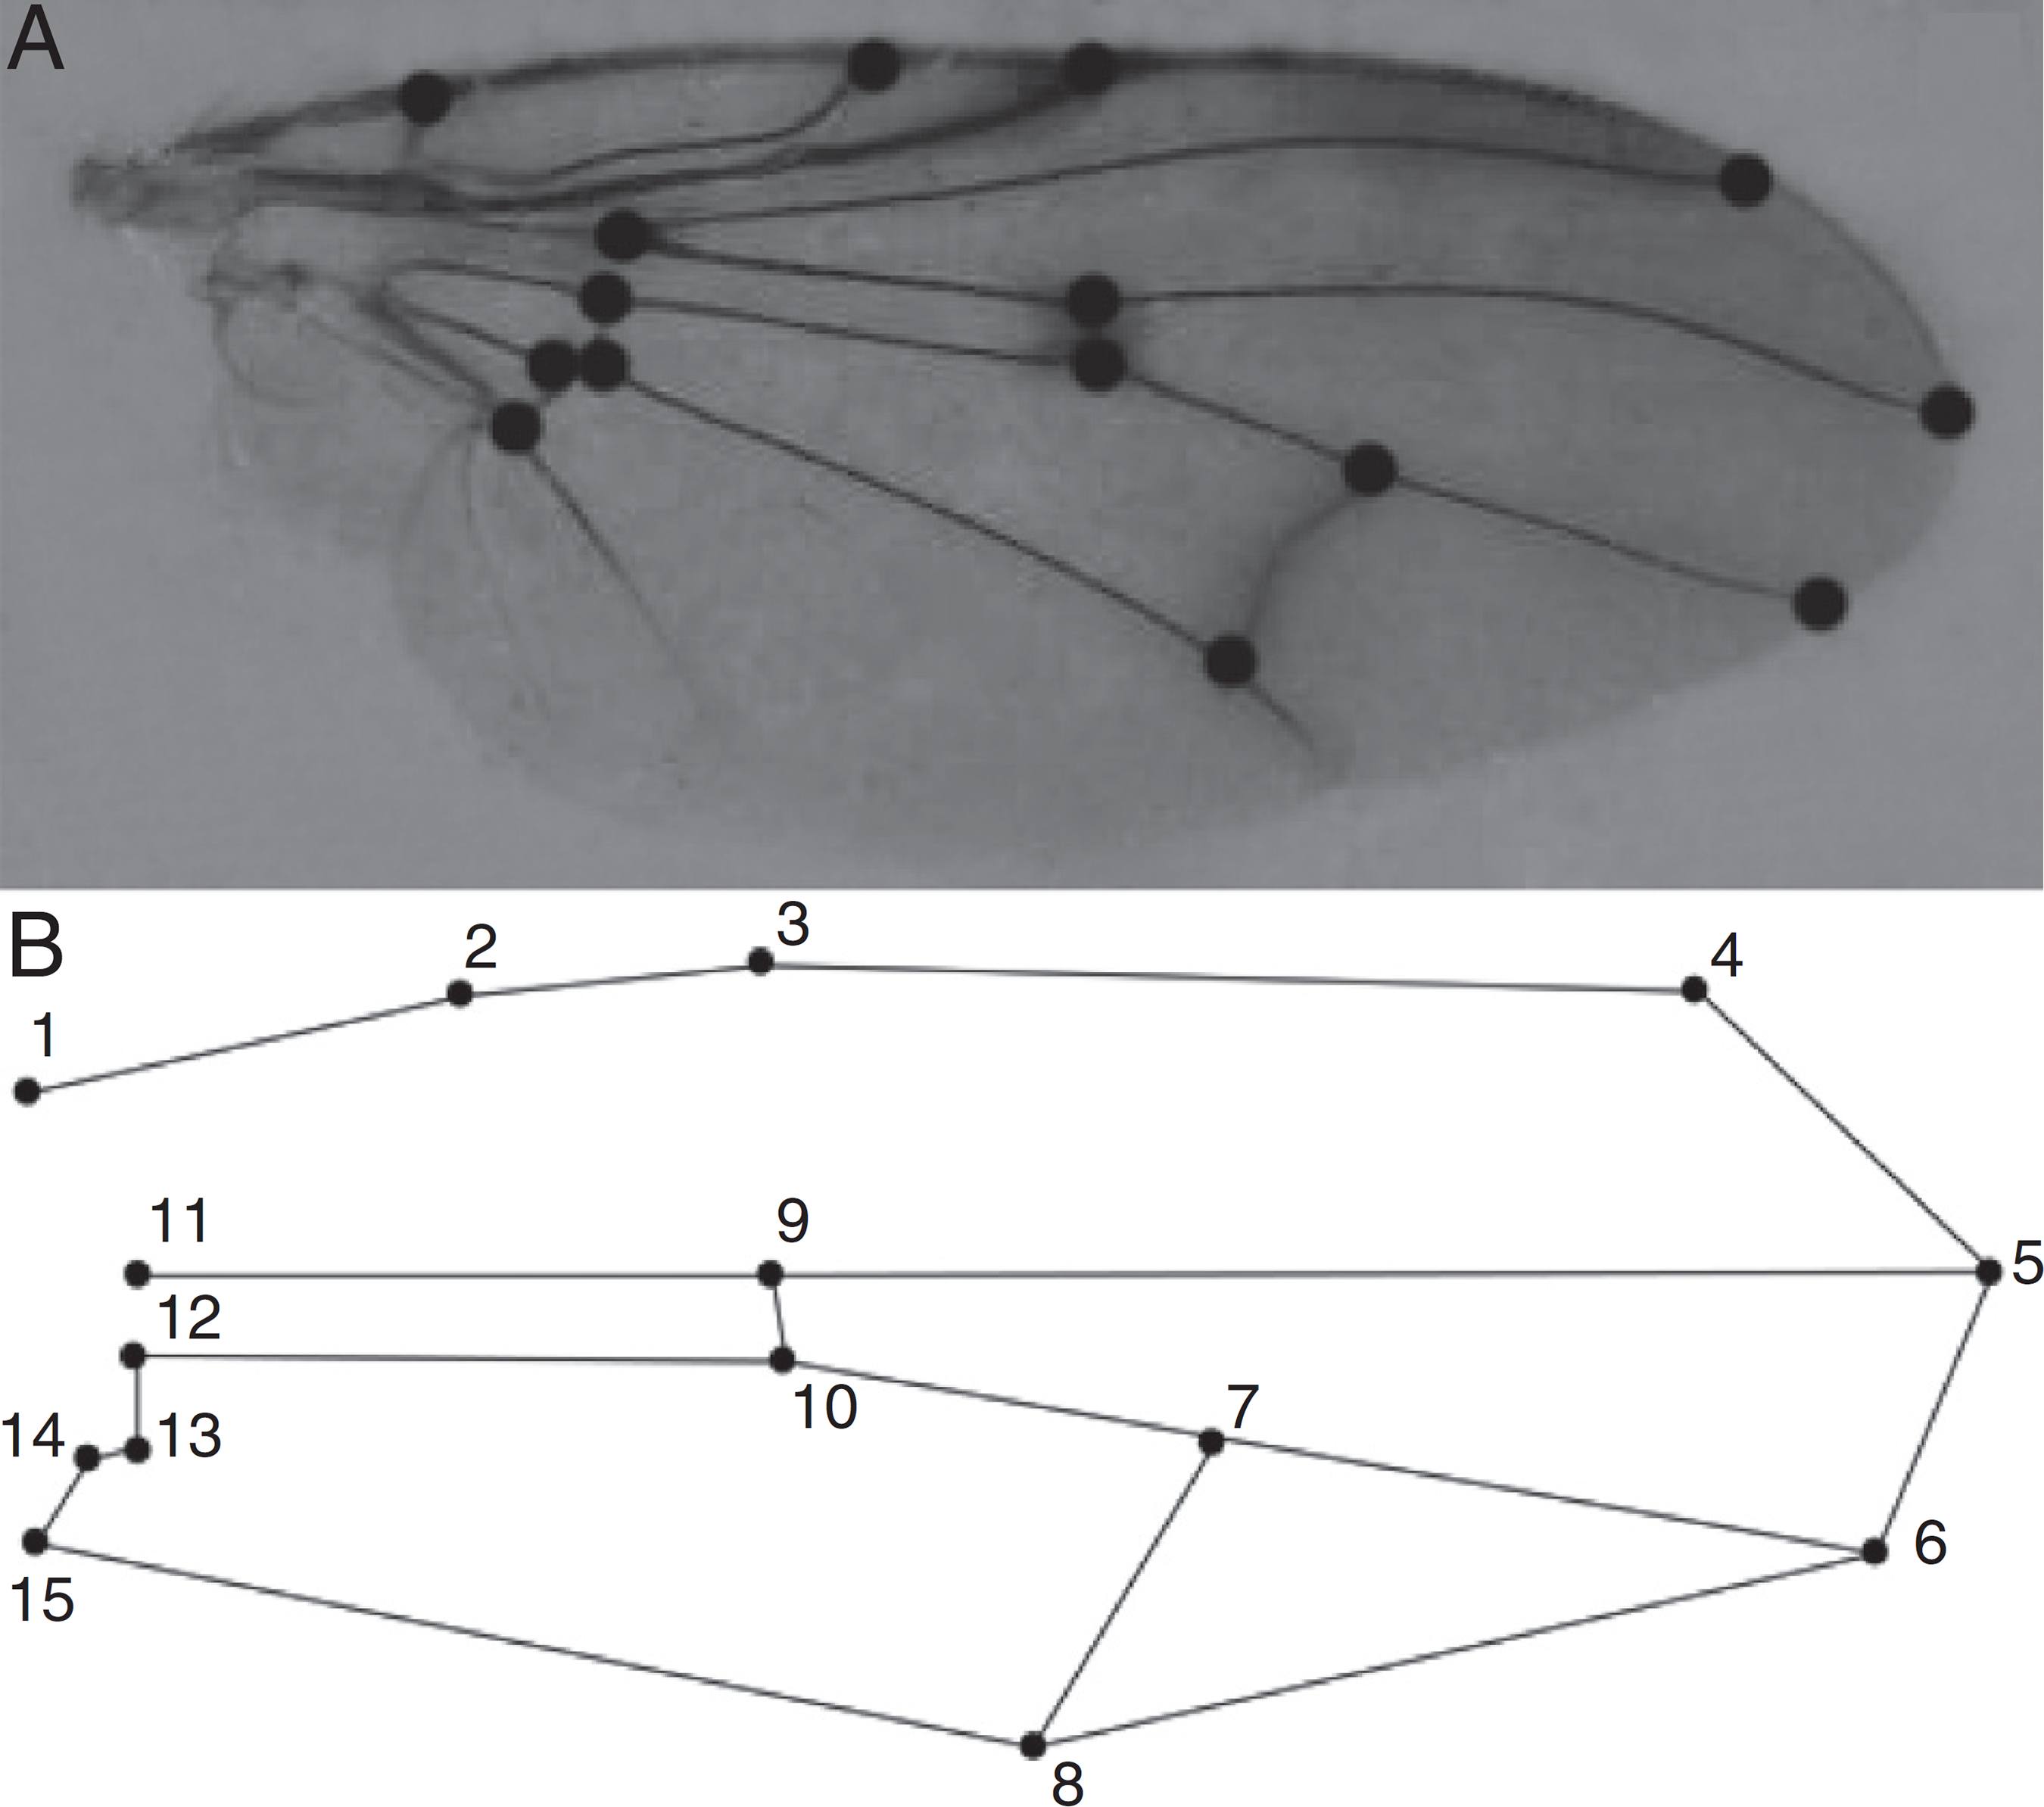
We defined the wing shape through the placement of 15 anatomical landmarks at wing vein intersections (Table 1, Fig. 2). These 15 landmarks were chosen because they could capture morphological variations along the entire wing area (the base, center and tip of the wing). All the landmarks were digitized using tpsDig version 2.16 (Rohlf, 2010Rohlf, F.J., 2010. TpsDig, Version 2.16. Department of Ecology and Evolution, State University of New York at Stony Brook, Available at: http://life.bio.sunysb.edu/morph/bibr28 (accessed 20.04.13).
http://life.bio.sunysb.edu/morph/bibr28...
) and tpsUtil version 1.53 (Rohlf, 2012Rohlf, F.J., 2012. TpsUtil, File Utility Program. Version 1.53. Department of Ecology and Evolution, State University of New York at Stony Brook, Available at: http://life.bio.sunysb.edu/morph (accessed 25.04.13).
http://life.bio.sunysb.edu/morph...
), free software available at http://life.bio.sunysb.edu/morph/.
Number and description of the 15 anatomical landmarks used to characterize wing shape in P. orbitalis.
Dorsal side of the right wing of P. orbitalis showing (A) the 15 (numbered points) anatomical landmarks and (B) the general shape of the wing based on their positions.
The landmark configurations were superimposed using generalized Procrustes analysis (GPA, Rohlf and Slice, 1990Rohlf, F.J., Slice, D.E., 1990. Extensions of the Procrustes method for the optimal superimposition of landmarks. Syst. Zool. 39, 40-59.). The first step of GPA is to center each landmark configuration at the origin that is aligning all the landmark configurations to their centroids, eliminating the effect of position. Then, the landmark configuration is scaled to unit centroid size, thus eliminating the effect of size. Next, the landmark configurations are rotated around the origin to minimize the summed square distance between homologous landmarks, which removes the effect of orientation. After this procedure, the distances (Procrustes distance) between the superimposed configurations correspond to the extents to which the configurations differ in shape, and the superimposed coordinates contain information regarding the shape. To quantify the measurement error, each wing was digitized three times on separate days. We then applied a multivariate analysis of variance (MANOVA) to test for departure from random measurement errors among the replicates.
As a general measure of wing size, we used the centroid size of each specimen, which is the square root of the sum of the squared distances of all the landmarks from their centroid, the center of each configuration (Bookstein, 1991Bookstein, F.L., 1991. Morphometric Tools for Landmark Data: Geometry and Biology. Cambridge University Press, Cambridge.). To test the populations for differences in average size, we compared wing size among the populations using an analysis of variance (ANOVA). To assess the degree of correlation between size and shape, we fit a linear regression between the Procrustes coordinates and the centroid size.
The populations were ordered in a reduced space using canonical variable analysis (CVA). CVA is a technique that maximizes the separation of populations because each axis is constrained to represent the maximum between-group variance. To test whether the populations have diverged in shape, we used a MANOVA with the Procrustes coordinates as the response variable. The difference between groups was characterized by discriminant function analysis (DFA), and the reliability of group memberships was determined by cross-validation.
We tested for an effect of climate on phenotypic changes using a two-block partial least squares (PLS) analysis. This PLS analysis tested for covariation between blocks of variables (wing shape within populations), using the Procrustes coordinates and environmental variables (Rohlf and Corti, 2000Rohlf, F.J., Corti, M., 2000. Use of two-block partial least-squares to study covariation in shape. Syst. Biol. 49, 740-753.). Climate was summarized by 19 variables representing variations in temperature and rainfall: (1) annual mean temperature; (2) mean diurnal range; (3) isothermality; (4) temperature seasonality; (5) maximum temperature of warmest month; (6) minimum temperature of coldest month; (7) annual temperature range; (8) average temperature of the wettest and (9) driest three-month periods; (10) average temperature of the hottest quarter; (11) average temperature of the coldest quarter; (12) annual precipitation; (13) precipitation in the wettest and (14) driest months; (15) seasonal variation in precipitation; and (16) precipitation in the wettest, (17) driest, (18) hottest and (19) coldest quarters. Elevation, latitude and longitude were also included in the environmental matrix. These climatic variables represent a 50-year mean trend in historical data (1950–2000) and were obtained from the WorldClim database (http://www.worldclim.org/) using DIVA-GIS version 7.5 (Hijmans et al., 2001Hijmans, R.J., Cruz, M., Rojas, E., Guarino, L., 2001. DIVA-GIS, Version 7.5. A Geographic Information System for the Management and Analysis of genetic resources data. Manual. International Potato Center and International Plant Genetic Resources Institute, Lima, Available at: http://www.diva-gis.org/ (accessed 4.05.13).
http://www.diva-gis.org/...
). All the variables were standardized before analysis. All analysis was performed using MorphoJ® version 1.05d (Klingenberg, 2011Klingenberg, C.P., 2011. MorphoJ: an integrated software package for geometric morphometrics. Mol. Ecol. Resour. 11, 353-357.) and PAST® version 2.17b (Hammer et al., 2001Hammer, O., Harper, D.A.T., Ryan, P.D., 2001. PAST: paleontological statistics software package for education and data analysis. Palaeontol. Electron. 4, 1-9.).
Results
The error due to landmark digitization was random for both shape (ANOVA; p = 0.971, SS = 0.004, F = 0.36, df = 32) and size (ANOVA; p = 0.988, SS = 1905, F = 0.010, df = 2); thus, any differences between populations were unrelated to image or digitization errors. There was no size (wing centroid size) variation between among the P. orbitalis populations (ANOVA; F = 0.004, p = 0.998, df = 2), with the size ranging from 5 to 6 mm. In contrast with wing size, wing shape differed among all the populations (MANOVA; Wilks' Λ = 0.030, p < 0.001, df = 150, F = 5.38). There was no allometric component because the shape and size variables were not correlated (r = 0.02, p = 0.1873). Therefore, the wing shape difference among the populations was independent of the size of the specimens.
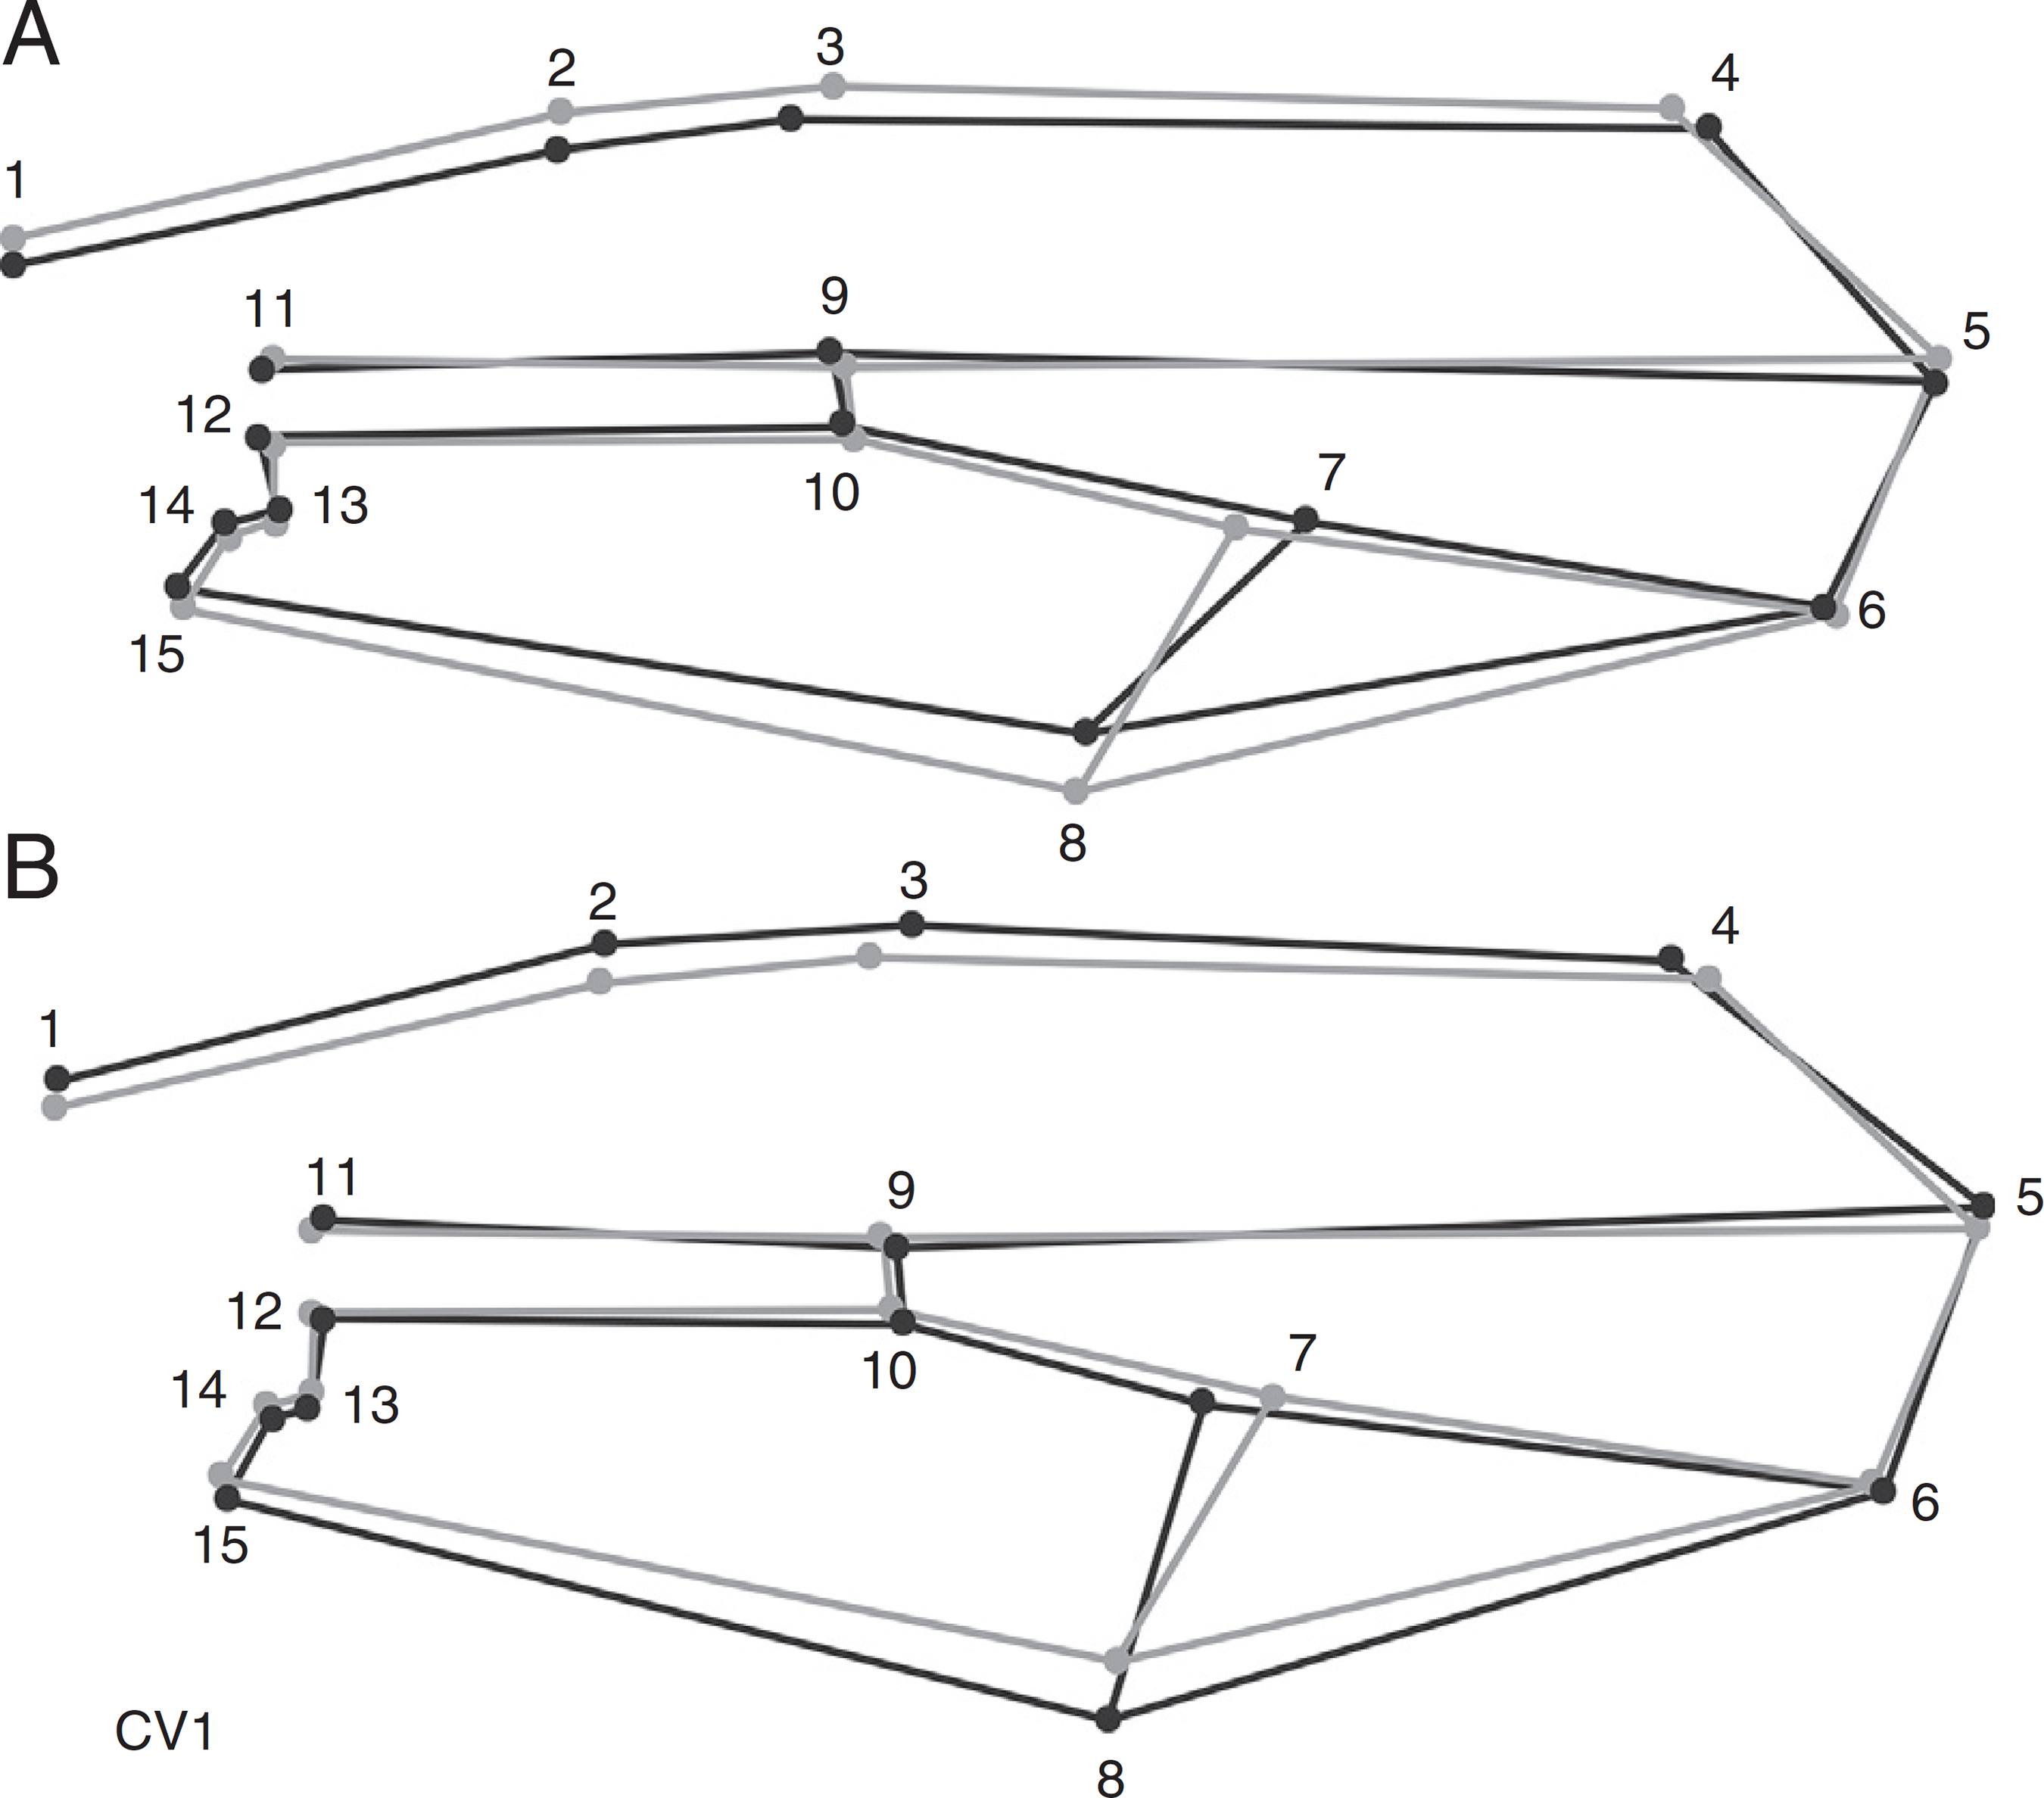
The ordination of the populations by CVA showed that the first and second canonical variables jointly explained 81% of the observed variation. The first canonical axis (accounting for 51% of the variance) ordered the populations in a wider to narrower wing shape gradient. The populations with positive loadings (positive CV1 values, Fig. 3), such as Ponta Grossa, Guarapuava and Colombo, had certain landmarks of the costal margin (landmarks 1,2 and 3) and of the posterior wing margin (landmarks 8 and 15) displaced toward the center of the wing. Additionally, landmarks 4 and 7 displaced toward the wing tip. Together, these landmark displacements shorten the wing blade, resulting in a narrow wing (Fig. 4). The populations with negative loadings on CV1, such as Mbaracayú and Fênix (Figs. 3 and 4), showed a contrasting wing shape compared with those in the positive quadrant. The displacement of the costal (landmarks 1, 2 and 3) and posterior (landmarks 8 and 15) wing margin landmarks expanded the wing blade (Fig. 4). Additionally, landmarks 4 and 7 moved toward the wing base. These rearrangements resulted in an enlarged wing.
Position of the P. orbitalis populations in the space determined by the first two canonical axes. The ellipses indicate 95% confidence intervals.
Graphic reconstruction of the wing shape of individuals with (A) positive and (B) negative scores on the first canonical axis (CV1, increased 10 times). The lines in gray represent the average configuration of the wing, and those in black represent the canonical first variable.
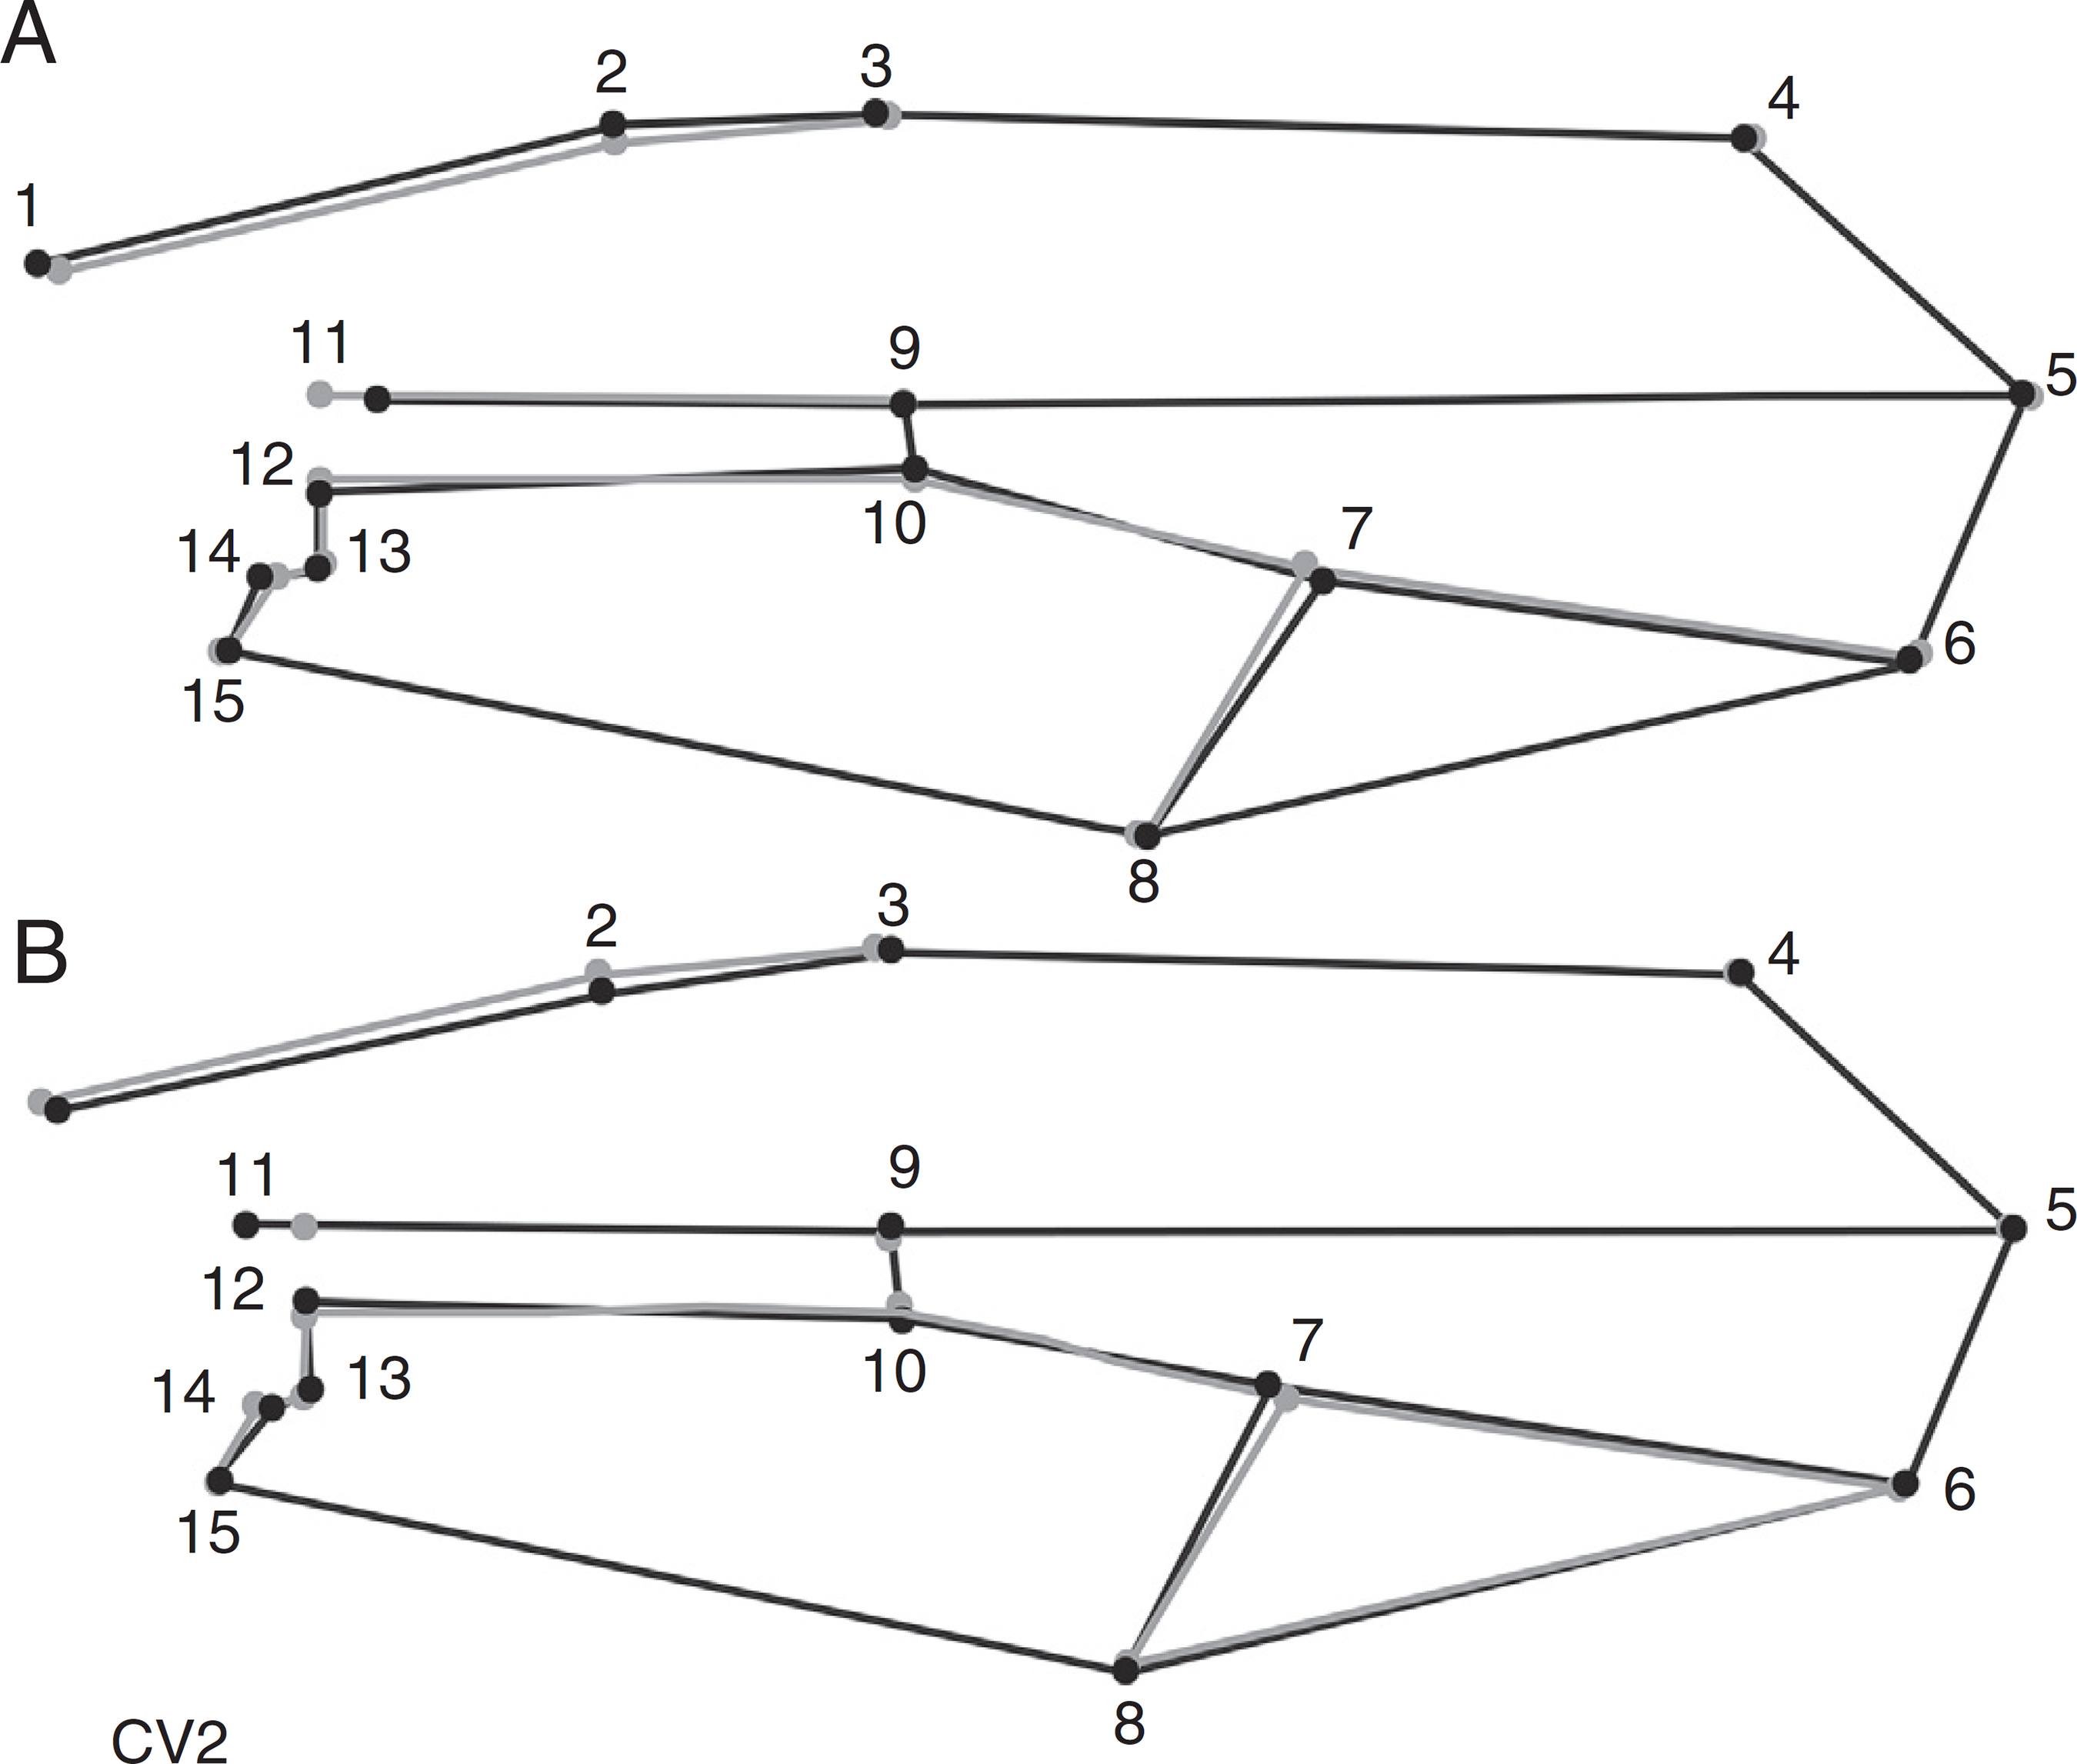
The second canonical axis (CV2, accounting for 30% of the variance) showed only local changes (Fig. 5), in contrast with CV1, for which the morphological changes were global. The landmark displacement occurred mostly in the basal region (landmarks 1, 2, and 11). The wings of populations loaded with positive scores (Fênix, Colombo and Guarapuava) had a slight expansion of the anterior region (landmarks 1 and 2) and at landmark 11 in a more apical position. The populations with negative loadings on CV2 (Mbaracayú and Ponta Grossa) showed less basal area than that shown by populations on the positive CV2 quadrant due to the basal displacement of landmark 11 and a slightly posterior displacement of landmarks 1 and 2. The cross validation tests indicated that an average of 97% (ranging between 95% and 99%) of individuals were correctly allocated to their respective populations (Table 2).
Percent correct classification of populations of P. orbitalis based on wing morphology and discriminant function analysis (DFA).
Graphic reconstruction of the wing shape of individuals with (A) positive and (B) negative scores on the second canonical axis (CV2, increased 10 times). The lines in gray represent the average configuration, and those in black represent the second canonical variable.
All dimensions of the PLS analysis (Table 3) were statistically significant (all with p < 0.01), but the PLS1 axis alone explained 92% of the variation in the shape variables. Elevation and precipitation in the driest month were negatively correlated with PLS1 (-0.79 and -0.20, respectively), whereas the minimum temperature of the coldest month and average temperature of the driest quarter were positively correlated (0.23 and 0.25, respectively) with PLS1 (Fig. 6). The populations clustered in two groups along this axis: Guarapuava, Ponta Grossa and Colombo in one group and Mbaracayú, Fênix and Jundiaí do Sul in another. The variation in shape was independent of latitude and longitude. Thus, higher elevations and greater rainfall were associated with narrower wings, and lower elevations and temperature were associated with wider wings (Fig. 7).
PLS result between the shape and environmental variables. Notice that the greater PLS1 has the strongest correlation (all p < 0.01).
Results of the PLS analysis, with Colombo (6), Guarapuava (4) and Ponta Grossa (5) showing negative values and Fênix (2), Jundiaí do Sul (3) and Mbaracayú (1) showing positive values.
Comparison between the PLS analysis (with elevation) and CVA (CV1) showing that individuals with a wider wing phenotype occur in populations living at a maximum elevation of 700 m (A) and those with a thinner wing phenotype occur at elevations over 900 m (B). Localities are as follows: 1. Mbaracayú, 2. Fênix, 3. Jundiaí do Sul, 4. Guarapuava, 5. Ponta Grossa and 6. Colombo.
Discussion
Our results showed that P. orbitalis wing shape varies geographically, but no such variation was detected for wing size (centroid size). Additionally, all the populations differed in wing shape, which led to a high success rate (an average of 97%) in predicting the population in which each individual belonged. Although all the populations had average wing shapes that differed from one another, the CVA showed two clusters of populations based on wing shape (narrow wing and broad wing clusters), with the shape of both groups correlated with elevation, precipitation and temperature but not with wing size. Taken together, these findings suggest that shape differences in P. orbitalis result from a plastic response to local environmental conditions.
Although elevation was the single variable that most influenced the PLS axis, in general, the axis could be viewed as a temperature/precipitation gradient because elevation and temperature are negatively correlated. Temperature is one of the most important drivers of phenotypic plasticity in insects (Lomônaco and Prado, 1994Lomônaco, C., Prado, A.P., 1994. Morfometria de Musca domestica L. de granjas de galinhas poedeiras. An. Soc. Entomol. Bras. 23, 171-178.; Imasheva et al., 1995Imasheva, A.G., Bubli, O.A., Lazebny, O.E., Zhivotovsky, L.A., 1995. Geographic differentiation in wing shape in Drosophila melanogaster. Genetica 96, 303-306.; Whitman and Ananthakrishnan, 2009Whitman, D., Ananthakrishnan, T.N., 2009. Phenotypic Plasticity of Insects: Mechanisms and Consequences. Science Publishers, Enfield.). The temperature-size rule proposes that insects developing under high temperature have a smaller size (Atkinson, 1994Atkinson, D., 1994. Temperature and organism size – a biological law for ectotherms? Adv. Ecol. Res. 3, 1-58.). As wing size correlates with body size, we would expect smaller wings at high temperatures, a hypothesis we reject because we did not find any difference in wing size among the populations. However, temperature also affects wing load (Gilchrist and Huey, 2004Gilchrist, G.W., Huey, R.B., 2004. Plastic and genetic variation in wing loading as a function of temperature within and among parallel clines in Drosophila subobscura. Integr. Comp. Biol. 44, 461-470.), which is dependent on the shape of the wing. Thus, we would expect that a population from cooler areas would have a reduced wing load to compensate for reduced flight performance due to the smaller adult size (Dudley, 2000Dudley, R., 2000. The Biomechanics of Insect Flight: Form, Function, and Evolution. Princeton University Press, Princeton.). A reduced wing loading could be achieved by increasing the wing area (Dudley, 2000Dudley, R., 2000. The Biomechanics of Insect Flight: Form, Function, and Evolution. Princeton University Press, Princeton.), but populations from colder climates (positive CVA quadrant and negative correlations with PLS) had long and slender wings, which did not match the prediction of the wing load hypothesis. Thus, the wing shape changes we described are not totally related to an aerodynamic hypothesis. Our findings highlight the complex interaction between genotype and environment.
Variations in size between populations can be associated with alterations in shape (Dujardin, 2008Dujardin, J.P., 2008. Morphometrics applied to medical entomology. Infect. Genet. Evol. 8, 875-890.); however, we did not find this trend. The absence of allometry associated with geographical variations in wing shape has also been found in Drosophila serrata Malloch (1927) (Hoffmann and Shirriffs, 2002Hoffmann, A.A., Shirriffs, J., 2002. Geographic variation for wing shape in Drosophila serrata. Evolution 5, 1068-1073.). Therefore, this absence of allometric patterns means that factors other than allometry are influencing wing shape. Additionally, the PLS analysis did not show significant correlation between shape and geographical distance, as observed in other studies (Motoki et al., 2012Motoki, M.T., Suesdek, L., Bergo, E.S., Sallum, M.A.M., 2012. Wing geometry of Anopheles darlingi Root (Diptera: Culicidae) in five major Brazilian ecoregions. Infect. Genet. Evol. 12, 1246-1252.), perhaps as a result of sampling a larger geographic area in those studies compared with that sampled by our study (Monroy et al., 2003Monroy, C., Bustamante, D.M., Rodas, A., Rosales, R., Mejía, M., Tabaru, Y., 2003. Geographic distribution and morphometric differentiation of Triatoma nitida Usinger 1939 (Hemiptera: Reduviidae: Triatominae) in Guatemala. Mem. Inst. Oswaldo Cruz 98, 37-43.).
An effect of elevation has been reported in other studies. For instance, Belen et al. (2004)Belen, A., Alten, B., Aytekin, M., 2004. Altitudinal variation in morphometric and molecular characteristics of Phlebotomus papatasi populations. Med. Vet. Entomol. 18, 343-350. found that Phlebotomus papatasi (Scopoli, 1786) populations from a higher elevation formed a distinct group. In studies with Culex theileri Theobald (1903), Demirci et al. (2012)Demirci, B., Lee, Y., Lanzaro, G.C., Alten, B., 2012. Altitudinal genetic and morphometric variation among populations of Culex theileri Theobalt (Diptera: Culicidae) from northeastern Turkey. J. Vector Ecol. 37, 197-209. also found wing shape modifications in populations between elevations of 808 and 2130 m. While evaluating the traditional and geometrical morphometry of Drosophila mediopunctata Dobzhansky & Pavan (1943), Bitner-Mathé et al. (1995)Bitner-Mathé, B.C., Peixoto, A.A., Klaczko, L.B., 1995. Morphological variation in a natural population of Drosophila mediopunctata: altitudinal cline, temporal changes and influence of chromosome inversions. Heredity 75, 54-61. also observed an association of form with elevation, indicating clinal variation with elevation in this species. Additionally, we can establish a morphological pattern in P. orbitalis related to elevation, in that below or above an elevation of 900 m, populations showed a broad- or thin-wing phenotype, respectively. The standard thin wing found in populations at higher elevations could confer an advantage because the reduction of air density at higher elevations can interfere with the aerodynamic forces of insect wings (Dudley, 2000Dudley, R., 2000. The Biomechanics of Insect Flight: Form, Function, and Evolution. Princeton University Press, Princeton.). For populations at lower elevations, the characteristic broad-wing phenotype can lead to an increased flight energy cost (Ayala et al., 2011Ayala, D., Caro-Hiano, H., Dujardin, J.P., Rahola, N., Simard, F., Fontenille, D., 2011. Chromosomal and environmental determinants of morphometric variation in natural populations of the malaria vector Anopheles funestus in Cameroon. Infect. Genet. Evol. 5, 940-947.). However, the organisms can slow down the wing to maintain sustentation flight, which economizes energy (Dillon et al., 2006Dillon, M.E., Frazier, M.R., Dudley, R., 2006. Into thin air: physiology and evolution of alpine insects. Integr. Comp. Biol. 46, 49-61.).
In the aforementioned manner, the morphometric variations that we found in P. orbitalis are basically associated with organismal alterations in the face of environmental modifications. Our results showed two basic wing shapes (narrow and broad), which are correlated with elevation, precipitation and temperature and do not scale allometrically with size.
Acknowledgments
We thank two anonymous reviewers who greatly improved an earlier version of the manuscript. Funding was provided by Conselho Nacional de Desenvolvimento Científico e Tecnológico (CNPq), an M.Sc. scholarship (V.M.A.); research grant (C.J.B.C.) [304713/2011-2], research grant (M.O.M.) [307947/2009-2] and Fundação Araucaria, research grant (M.O.M.) [686/2014].
References
- Adams, D.C., Rohlf, F.J., Slice, D.E., 2013. A field comes of age: geometric morphometrics in the 21st century. Hystrix 24, 7-14.
- Agrawal, A.A., 2001. Phenotypic plasticity in the interactions and evolution of species. Science 294, 321-326.
- Angilletta, M.J., Steury, T.D., Sears, M.W., 2004. Temperature, growth rate, and body size in ectotherms: fitting pieces of a life-history puzzle. Integr. Comp. Biol. 44, 108-140.
- Atkinson, D., 1994. Temperature and organism size – a biological law for ectotherms? Adv. Ecol. Res. 3, 1-58.
- Ayala, D., Caro-Hiano, H., Dujardin, J.P., Rahola, N., Simard, F., Fontenille, D., 2011. Chromosomal and environmental determinants of morphometric variation in natural populations of the malaria vector Anopheles funestus in Cameroon. Infect. Genet. Evol. 5, 940-947.
- Aytekin, A.M., Alten, B., Caglar, S.C., Ozbel, Y., Kaynas, S., Simsek, F.M., Kasap, O.E., Belen, A., 2007. Phenotypic variation among local populations of phlebotomine sand flies (Diptera: Psychodidae) in southern Turkey. J. Vector Ecol. 32, 226-234.
- Belen, A., Alten, B., Aytekin, M., 2004. Altitudinal variation in morphometric and molecular characteristics of Phlebotomus papatasi populations. Med. Vet. Entomol. 18, 343-350.
- Bitner-Mathé, B.C., Peixoto, A.A., Klaczko, L.B., 1995. Morphological variation in a natural population of Drosophila mediopunctata: altitudinal cline, temporal changes and influence of chromosome inversions. Heredity 75, 54-61.
- Bookstein, F.L., 1991. Morphometric Tools for Landmark Data: Geometry and Biology. Cambridge University Press, Cambridge.
- Dillon, M.E., Frazier, M.R., Dudley, R., 2006. Into thin air: physiology and evolution of alpine insects. Integr. Comp. Biol. 46, 49-61.
- Demirci, B., Lee, Y., Lanzaro, G.C., Alten, B., 2012. Altitudinal genetic and morphometric variation among populations of Culex theileri Theobalt (Diptera: Culicidae) from northeastern Turkey. J. Vector Ecol. 37, 197-209.
- Devicari, M., Lopes, A.R., Suesdek, L., 2011. Dimorfismo sexual de Aedes scapularis (Diptera: Culicidae). Biota Neotrop. 11, 165-169.
- Dudley, R., 2000. The Biomechanics of Insect Flight: Form, Function, and Evolution. Princeton University Press, Princeton.
- Dujardin, J.P., 2008. Morphometrics applied to medical entomology. Infect. Genet. Evol. 8, 875-890.
- Ghalambor, C.K., Mckay, J.K., Carroll, S.P., Reznick, D.N., 2007. Adaptive versus non-adaptive phenotypic plasticity and the potential for contemporary adaptation in new environments. Funct. Ecol. 21, 394-407.
- Gilchrist, G.W., Huey, R.B., 2004. Plastic and genetic variation in wing loading as a function of temperature within and among parallel clines in Drosophila subobscura Integr. Comp. Biol. 44, 461-470.
- Griffiths, J.A., Schiffer, M., Hoffmann, A.A., 2005. Clinal variation and laboratory adaptation in the rainforest species Drosophila birchii for stress resistance, wing size, wing shape and development time. J. Evol. Biol. 18, 213-222.
- Hidalgo, K., Dujardin, J.P., Mouline, K., Dabiré, R.K., Renault, D., Simard, F., 2015. Seasonal variation in wing size and shape between geographic populations of the malaria vector Anopheles coluzzii in Burkina Faso (West Africa). Acta Trop. 143, 79-88.
- Hijmans, R.J., Cruz, M., Rojas, E., Guarino, L., 2001. DIVA-GIS, Version 7.5. A Geographic Information System for the Management and Analysis of genetic resources data. Manual. International Potato Center and International Plant Genetic Resources Institute, Lima, Available at: http://www.diva-gis.org/ (accessed 4.05.13).
» http://www.diva-gis.org/ - Hoffmann, A.A., Shirriffs, J., 2002. Geographic variation for wing shape in Drosophila serrata Evolution 5, 1068-1073.
- Hammer, O., Harper, D.A.T., Ryan, P.D., 2001. PAST: paleontological statistics software package for education and data analysis. Palaeontol. Electron. 4, 1-9.
- Imasheva, A.G., Bubli, O.A., Lazebny, O.E., Zhivotovsky, L.A., 1995. Geographic differentiation in wing shape in Drosophila melanogaster Genetica 96, 303-306.
- Kjaersgaard, A., Pertoldi, C., Loeschcke, V., Blanckenhorn, W.U., 2013. The effect of fluctuating temperatures during development on fitness-related traits of Scatophaga stercoraria (Diptera: Scathophagidae). Environ. Entomol. 5, 1069-1078.
- Kawecki, T.J., Ebert, D., 2004. Conceptual issues in local adaptation. Ecol. Lett. 7, 1225-1241.
- Klingenberg, C.P., 2011. MorphoJ: an integrated software package for geometric morphometrics. Mol. Ecol. Resour. 11, 353-357.
- Lomônaco, C., Prado, A.P., 1994. Morfometria de Musca domestica L. de granjas de galinhas poedeiras. An. Soc. Entomol. Bras. 23, 171-178.
- Löwenberg-neto, P., de Carvalho, C.J.B., 2013. Muscidae (Insecta: Diptera) of Latin America and the Caribbean: geographic distribution and check-list by country. Zootaxa 3650, 1-147.
- Mateus, R.P., Moura, M.O., Manfrin, M.H., Monteiro, F.M., Sene, S.G., 2013. Contrasting patterns of within-species morphological variation in two cactophilic Drosophila species (Diptera: Drosophilidae). Neotrop. Entomol. 42, 384-392.
- Marsteller, S., Adams, D.C., Collyer, M.L., Cordon, M., 2009. Six cryptic species on a single species of host plant: morphometric evidence for possible reproductive character displacement. Ecol. Entomol. 34, 66-73.
- Marinoni, R.C., Dutra, R.R.C., 1993. Levantamento da fauna entomológica no Estado do Paraná. I. Introdução. Situação climática e florística de oito pontos de coleta. Dados faunísticos de agosto de 1986 a julho de 1987. Rev. Bras. Zool. 8, 31-73.
- Monroy, C., Bustamante, D.M., Rodas, A., Rosales, R., Mejía, M., Tabaru, Y., 2003. Geographic distribution and morphometric differentiation of Triatoma nitida Usinger 1939 (Hemiptera: Reduviidae: Triatominae) in Guatemala. Mem. Inst. Oswaldo Cruz 98, 37-43.
- Motoki, M.T., Suesdek, L., Bergo, E.S., Sallum, M.A.M., 2012. Wing geometry of Anopheles darlingi Root (Diptera: Culicidae) in five major Brazilian ecoregions. Infect. Genet. Evol. 12, 1246-1252.
- Pigliucci, M., 2005. Evolution of phenotypic plasticity: where are we going now? Trends Ecol. Evol. 20, 481-486.
- Relyea, R.A., 2004. Integrating phenotypic plasticity when death is on the line: insights from predator–prey systems. In: Pigliucci, M., Preston, K. (Eds.), The Evolutionary Biology of Complex Phenotypes. Oxford University Press, Oxford, pp. 176–194.
- Reeve, M.W., Fowler, K., Partridge, L., 2000. Increased body size confers greater fitness at lower experimental temperature in male Drosophila melanogaster J. Evol. Biol. 13, 836-844.
- Rohlf, F.J., Slice, D.E., 1990. Extensions of the Procrustes method for the optimal superimposition of landmarks. Syst. Zool. 39, 40-59.
- Rohlf, F.J., Corti, M., 2000. Use of two-block partial least-squares to study covariation in shape. Syst. Biol. 49, 740-753.
- Rohlf, F.J., 2010. TpsDig, Version 2.16. Department of Ecology and Evolution, State University of New York at Stony Brook, Available at: http://life.bio.sunysb.edu/morph/bibr28 (accessed 20.04.13).
» http://life.bio.sunysb.edu/morph/bibr28 - Rohlf, F.J., 2012. TpsUtil, File Utility Program. Version 1.53. Department of Ecology and Evolution, State University of New York at Stony Brook, Available at: http://life.bio.sunysb.edu/morph (accessed 25.04.13).
» http://life.bio.sunysb.edu/morph - Scheiner, S.M., 1993. Genetics and evolution of phenotypic plasticity. Annu. Rev. Ecol. Syst. 24, 35-68.
- Strauss, R.E., Bookstein, F.L., 1982. The truss: body form reconstruction in morphometrics. Syst. Zool. 31, 113-135.
- Soto, I.M., Carreira, V.P., Fanara, J.J., Hasson, E., 2007. Evolution of male genitalia: environmental and genetic factors affect genital morphology in two Drosophila sibling species and their hybrids. BMC Evol. Biol. 7, 1-11.
- van Heerwaarden, B., Sgrò, C.M., 2011. The effect of developmental temperature on the genetic architecture underlying size and thermal clines in Drosophila melanogaster and D. simulans from the east coast of Australia. Evolution 65, 1048-1067.
- Via, S., Gomulkiewicz, R., de Jong, G., Scheiner, S.M., Schlichting, C.D., Tienderen, P.H., 1995. Adaptive phenotypic plasticity: consensus and controversy. Trends Ecol. Evol. 10, 212-217.
- Whitman, D., Ananthakrishnan, T.N., 2009. Phenotypic Plasticity of Insects: Mechanisms and Consequences. Science Publishers, Enfield.
Publication Dates
-
Publication in this collection
Apr-Jun 2016
History
-
Received
06 May 2015 -
Accepted
13 Feb 2016