Abstracts
Information on the spatial structure of soil physical and structural properties is needed to evaluate the soil quality. The purpose of this study was to investigate the spatial behavior of preconsolidation pressure and soil moisture in six transects, three selected along and three across coffee rows, at three different sites under different tillage management systems. The study was carried out on a farm, in Patrocinio, state of Minas Gerais, in the Southeast of Brazil (18 º 59 ' 15 '' S; 46 º 56 ' 47 '' W; 934 m asl). The soil type is a typic dystrophic Red Latosol (Acrustox) and consists of 780 g kg-1 clay; 110 g kg-1 silt and 110 g kg-1 sand, with an average slope of 3 %. Undisturbed soil cores were sampled at a depth of 0.10-0.13 m, at three different points within the coffee plantation: (a) from under the wheel track, where equipment used in farm operations passes; (b) in - between tracks and (c) under the coffee canopy. Six linear transects were established in the experimental area: three transects along and three across the coffee rows. This way, 161 samples were collected in the transect across the coffee rows, from the three locations, while 117 samples were collected in the direction along the row. The shortest sampling distance in the transect across the row was 4 m, and 0.5 m for the transect along the row. No clear patterns of the preconsolidation pressure values were observed in the 200 m transect. The results of the semivariograms for both variables indicated a high nugget value and short range for the studied parameters of all transects. A cyclic pattern of the parameters was observed for the across-rows transect. An inverse relationship between preconsolidation pressure and soil moisture was clearly observed in the samples from under the track, in both directions.
semivariogram; soil compaction; geostatistics; soil sampling
Informações sobre a estrutura espacial das propriedades físicas e estruturais do solo são necessárias para avaliar a sua qualidade. O objetivo deste estudo foi investigar o comportamento espacial da pressão de preconsolidação e da umidade do solo em seis transectos: três ao longo e três perpendiculares às linhas de plantio do café, em três posições de amostragem com diferentes condições de tráfego. O experimento foi conduzido em uma fazenda localizada em Patrocínio, no Estado de Minas Gerais (latitude de 18 º 59 ' 15 '' S; longitude de 46 º 56 ' 47 '' W; 934 m acima do nível do mar). O solo, classificado como Latossolo Vermelho distrσfico típico, apresenta 780 g kg-1 de argila, 110 g kg-1 de silte e 110 g kg-1 de areia, com declividade média de 3 %. Amostras indeformadas foram coletadas na profundidade de 0,10-0,13 m, em três diferentes locais na lavoura cafeeira: na linha de tráfego, na entrelinha e sob a projeção da saia do cafeeiro. Foram dispostos seis transectos lineares na área experimental: três ao longo das linhas de plantio e três através das linhas de plantio. Assim, 161 amostras foram coletadas nos transectos através das linhas nos três locais estudados e 117 ao longo das linhas de plantio, em cada um dos locais avaliados. A menor distância entre os pontos amostrados foi de 4 m através dos transectos e de 0,5 m no sentido das linhas de plantio. Os valores de pressão de preconsolidação não exibiram padrões claros nos transectos. Os resultados dos semivariogramas para ambas as variáveis indicaram alto efeito pepita e curtos alcances em todas as situações estudadas e em todos os transectos. Um padrão cíclico dos parâmetros foi observado nos transectos através das linhas de plantio. A relação inversa entre a pressão de preconsolidação e a umidade do solo foi mais bem visualizada nas amostras coletadas na linha de tráfego, em ambas as direções avaliadas.
semivariograma; compactação do solo; geoestatística; amostragem do solo
COMMISSION 2.2 - SOIL PHYSICS
Spatial patterns of preconsolidation pressure and soil moisture along transects in two directions under coffee1 1 Part of Doctorate thesis of first author. Department of Soil Science, Federal University of Lavras - (DCS/UFLA). Received for publication in May 12, 2010 and approved in May 11, 2011.
Padrões espaciais da pressão de preconsolidação e da umidade do solo ao longo de transecções em duas direções em uma lavoura cafeeira
Ivoney GontijoI; Moacir de Souza Dias JuniorII; Paulo Tácito Gontijo GuimarãesIII; Marcelo Silva de OliveiraIV; Ayodele Ebenezer AjayiV
IProfessor, Department of Agronomy and Biology Science, University Center North of Espírito Santo, Federal University of Espírito Santo - (DCAB/CEUNES/UFES). Rodovia BR 101 Norte, km 60, Bairro Litorâneo, CEP: 29930-900, São Mateus, Espírito Santo State, Brazil. E-mail: ivoneygontijo@ceunes.ufes.br
IIProfessor, Department of Soil Science, Federal University of Lavras - (DCS/UFLA), CNPq and FAPEMIG researcher, P. O. Box 3037, CEP 37200-000 Lavras, Minas Gerais State, Brazil. E-mail: msouzadj@ufla.br
IIIResearcher, Empresa de Pesquisa Agropecuária de Minas Gerais - (EPAMIG/CTSM). P. O. Box 176, CEP 37200-000, Lavras, Minas Gerais State, Brazil. FAPEMIG researcher, E-mail: paulotgg@ufla.br
IVProfessor, Department of Exact Sciences, Federal University of Lavras - (DEX/UFLA). E-mail: marcelo.oliveira@ufla.br
VProfessor, Department of Agricultural Engineering, Federal University of Technology, PMB 704, Akure, Ondo State, Nigeria. E-mail: ayo.ajayi@gmail.com
SUMMARY
Information on the spatial structure of soil physical and structural properties is needed to evaluate the soil quality. The purpose of this study was to investigate the spatial behavior of preconsolidation pressure and soil moisture in six transects, three selected along and three across coffee rows, at three different sites under different tillage management systems. The study was carried out on a farm, in Patrocinio, state of Minas Gerais, in the Southeast of Brazil (18 º 59 ' 15 '' S; 46 º 56 ' 47 '' W; 934 m asl). The soil type is a typic dystrophic Red Latosol (Acrustox) and consists of 780 g kg-1 clay; 110 g kg-1 silt and 110 g kg-1 sand, with an average slope of 3 %. Undisturbed soil cores were sampled at a depth of 0.10-0.13 m, at three different points within the coffee plantation: (a) from under the wheel track, where equipment used in farm operations passes; (b) in - between tracks and (c) under the coffee canopy. Six linear transects were established in the experimental area: three transects along and three across the coffee rows. This way, 161 samples were collected in the transect across the coffee rows, from the three locations, while 117 samples were collected in the direction along the row. The shortest sampling distance in the transect across the row was 4 m, and 0.5 m for the transect along the row. No clear patterns of the preconsolidation pressure values were observed in the 200 m transect. The results of the semivariograms for both variables indicated a high nugget value and short range for the studied parameters of all transects. A cyclic pattern of the parameters was observed for the across-rows transect. An inverse relationship between preconsolidation pressure and soil moisture was clearly observed in the samples from under the track, in both directions.
Index terms: semivariogram, soil compaction, geostatistics, soil sampling.
RESUMO
Informações sobre a estrutura espacial das propriedades físicas e estruturais do solo são necessárias para avaliar a sua qualidade. O objetivo deste estudo foi investigar o comportamento espacial da pressão de preconsolidação e da umidade do solo em seis transectos: três ao longo e três perpendiculares às linhas de plantio do café, em três posições de amostragem com diferentes condições de tráfego. O experimento foi conduzido em uma fazenda localizada em Patrocínio, no Estado de Minas Gerais (latitude de 18 º 59 ' 15 '' S; longitude de 46 º 56 ' 47 '' W; 934 m acima do nível do mar). O solo, classificado como Latossolo Vermelho distrσfico típico, apresenta 780 g kg-1 de argila, 110 g kg-1 de silte e 110 g kg-1 de areia, com declividade média de 3 %. Amostras indeformadas foram coletadas na profundidade de 0,10-0,13 m, em três diferentes locais na lavoura cafeeira: na linha de tráfego, na entrelinha e sob a projeção da saia do cafeeiro. Foram dispostos seis transectos lineares na área experimental: três ao longo das linhas de plantio e três através das linhas de plantio. Assim, 161 amostras foram coletadas nos transectos através das linhas nos três locais estudados e 117 ao longo das linhas de plantio, em cada um dos locais avaliados. A menor distância entre os pontos amostrados foi de 4 m através dos transectos e de 0,5 m no sentido das linhas de plantio. Os valores de pressão de preconsolidação não exibiram padrões claros nos transectos. Os resultados dos semivariogramas para ambas as variáveis indicaram alto efeito pepita e curtos alcances em todas as situações estudadas e em todos os transectos. Um padrão cíclico dos parâmetros foi observado nos transectos através das linhas de plantio. A relação inversa entre a pressão de preconsolidação e a umidade do solo foi mais bem visualizada nas amostras coletadas na linha de tráfego, em ambas as direções avaliadas.
Termos de indexação: semivariograma, compactação do solo, geoestatística, amostragem do solo.
INTRODUCTION
Nowadays, the main factor that may limit agricultural production and induce the degradation of environmental quality in mechanized agriculture is soil compaction. This is particularly a problem in coffee plantations, where traffic is intensive because of mechanization in all production stages. Thus, a better knowledge on the effects of soil compaction is needed to identify prevention strategies.
Preconsolidation pressure (σp) is commonly defined as the highest pressure to which the soil had been exposed in the past (Dias Junior & Pierce, 1996) and represents a measure of the soil bearing capacity. The σp of a soil is usually calculated from soil compression curves, which relate bulk density plotted against the logarithm of the applied pressure. The application of pressures < σp to the soil causes elastic deformation, while the application of pressures > σp, causes plastic deformations. This soil property has been used by several authors as indicator of soil structure sustainability at a given soil moisture level (Kondo & Dias Junior, 1999; Imhoff et al., 2001; Silva et al., 2003; Ajayi et al., 2010). However, relatively few studies have addressed this important soil physical property in terms of its spatial variability, as related to the soil structure sustainability under mechanized agriculture.
Only in recent years have scientists begun to study the variation in soil properties using geostatistical methods in which the structural distribution of a given soil parameter in space can be investigated (Davidoff & Selim, 1988). The semivariogram was developed as a very adequate and informative tool to measure the structural variation of a variable of interest (Vieira et al., 1983). Geostatistical methods have received considerable attention in agricultural sciences in recent years and have been applied to quantify the spatial variability of different soil properties. Geostatistical analyses have been used to estimate spatial variability of soil compaction (Utset & Cid, 2001; Ferrero et al, 2005; Gontijo et al., 2007), bulk density (Ferrero et al, 2005; Alletto & Coquet, 2009) and soil water content (Libardi et al., 1996; Nebel et al., 2010). A better knowledge of the variability patterns of the preconsolidation pressure and its causes is needed to improve soil sampling methods for this soil property and to improve traffic planning in the area. The study of transects could show the spatially repetitious behavior of soil owing to cyclic tillage, traffic intensity and cropping patterns in plantations. The sequence of low and high topographical positions, giving rise to cyclic variation in, e.g., leaching intensity, has led to the development of soil map units to capture random variation within a landscape, owing to soil formation processes. The mapping units are spatially linked and represented with the coordinates of the soil surface (Nielsen et al., 1983). In view of the above expectations, it would seem advantageous to sample a field in a way that would allow the detection of cyclic irregularities in relation to the position and sequence of the soil samples.
In summary, the increasing interest in spatial behavior of soil compaction reinforces the need to quantify the spatial distribution of this property. The purpose of this study was to investigate the spatial behavior of preconsolidation pressure and soil water content in six selected transects: three along and three across coffee rows, at three different sampling points and under different tillage management systems.
MATERIALS AND METHODS
The study was carried out on a farm in Patrocinio, a county in the State of Minas Gerais, in Southeastern Brazil (18 º 59 ' 15 '' S; 46 º 56 ' 47 '' W; 934 m asl) with an average slope of 3 %. The climate was classified as Aw (Köppen). The mean annual temperature is 22 ºC and the mean annual precipitation about 1.370 mm, the winter is dry and summer rainy. There is a clearly defined rainy period in December, January and February with more than 50 % of the mean annual precipitation (Brasil, 1992). Coffee (Coffea arabica L) trees, in rows perpendicular to the slope, were planted in a typic dystrophic Red Latosol (Acrustox). Basic characterization of the farm soil is presented in table 1. Weeds under the crop canopy were chemically controlled before fertilization, while those growing between the crop row (between tracks) were eliminated using a combination of mowing and chemical control. Plant diseases were controlled once a month with an ARBUS 2000® sprayer with a mean weight of 2.60 Mg, when fully loaded. Topdressing fertilization was applied every 40 days in the rainy season, using a KOMANDER® fertilizer equipment, with a capacity of 4,00 Mg, using 6.50-16 tires inflated to 344.75 kPa pressure.
The disturbed soil samples scraped near the intact soil cores were collected, air-dried, sieved (2 mm) and subjected to particle-size-distribution analysis using the pipette method (Gee & Bauder, 1986), particle density by a pycnometer (Blake & Hartge, 1986b) and organic matter (Embrapa, 1997). Bulk density was determined as soil dry weight per unit volume of intact soil cores (Blake & Hartge, 1986a).
The total soil porosity (TSP) was estimated using the relationship between bulk density and particle density (Vomocil, 1965), according to the equation:

where Bd (Mg m-3) is bulk density and Pd is particle density (Mg m-3).
The pore size distribution was characterized from soil water retention, using the concept of equivalent diameter derived from a capillary model considering microporosity, pores with effective diameter < 50 μm (water retention at water suction 6 kPa) and macroporosity, pores with effective diameter > 50 μm (total porosity - microporosity).
Undisturbed soil samples were collected from the farm in January 2006, the rainiest period, the most critical for soil structure. The samples were taken at 0.10-0.13 m depth, from three different positions in the coffee plantation: (a) from under the wheel track, caused by equipment used in farm operations; (b) in - between tracks and (c) under the coffee canopy. Six linear transects were established in the experimental area: three transects along and three across the coffee rows (Figure 1). All soil samples were collected using an Uhland equipment. In the direction across the coffee rows, 161 samples were collected consisting of 46 samples under the canopy, 46 samples from between tracks and 69 samples from under the tracks. In the other direction, along the transects parallel to the coffee rows, 117 samples were collected from each position. The shortest distance between samples across rows was 4 m and along the rows 0.5 m.
The natural water content of the soil samples were preserved by using wax covering and used in the uniaxial compression test (Bowles, 1986). For these tests the undisturbed soil samples were maintained within the core cylinders, which were placed in the compression cell, using the consolidometer BOART LONGYEAR® and subsequently subjected to pressures of 25, 50, 100, 200, 400, 800, and 1600 kPa. Each pressure was applied until 90 % of the maximum deformation was reached and then the pressure was increased to the next level (Taylor, 1948). The stress vs strain data were then used to construct the soil compressibility curves, from which the preconsolidation pressures were calculated following the procedure of Dias Junior & Pierce (1995), according to the equation:

where a σ p is preconsolidation pressure; "U" is soil moisture, "a" and "b" are equation parameters.
On average, the management of the coffee plantation required 17 tractor passes per year in all rows. The traffic patterns for coffee management consisted of always the same tracks, running along the tree rows across the slope. A VALMET 785® (4 x 2) tractor with a mean weight of 2.95 Mg was used on the plantation, with 14.9-28 rear tires and a tire pressure of 124.11 kPa.
The data were first subjected to classical statistical analyses to obtain descriptive statistics for mean, range, standard deviation, and normality tests.
Variography was used to detect patterns of spatial correlation between sampling points and as an additional tool to identify periodic trends in the data. Unidirectional sample semivariograms were calculated for each transect. The semivariogram was calculated by taking all pairs of observations separated by a lag distance of h and averaging the square of their differences. This was done for all possible lag distances h, and the resulting function, γ (h), is then given by (Vieira et al., 1983):

where z(xi) is the value of variable z at sample location xi, and z(xi + h) is the value of variable z at a distance h from xi . There are n(h) pairs of sample locations that are a distance h away from each other. The semivariogram is then plotted with h on the x-axis (lag or distance) and γ (h) on the y-axis (semivariance). A random distribution of semivariances along the horizontal line suggests no spatial dependence among sampling positions. The intercept of the line with the ordinate axis defines the nugget semivariance, which represents random variability, measurement error, and spatially dependent variability with a range smaller than the minimum separation distance (Journel & Huijbregts, 1978). Semivariances were calculated by version 5.1 of the GS+ geostatistical package (Robertson, 1998), and at least 33 pairs of observations were used in the calculations.
RESULTS AND DISCUSSIONS
The distribution of preconsolidation pressure and soil moisture at all sampling points in the coffee plantation, as well as the distribution along and across the coffee rows, are shown in figure 2. A statistical summary of the properties for the two variables is given in table 2. The highest variability was found between tracks, for both variables (Table 2); and is evidenced by the scattered data distribution (Figure 2), despite the low CV values (Warrick & Nielsen, 1980). This observation may be attributed to the periodic disturbance of this site in past years caused by plowing. Considering that the preconsolidation pressure indicates the maximum applied pressure to the soil in the past (Dias Junior & Pierce, 1995), it was observed that σp values were highest in both directions at the track site, followed by the canopy and between tracks. Soil moisture was highest under the coffee canopy, which may be attributed to reduced evaporation from under the canopies due to limited exposure to sunshine of the soil surface.
Although the experimental semivariogram and the estimation procedures produced by geostatistics do not depend on the sample distribution type (Clark, 1979), the Shapiro-Wilk statistic (W) was computed for each complete dataset to test the normality of distribution (Shapiro & Wilk, 1965). The distribution of all datasets was normal for both soil properties, according to skewness and kurtosis values and the Shapiro-Wilk test, except in the case of σp under the tracks across the rows and soil moisture between tracks along rows. This way, normal and log-normal distributions are commonly assumed for soil physical properties (Warrick & Nielsen, 1980).
In general, the observed values were scattered around the mean along the transects apparently with no clear pattern. A more obvious periodic pattern was observed between tracks, for both directions and variables (Figure 2). This observation may be explained by the fact that this site is more sensitive to external factors and affected by subsoiling, as mentioned previously. In addition, the variability at this site is greater, as indicated by the high coefficient of variation (CV). It should be noted that there is an opposite pattern in the spatial distribution between σp and soil moisture, mainly in the direction along rows, as shown in the cross-semivariogram (Figure 3). This was expected because soil moisture is the major regulating factor of soil compaction behavior (Dias Junior & Pierce, 1995), therefore, when soil moisture is high, the soil bearing capacity is low.
The cross-semivariograms of the preconsolidation pressure and soil moisture at all studied sites and in both directions are shown in figure 3. Unlike semivariograms, cross-semivariograms can be negative. A negative cross-semivariograms indicates an inverse relation between the two variables. A visual inspection of the cross-semivariograms suggested a negative correlation between σp and soil moisture for most situations, i.e., an increase of soil moisture was related to a decrease in the preconsolidation pressure and vice versa. Therefore, when soil moisture is high, care must be taken with the traffic intensity, due to the lower soil bearing capacity and consequent higher possibility to damage the soil structure. This inverse relation was not clearly visible for all situations, mainly between tracks in the across-rows transect (Figure 2). Contrary to expectations, this behavior was not observed between tracks across rows and in the canopy along the rows. This can be explained by the narrow natural soil moisture interval used, which was too small to detect this variation.
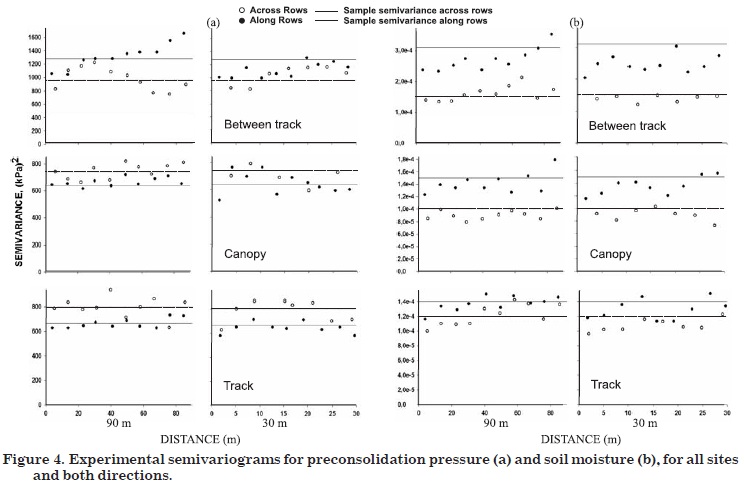
The nature of soil variability identified by spatial studies of soil properties depends largely on the scale of the observation (Trangmar et al., 1985). In this study, two scales of observation were used in the experimental semivariogram; 90 and 30 m (Figure 4). It is noteworthy that observations of 30 m show small-scale variations. The variability between tracks was high, as indicated by the high CV values. For soil moisture, variations along the row direction were high in samples from all studied positions. This observation was contrary to results of Mallarino (1996), who reported higher variability across than along rows; for σp, a higher spatial variation along rows was only verified between tracks. Normally, the semivariances showed low or no spatial variation, but a pure nugget effect. Spatial structures were better visualized using observations of 30 m (Figure 4). This fact may be explained by extrinsic variations, such as tillage, that control the variability of these weakly spatially dependent parameters (Cambardella et al., 1994). In some situations it is possible to observe periodicity in the semivariograms, called a "hole effect", which is an indicator of nonmonotonic growth of the semi-variance with distance (Journel & Huijbregts, 1978). The spatially repetitious behavior of soil observations is probably a result of cyclic tillage traffic and cropping patterns in plantations (Nielsen et al., 1983). The "hole effect" was more common in the direction across rows, so it may be a result of soil management. Normally a "hole effect" occurred in one predominant direction, except for soil moisture under the canopy, using observations of 30 m. This periodic effect is only present in a certain direction because of the periodicity of the soil processes, which is generally not isotropical (Trangmar et al., 1985). This result is not surprising because clusters of high and low values and periodic trends are evident for some transects (Figure 2).
CONCLUSIONS
1. No variations in the spatial patterns were detected based on preconsolidation pressure in the 200 m transect.
2. The semivariogram for both variables indicated a high nugget value and short range of the studied parameters in all transects. A cyclic pattern of the parameters was observed in the across - rows transect.
3. Based on the results of spatial distribution of natural soil moisture, an inverse relationship between preconsolidation pressure and soil moisture was clearly observed in the samples from under the tracks, in both directions.
ACKNOWLEDGEMENTS
The authors are thankful to CNPq (Conselho Nacional de Desenvolvimento Científico e Tecnolσgico) for research support, and to Dr. Donald Nielsen, of the University of California, for his constructive suggestions.
LITERATURE CITED
- AJAYI, A.E.; DIAS JUNIOR, M.S.; CURI, N.; OKUNOLA, A.; SOUZA, T.T.T. & PIRES, B.S. Assessment of vulnerability of Oxisols to compaction in the Cerrado region of Brazil. Pedosphere, 20:252-260, 2010.
- ALLETTO, L. & COQUET, Y. Temporal and spatial variability of soil bulk density and near-saturated hydraulic conductivity under two contrasted tillage management systems. Geoderma, 152:85-94, 2009.
- BLAKE, G.R. & HARTGE, K.H. Bulk density. In: KLUTE, A., ed. Methods of soil analysis: Physical and mineralogical methods. Madison, American Society of Agronomy, 1986a. p.363-376.
- BLAKE, G.R. & HARTGE, K.H. Particle density. In: KLUTE, A., ed. Methods of soil analysis: Physical and mineralogical methods. Madison, American Society of Agronomy, 1986b. p.377-382.
- BOWLES, J.E. Engineering properties of soils and their measurements. 3.ed. Auckland, McGraw-Hill, 1986. 218p.
- BRASIL. Ministério da Agricultura. Normas climatolσgicas. Brasília, 1992. 84p.
- CAMBARDELLA, C.A.; MOORMAN, T.B.; NOVAK, J.M.; PARKIN, T.B.; KARLEN, D.L.; TURCO, R.F. & KONOPKA, A.E. Field-scale variability of soil properties in central Iowa soils. Soil Sci. Soc Am. J., 58:1501-1511, 1994.
- CLARK, I. Practical geostatistics. London: Applied Science Publishers, 1979. 128p.
- DAVIDOFF, B. & SELIM, H.M. Correlation between spatially variable soil moisture content and soil temperature. Soil Sci., 145:1-10, 1988.
- DIAS JUNIOR, M.S. & PIERCE, F.J. A simple procedure for estimating preconsolidation pressure from soil compression curves. Soil Technol., 8:139-151, 1995.
- DIAS JUNIOR, M.S. & PIERCE, F.J. O processo de compactação do solo e sua modelagem. R. Bras. Ci. Solo, 20:175-182, 1996.
- EMPRESA BRASILEIRA DE PESQUISA AGROPECUÁRIA - EMBRAPA. Centro Nacional de Pesquisas de Solos. Manual de métodos de análise de solo. Rio de Janeiro, 1997. 212p.
- FERRERO, A.; USOWICZ, B. & LIPIEC, J. Effects of tractor traffic on spatial variability of soil strength and water content in grass covered and cultivated sloping vineyard. Soil Tillage Res., 84:127-138, 2005.
- GEE, G.W. & BAUDER, J.W. Particle-size analysis. In: KLUTE, A., ed. Methods of soil analysis. Part 1. Physical and mineralogical methods. 2.ed. Madison, American Society of Agronomy, Soil Science Society of America, 1986.
- GONTIJO, I.; DIAS JUNIOR, M.S.; OLIVEIRA, M.S.; ARAUJO JUNIOR, C.F.; PIRES, B.S. & OLIVEIRA, C.A. Planejamento amostral da pressão de preconsolidação de um Latossolo Vermelho distroférrico. R. Bras. Ci. Solo, 31:1245:1254, 2007.
- IMHOFF, S.; SILVA, A.P.; DIAS JUNIOR, M.S. & TORMENA, C.A. Quantifying critical pressures for plant growth. R. Bras. Ci. Solo, 25:11-18, 2001.
- JOURNEL, A.G. & HUIJBREGTS, C.J. Mining geostatistics. New York, Academic, 1978.
- KONDO, M.K. & DIAS JUNIOR, M.S. Soil compressibility of three Latosols (Oxisols) as a funciton of moisture and use. R. Bras. Ci. Solo, 23:211-218, 1999.
- LIBARDI, P.L.; MANFRON, P.A.; MORAES, S.O. & TUON, R.L. Gravimetric soil water content variability of a hydromorphic soil. R. Bras. Ci. Solo, 20:1-12, 1996.
- MALLARINO, A.P. Spatial variability patterns of phosphorus and potassium in no-tilled soils for two sampling scales. Soil Sci. Soc Am. J., 60:1473-1481, 1996.
- NEBEL, A.L.C.; TIMM, L.C.; CORNELIS, W.; GABRIELS, D.; REICHARDT, K.; AQUINO, L.S.; PAULETTO, E.A. & REINERT, D.J. Pedotransfer functions related to spatial variability of water retention attributes for lowland soils. R. Bras. Ci. Solo, 34:669-680, 2010.
- NIELSEN, D.R.; TILLOTSON, P.M. & VIEIRA, S.R. Analyzing field measured soil water properties. Agric. Water Manag., 6:93-109, 1983.
- ROBERTSON, G.P. GS: Geostatistics for the environmental sciences (version 5.1 for windows). Plainwell, Gamma Design Software, 1998. 152p.
- SHAPIRO, S.S. & WILK, M.B. An analysis of variance test for normality. Biometrika, 52:591-611, 1965.
- SILVA, A.P.; IMHOFF, S. & CORSI, M. Evaluation of soil compaction in irrigated short-duration grazing system. Soil Tillage Res., 70:83-90, 2003.
- TAYLOR, D.W. Fundamentals of soil mechanics. New York, John Wiley & Sons, 1948. 700p.
- TRANGMAR, B.B.; YOST, R.S. & UEHARA, G. Application of geostatistics to spatial studies of soil properties. Adv. Agron., 38:45-93, 1985.
- UTSET, A. & CID, G. Soil penetrometer resistance spatial variability in a Ferrasol at several soil moisture conditions. Soil Tillage Res., 61:193-202, 2001.
- VIEIRA, S.R.; HATFIELD, J.L.; NIELSEN, D.R. & BIGGAR, J.W. Geostatistical theory and application to variability of some agronomical properties. Hilgardia, 51:1-75, 1983.
- VOMOCIL, J.A. Porosity. In: BLAKE, C.A., ed. Methods of soil analysis. Madison, American Society of Agronomy, 1965. p.299-314.
- WARRICK, A.W. & NIELSEN, D.R. Spatial variability of soil physical properties in the field. In: HILLEL, D., ed. Applications of soil physics. New York, Academic Press, 1980. p.319-344.
Publication Dates
-
Publication in this collection
21 Oct 2011 -
Date of issue
Aug 2011
History
-
Received
12 May 2010 -
Accepted
11 May 2011