Abstracts
The plant-available water capacity of the soil is defined as the water content between field capacity and wilting point, and has wide practical application in planning the land use. In a representative profile of the Cerrado Oxisol, methods for estimating the wilting point were studied and compared, using a WP4-T psychrometer and Richards chamber for undisturbed and disturbed samples. In addition, the field capacity was estimated by the water content at 6, 10, 33 kPa and by the inflection point of the water retention curve, calculated by the van Genuchten and cubic polynomial models. We found that the field capacity moisture determined at the inflection point was higher than by the other methods, and that even at the inflection point the estimates differed, according to the model used. By the WP4-T psychrometer, the water content was significantly lower found the estimate of the permanent wilting point. We concluded that the estimation of the available water holding capacity is markedly influenced by the estimation methods, which has to be taken into consideration because of the practical importance of this parameter.
field capacity; permanent wilting point; soil water retention curve modeling; Oxisol; land use planning
A capacidade de água disponível no solo para as plantas é definida como o conteúdo de água entre a capacidade de campo e o ponto de murcha permanente e tem vasta aplicação prática no planejamento do uso da terra. Em um perfil de Latossolo representativo da região do Cerrado, objetivaram-se estudar e comparar métodos de estimativa para o ponto de murcha permanente, empregando os aparelhos de psicrômetro WP4-T e a câmara de Richards, utilizando amostras com e sem preservação da estrutura, bem como para a capacidade de campo, estimando-a pela umidade do solo submetido às tensões 6, 10 e 33 kPa, e pelo ponto de inflexão da curva de retenção de água calculado nos modelos de van Genuchten e polinomial cúbico. Verificou-se que para o Latossolo em estudo a capacidade de campo determinada no ponto de inflexão apresenta maior valor de umidade em comparação aos demais métodos e que mesmo nesse ponto são encontradas diferenças na estimativa em razão do modelo utilizado. Pelo psicrômetro WP4-T, valores significativamente menores de umidade foram encontrados para a estimativa do ponto de murcha permanente. Concluiu-se que a capacidade de água disponível foi influenciada marcantemente pelo método utilizado na estimativa da capacidade de campo e do ponto de murcha permanente, o que precisa ser considerado em virtude da importância prática desse parâmetro.
capacidade de campo; ponto de murcha permanente; modelagem da curva de retenção de água do solo; Latossolo; planejamento de uso terra
DIVISÃO 2 - PROCESSOS E PROPRIEDADES DO SOLO
COMISSÃO 2.2 - FÍSICA DO SOLO
Plant-available soil water capacity: estimation methods and implications1 1 Part of Doctoral Thesis of the first author. Funded by CNPq and FAPEMIG. Received for publication on May 28, 2013 and approved on December 3, 2013.
Capacidade de água disponível no solo para as plantas: métodos de estimativa e implicações
Bruno Montoani SilvaI; Érika Andressa da SilvaII; Geraldo César de OliveiraIII; Mozart Martins FerreiraIV; Milson Evaldo SerafimV
ISubstitute Professor, Soil Science Department, Federal University of Lavras - DCS-UFLA. Caixa Postal 3037. CEP 37200-000 Lavras (MG), Brazil. CNPq fellowship. E-mail: brunom@dcs.ufla.br
IIMaster student, DCS-UFLA. CNPq fellowship. E-mail: andressa_erika@hotmail.com
IIIAssociate Professor, DCS-UFLA. CNPq fellowship. E-mail: geraldooliveira@dcs.ufla.br
IVFull Professor, DCS-UFLA. E-mail: mozartmf@dcs.ufla.br
VProfessor, Instituto Federal de Educação, Ciência e Tecnologia de Mato Grosso. Av. dos Ramires, s/n, Bairro Distrito Industrial. CEP 78.200-000 Cáceres (MT), Brazil. E-mail: milson.serafim@cas.ifmt.edu.br
SUMMARY
The plant-available water capacity of the soil is defined as the water content between field capacity and wilting point, and has wide practical application in planning the land use. In a representative profile of the Cerrado Oxisol, methods for estimating the wilting point were studied and compared, using a WP4-T psychrometer and Richards chamber for undisturbed and disturbed samples. In addition, the field capacity was estimated by the water content at 6, 10, 33 kPa and by the inflection point of the water retention curve, calculated by the van Genuchten and cubic polynomial models. We found that the field capacity moisture determined at the inflection point was higher than by the other methods, and that even at the inflection point the estimates differed, according to the model used. By the WP4-T psychrometer, the water content was significantly lower found the estimate of the permanent wilting point. We concluded that the estimation of the available water holding capacity is markedly influenced by the estimation methods, which has to be taken into consideration because of the practical importance of this parameter.
Index terms: field capacity, permanent wilting point, soil water retention curve modeling, Oxisol, land use planning.
RESUMO
A capacidade de água disponível no solo para as plantas é definida como o conteúdo de água entre a capacidade de campo e o ponto de murcha permanente e tem vasta aplicação prática no planejamento do uso da terra. Em um perfil de Latossolo representativo da região do Cerrado, objetivaram-se estudar e comparar métodos de estimativa para o ponto de murcha permanente, empregando os aparelhos de psicrômetro WP4-T e a câmara de Richards, utilizando amostras com e sem preservação da estrutura, bem como para a capacidade de campo, estimando-a pela umidade do solo submetido às tensões 6, 10 e 33 kPa, e pelo ponto de inflexão da curva de retenção de água calculado nos modelos de van Genuchten e polinomial cúbico. Verificou-se que para o Latossolo em estudo a capacidade de campo determinada no ponto de inflexão apresenta maior valor de umidade em comparação aos demais métodos e que mesmo nesse ponto são encontradas diferenças na estimativa em razão do modelo utilizado. Pelo psicrômetro WP4-T, valores significativamente menores de umidade foram encontrados para a estimativa do ponto de murcha permanente. Concluiu-se que a capacidade de água disponível foi influenciada marcantemente pelo método utilizado na estimativa da capacidade de campo e do ponto de murcha permanente, o que precisa ser considerado em virtude da importância prática desse parâmetro.
Termos de indexação: capacidade de campo, ponto de murcha permanente, modelagem da curva de retenção de água do solo, Latossolo, planejamento de uso terra.
INTRODUCTION
The classical approach to the concept of plant-available water capacity (AWC) of the soil was proposed by Veihmeyer & Hendrickson (1927; 1931; 1949) defining it as the soil water content between an upper limit, termed field capacity (FC), and a lower limit or the permanent wilting point (PWP). The AWC indicates the capacity of a soil to store and release water that is available to roots. Despite not considering the dynamics of the soil-water-plant-environment interrelationships (Reichardt, 1988; Carlesso, 1995; van Lier, 2000), this concept has a recognized practical importance for water balance, soil drought, definition of planting times, agricultural zoning, and particularly in irrigation projects, which makes AWC a parameter of great importance in planning land use. The AWC can be understood as a soil property that indicates the duration and intensity of water deficit, with the advantage of depending mainly on the water use rate and soil physical properties (Ritchie et al., 1972; Carlesso, 1995).
The PWP refers to the water content in the soil under high soil retention where the plants wither and do not recover turgidity even in a humid atmosphere (Briggs & Shantz, 1912; Veihmeyer & Hendrickson, 1949). Therefore, the PWP varies according to the species, developmental stage, climate, and soil conditions (Carlesso, 1995; Romano & Santini, 2002). It can be directly determined by the physiological method proposed by Briggs & Shantz (1912). However, for being more laborious and time consuming, the PWP was determined in the laboratory by estimating the soil water content retained at 1500 kPa (Romano & Santini, 2002; Reichardt & Timm, 2004), normally in a Richards chamber.
As several studies showed differences between the PWP obtained by the physiological method and the estimation in the Richards chamber at 1500 kPa (Cirino & Guerra, 1994; Souza et al., 2002; Klein et al., 2006), the thermocouple psychrometer (WP4) has recently been more widely used to estimate PWP, for the possibility of obtaining soil moisture at 1500 kPa (Costa et al., 2008; Kaiser et al., 2009; Klein et al., 2006, 2010; Lima et al., 2012). Descriptions of the process are given by Decagon Devices (2000) and Scanlon (2002). Studies showed that PWP estimated by WP4 is closer to that determined by the physiological method than to the estimate in a Richards chamber (Klein et al., 2006), reflecting a better AWC estimate by the WP4 and physiological method than by the Richards chamber.
The FC is the amount of water retained in the soil after saturation and drainage of the excess water, reaching a minimum rate of downward movement (Veihmeyer & Hendrickson, 1931; 1949; Reichardt & Timm, 2004). Some practical difficulties hamper FC determination in the field, such as setting an acceptable minimum drainage amount, lateral losses caused by horizontal flow, aside from being laborious and time consuming (Reichardt, 1988; van Lier, 2000). One of the indirect methods to estimate FC is the analysis of soil samples with disturbed and undisturbed structure in the laboratory, to define a water tension corresponding to moisture at field capacity (hcc) determined in the field. In Brazil, tensions of 6, 10 and 33 kPa have been commonly attributed to the estimate of moisture at field capacity for clay soils (Ferreira & Marcos, 1983; Bernardo, 1987; Reichardt, 1988; Silva et al., 1994; Mello et al., 2002; Souza et al., 2002; Ruiz et al., 2003; Araújo et al., 2004; Klein et al., 2006).
Andrade & Stone (2011) estimated the water tension corresponding to moisture at field capacity between 6.5 and 7.5 kPa for Cerrado soils, using 2,242 soil samples. These authors used an equation based on the soil water retention curve (SWRC) with weighting by water conductivity and correlations with data of hydro-physical properties, soil texture and organic matter. It is noteworthy that properties associated with soil structure, such as porosity, bulk density and aggregate stability (Centurion & Andrioli, 2000; Fabian & Ottoni Filho, 2000) were significantly correlated with lower water tensions associated to FC, but correlations between soil density and PWP (Centurion & Andrioli, 2000) were also observed.
Ferreira & Marcos (1983) first proposed moisture in the FC as the water content corresponding to the tension obtained at the inflection point of the soil water retention curve calculated mathematically by cubic splines, obtaining significant correlations with FC determined in the field. Dexter & Bird (2001) also used the tension at the inflection point of the water retention curve adjusted by the van Genuchten (1980) model, but associating the corresponding moisture as being the optimum for soil tillage.
Subsequently, Mello et al. (2002) used the inflection point to calculate FC from the cubic polynomial model obtained by regression, and in this study, the inflection point values found for Oxisols were close to a tension of 6 kPa. The inflection point of the SWRC marks the change in the size of the predominant pores, increasing the proportion of smaller diameter pores at tensions above the inflection point (Dexter, 2004), which justifies a conceptual attribution of FC to the inflection point rather than to the empirical tensions.
In the Cerrado region, Oxisols, which cover more than 50 % of the territory of the biome, are the most commonly used soil class for rainfed as well as irrigated agricultural crops (Lopes, 1983). In function of the granular macrostructure developed due to the gibbsitic mineralogy (Ferreira et al., 1999a), clay Oxisols contain a high amount of macropores, but also micropores (<0.05 mm diameter) (Ferreira et al., 1999b), which may influence the AWC, in view of the importance of capillarity as one of the water retention mechanisms.
In a study of Cerrado Oxisols, Lopes (1983) determined the AWC by the difference between the moisture retained at 10 and 1500 kPa, using sieved samples. Based on these studies, Reichardt (1985) estimated the storage potential of clayey soils at 10.3 mm water/10 cm soil, which, according to the classifications of Ranzani (1971) and White (2006), indicates low water retention in the plant-available water content range - AWC.
In view of the importance of structure for soil water retention, as shown, and of the discrepancies in the estimates of FC and PWP based on the different criteria and estimation methods, aside from the recent emergence of new determination equipment and, above all, the practical importance of the AWC variable, the purpose of this study was to: verify the difference in FC in a very clayey gibbsitic Cerrado Oxisol at moisture corresponding to tensions 6, 10 and 33 kPa are adopted for estimation and when adopting the inflection point of the SWRC; compare determination methods of the inflection point, by the cubic polynomial model and the van Genuchten equation; verify the effect of using undisturbed and disturbed samples to estimate PWP; compare PWP estimates using Richards chamber and WP4; and discuss some practical implications of each method for AWC estimation.
MATERIAL AND METHODS
A typical soil of the Cerrado region was collected in São Roque de Minas, in the physiographic region of the Upper São Francisco, Minas Gerais (UTM coordinates SAD69 23 K 0363823 and 7758625; at 848 m asl). The topography of the region is gently undulating, the soil is classified as a typical Red Latossol, very clayey gibbsitic-oxidic, according to Embrapa (2006), originated from pelitic rock, as characterized by Silva et al. (2012a), corresponding to an Anionic Acrustox.
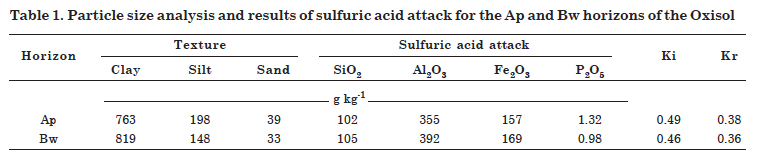
The results of particle size analysis and sulfuric acid attack are shown in table 1. The Ki and Kr index values below 0.75 are noteworthy, for indicating advanced weathering of the studied Oxisol. The study area was under coffee since 2008, and previously covered with grassland (Silva et al., 2012a).
Samples with undisturbed structure were collected in volumetric rings from three trenches at depths of 20, 40, 60, and 80 cm. The soil profile was opened to this depth in view of the potential use of this soil for perennial crops with a deep root system, and due to the intense surface drying for over six months in the Cerrado region; knowledge about the physical properties of subsurface water layers is therefore required to guide the management of the plant root system under these conditions. The soil samples were saturated and then subjected to tensions of 2, 4, 6 and 10 kPa in suction units (Büchner funnels), and to tensions of 33, 100, 500 and 1500 kPa in Richards extraction chambers. After equilibrium of the samples at the respective tensions, they were dried in an oven at 105 oC to constant dry mass. The gravimetric moisture (g g-1) and soil bulk density (kg dm-3) (Embrapa, 1997) were calculated and subsequently the volumetric water content (q) corresponding to each potential.
In order to determine the effect of the soil structure on water retention at 1500 kPa, deformed samples were subjected to this tension. After this procedure, all samples were also used to determine the corresponding moisture at 1500 kPa tension in the thermocouple psychrometer apparatus Dewpoint Potential Meter WP4-T (Decagon Devices, 2000), according to the method described by Klein et al. (2006), and from the bulk density of each sample the corresponding q was calculated.
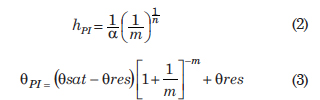
With the q data obtained for samples with undisturbed structure, water retention curves (SWRC) for each replication of each sampled soil depth were adjusted. The adjustments were based on two distinct models. First, by the van Genuchten (1980) model, described in equation 1 with the Mualen restriction [m=1-(1/n)], by means of software RETC (van Genuchten et al., 1991), calculating the modulus of the potential at the inflection point of the SWRC (hIP) and the corresponding water content (qIP), as described by Dexter & Bird (2001), presented in equations 2 and 3.

in which q is the soil water content (cm3 cm-3); h is the modulus of the potential or the soil water tension (kPa); qsat is the water content of the saturated sample (cm3 cm-3); qres the water content (cm3 cm-3) at 1500 kPa tension, and m, n, a are the adjustment parameters of the model.
Subsequently, the cubic polynomial model, between q and the logarithm of matric potential in cm H2O (pF), for calculating hIP and qIP as proposed by Mello et al. (2002), as shown in equations 4, 5, 6 and 7:

Equating equation 6 to zero, we have the water content at the inflection point:

in which h = the matric potential modulus, log h = logarithm of matric potential; qIP = water content corresponding to the inflection; a, b, c and d are adjustment parameters.
Soil moisture (q) at field capacity (FC) was obtained by five estimation methods for comparative purposes: at 6 kPa (FC6), 10 kPa (FC10), and 33 kPa (FC33), corresponding to hIP obtained in the van Genuchten model (FCIPvg); and that corresponding to hIP obtained in the cubic polynomial model (FCIPcp). The soil moisture at the permanent wilting point (PWP), also for comparative purposes, was obtained by three estimation methods: at 1500 kPa obtained in samples with undisturbed structure in a Richards chamber (PWPURC), 1500 kPa obtained in a disturbed sample in a Richards chamber (PWPDRC) and at 1500 kPa obtained in a disturbed sample by WP4 (PWPWP4). The plant-available water capacity (AWC) of soil was calculated by the difference between FC and PWP obtained by combinations of methods of estimating these limits, expressed in m3 m-3, the most appropriate form to allow the calculation of AWC for the soil depth explored by roots at each stage of crop development (Reichert et al., 2011).
The experimental design was completely randomized (CRD). For analysis of variance and mean comparison by the Scott Knott test at 5 % probability the SISVAR package was used (Ferreira, 2011). Normality of data distribution was tested by the Shapiro-Wilk and homogeneity of variances by the Bartlett test. For the variables FC and PWP, we used a double factorial scheme, for the factors estimation methods and sampling depth. For the variable AWC we used a double factorial design, with the factors PWP estimation methods and FC estimation methods, for each depth.
RESULTS AND DISCUSSION
For the water content at PWP there was significant interaction between the factors estimation methods and sampled depth, as shown by the partitioning of the two factors (Table 2). Probably this interaction occurred because samples with disturbed and undisturbed structure were used to estimate PWP. Along this line, the PWP value was highest when using undisturbed soil samples at a depth of 20 cm (Table 2). At this depth, Silva et al. (2012b) observed a higher density, reduced macroporosity, lower total porosity and higher microporosity compared to the subsurface layers (40, 60 and 80 cm), indicating that the structural differences of that layer were detected by using samples with undisturbed structure, which could have contributed to the higher water retention.
It was found that, independent of the depth, the use of the thermocouple psychrometer (WP4) method to determine PWP resulted in lower water content for the 1500 kPa tension (Table 2). These results were corroborated by Klein et al. (2010), who detected lower amounts of moisture using WP4 in the pedotransfer model for PWP in function of texture than Arruda (1987) and Bell & van Keulen (1995), who used the Richards chamber.
Aside from the fact that Klein et al. (2006) had found a lower water content at PWP with this method, the authors evaluated the physiological method of determining PWP, and found the best PWP estimate by WP4, since there was no statistical difference in the measurement of PWP by the physiological method. This reinforces the importance of the choice of the PWP estimation method, and as can be seen from the results of this work and of Klein et al. (2006; 2010) for a clayey Oxisol from southern Brazil, WP4 provided the lowest results of water content at PWP, with implications for AWC estimation, as well as other applications of the parameter. As an example, in irrigation projects, one of the most common ways to define the quantity of irrigation water is associated with the calculation of readily available water or actual water depth (Silva et al., 2011). Therefore, the AWC is weighted by a factor of water availability or of water depletion (f), determined for the crop in question (Doorenbos & Kassan, 1994), and which can be obtained experimentally by the expression f = (qi - qPWP)/(qFC - qPWP), where qi is the critical moisture for irrigation, obtained on the basis of the target crop yield. Thus, it can be verified that changes in the amount of moisture at PWP, as the lowest values found when estimated by WP4, has a direct impact on the applied water level, increasing it, which could result in increased productivity, when the water requirement of the crop is met.
The difference between methods may have been influenced by several factors, highlighting that the Richards chambers may present problems due to lack of perfect contact between the soil sample and the porous plate (Klein et al., 2010). Several samples are allocated on the plate and if they are very heterogeneous, there is a possibility that not all will reach equilibrium at the same time, when the samples are removed from the chamber. The comparison of results using WP4 and the Richards chamber with disturbed samples is useful because it eliminates the porosity configuration effect, since the higher water content observed in the Richards chamber could have occurred in function of the soil water extraction having been incomplete, not reaching equilibrium (Gee et al, 2002;. Klein et al., 2006), due to the conductivity of the water being very low at this potential (Angelotti Netto & Fernandes, 2005).
The soil water retention curves at the depths evaluated, obtained by the van Genuchten (1980) model, are shown in Figure 1. The steep slope of the curve indicates a sharp decrease in water content due to the intrinsic characteristics of these soils, which have granular structure and two distinct pore classes, one formed by macropores, which lose water easily at low tensions, and the other by micropores, able to strongly retain water (Ferreira et al., 1999b).
The inflection point (IP) of the curve, which marks the division between the two distinct pores classes, has a greater upward displacement (Figure 1) and hence assumes a higher tension value at shallower depths, 20 and 40 cm (Table 3), which are most affected by tillage and influenced by the transition of pedogenic horizons, as detected by the physical properties related to porosity by Silva et al. (2012b).
At the depths of 60 and 80 cm, water retention was greater at lower tensions and higher moisture values at saturation (Table 3), a fact associated with lower tension values and consequent higher moisture at the inflection point regarding the two upper layers.
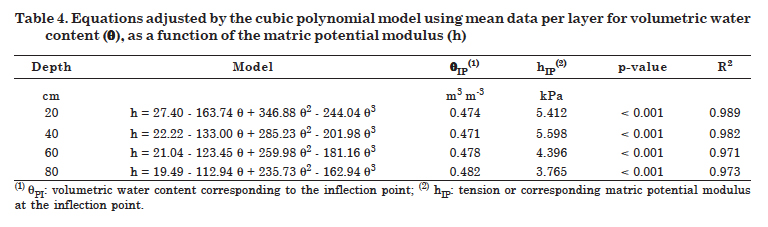
As with the models of van Genuchten (1980), the models obtained by the cubic polynomial regression (Figure 2) suggested by Mello et al. (2002) to calculate the inflection point, presented good adjustment evaluated by the R² index (Table 4), and despite showing a steeper angle than the van Genuchten (1980) model, it showed the same trend for the tension at the inflection point for each depth. It is noteworthy that the tension values corresponding to the inflection point in both models were lower than 6 kPa, a tension assigned to field capacity for Oxisol values in some studies (Oliveira et al., 2004). Mello et al. (2002) and Ferreira & Marcos (1983) also found tension values corresponding to the inflection point of less than 6 kPa when evaluating different Oxisols. This behavior may be due to the high porosity of these soils, due to their granular structure type, with high macroporosity and even a high amount of micropores, responsible for water retention in the soil at field capacity.
In table 5 the estimated FC in function of the method and evaluated depth is displayed. These two factors interacted significantly (p<0.01). In general there was statistical difference between the estimation methods for the depths, establishing an order of decreasing amount of moisture in the FC: FCIPvg> FCIPcp> FC6> FC10> FC33. This shows that the choice of estimation method has an impact on the estimated moisture and can therefore not be arbitrary. Accordingly, we highlight the importance of the method based on the inflection point of the soil water retention curve, since it is more flexible with respect to reflecting the pore configuration and size distribution of the material evaluated, since the inflection point marks change in the predominant size of the pores (Ferreira & Marcos, 1983; Dexter, 2004), with changes in the soil profile, either by its genesis or its management.
Mello et al. (2002) analyzed field-determined data in the literature for FC for Oxisols and compared them with an estimated FC at 6 kPa and the FCIPcp and concluded that the FCIPcp values were closer to those obtained in the field, which highlights the importance of the use of more flexible estimation methods. As for the higher values obtained by FCIPvg, we emphasize the importance of future comparisons with results determined in field, to confirm whether there is an overestimation or if the estimate is accurate. In experiments of irrigation management in Oxisols, higher values of water content corresponding to field capacity were chosen, as in the case of Dardengo et al. (2010), who found an increased growth rate in coffee when, for irrigation management, the moisture at field capacity was estimated at 10 kPa compared with 33 kPa in a Red-Yellow Latosol, i.e., 33 kPa underestimated the upper limit of soil water availability for coffee for those conditions.
For FCIPvg, as well as FCIPcp, there was no statistical difference for q at field capacity at the studied soil depths (Table 5). This shows that these methods for estimating FC promoted no differentiation of FC in the profile, which can be explained by the natural homogeneity of this highly weathered soil profile, resulting in a reduced sampling effort in the deeper layers for the purpose of irrigation management.
To detect the influence of the FC and PWP estimation methods on the AWC, a factor analysis was conducted, by each studied soil depths, to detect the interaction between the two factors. This interaction did not occur and therefore the breakdown of the factor FC estimation methods is shown in table 6. Table 7 shows the breakdown for PWP estimation methods.
At all depths evaluated, the AWC values were highest when the FC was estimated by water content at the soil water retention curve inflection point (Table 6), following the sequence: FCIPvg> FCIPcp> FC6> FC10> FC33. These results show that the choice of the FC estimation method may result in a variation of 366 % in the AWC.
The AWC was also influenced by the PWP estimation method (Table 7), and when PWP is estimated by the thermocouple psychrometer (WP4-T), it results in higher AWC values at all soil depths. At a depth of 20 cm, the AWC by PWPWP4 was 183 % higher than by PWPURC. As there were large differences between the WP4-T and Richards chamber at all depths, it is evident that these differences are not related to the management, but to the laboratory equipment and method.
When using the FCIPvg and PWPWP4 as an estimate of the water availability limits, an AWC of 41.2 mm/10 cm is obtained (Table 8), much higher than by FC6 and FC10 methods using PWPURC as the lower limit; these estimates are the most commonly used in the literature (Silva et al., 1994; Souza et al., 2002; Araújo et al., 2004; Klein et al., 2006; Andrade & Stone, 2011). Lopes (1983) determined the AWC by the difference between the moisture retained at 10 and 1500 kPa, using disturbed samples of soil under Cerrado, and Reichardt (1985), based on that data, estimated the water storage potential in clayey soils at 10.3 mm/10 cm. By table 8 there is an AWC of 13.1 mm/10 cm when using FC10 and PWPDRC, allowing to infer that the difference with respect to the value of 10.3 mm/10 cm can be, among others, allocated to use of samples with undisturbed structure in determining the FC. Since the structure pore arrangement provide the capillarity and in such soils there are high amounts of macro and micropores (Ferreira et al., 1999b), the greater water retention found when using samples with undisturbed structure may be associated with the pore arrangement.
Using the AWC value of 10.3 mm/10 cm (Lopes, 1983; Reichardt, 1985) the water retention in the very clayey (more than 60 % clay) Oxisols of the Cerrado region was classified as low in the plant availability water range, according to the classifications of Ranzani (1971) and White (2006). According to table 8, the soil in this study is no exception to the rule when the estimated field capacity is based on a 10 kPa tension (FC10) and principally 33 kPa (FC33), and the wilting point is obtained in the Richards chambers (PWPURC or PWPDRC). However, with the use of WP4-T in estimating PWP, similarly to when using the FC6 or IP in the FC estimation, substantially higher AWC values are achieved, changing the classification of these Oxisols regarding water retention. These findings are of great importance to clarify that the methods for estimating AWC can result in very different interpretations of the plant-available water holding capacity, reflecting on practical applications, particularly when the value of AWC 0.20 m3 m-3 or 20 mm water/10 cm soil were considered as optimal for maximum growth rate and functionality of plant roots in fine-textured soils (Reynolds et al., 2008).
One of the practical applications of AWC is in agroclimatic zoning, through the water balance (WB), in which in order to define the suitability of soils, it is necessary to determine the AWC and effective root depth (z) of the crop in question (Reichert et al., 2011), defining the maximum available water capacity of the soil, defined as AWCWB = (FC-PWP) * z (Pereira et al., 1997).
It is noteworthy that based on these agroclimatic zonings, huge areas located in the northwest, north, northeast and east of Minas Gerais regions were classified as unsuitable for coffee cultivation, due to the annual water deficit of over 150 mm, by agricultural zoning based on an AWCWB value of 125 mm (Sediyama et al., 2001), i.e., the same AWCWB as used in the zoning for the State of São Paulo (Pinto et al., 2001), which is widely used for credit and regional agricultural insurance purposes.
However, recent water balance studies have adopted variable AWCWB values, according to the phenological stage of a crop, which alters the effective rooting depth (z) and also the fraction of plant-available water in the soil (Souza & Frizzone, 2007; Araújo et al., 2011). In the physiographic region of the Upper São Francisco River in Minas Gerais, Serafim et al. (2011) compared a conservation and intensive management system of coffee cultivation, and found that when considering the root system depth in the water availability calculation, the region can be classified as suitable for coffee cultivation without irrigation, reaffirming the importance of determining the AWC to a depth of 80 cm. Thus, this study is highly important to draw attention to the fact that, in addition to innovations in the calculation of water balance variables adopting AWC values, we must consider the methods used to obtain the FC and PWP estimates, which can substantially change the AWCWB, and consequently, the annual water deficit, resulting in the possibility of reclassification of area suitability at a local level. Simulating an AWCWB of 25 mm instead of 100 mm for agroclimatic zoning in Lages, Santa Catarina, Cardoso et al. (2003) found that the probability of dry spells increased from very low to high, with significant magnitude, justifying the adoption of irrigation in this AWCWB of 25 mm situation.
Considering a certain homogeneity of soil properties in the deeper layers and an AWC of 11.1 mm/10 cm for clay soils of the Cerrado, Reichardt (1985) estimated the maximum storage of available water in deeper layers and residual storage of available water after n days without rain and irrigation. Considering an average evapotranspiration of 6 mm d-1, the author estimated that after 14 days without rain, no water would be available to plants in the 0-80 cm soil layer.
Silva (2012) studied a very clayey Oxisol in the same coffee plantation as in this study in São Roque de Minas, Minas Gerais, a region considered marginal for coffee cultivation due to the water deficiency. By conventional methods to determine the AWC, when measuring soil moisture with a probe to a depth of 100 cm, this author found that no water was available to plants in only the top 25 cm of a soil at the end of a dry spell of 15 days. The estimated AWC was 19 mm/10 cm (Silva, 2012), calculated from the PWP estimate by the Richards chamber at 1500 kPa and FC at 6 kPa. According to the method of Reichardt (1985), for an AWC of 19 mm/10 cm, it would be expected that no water would be available to a depth of 40 cm (Table 9). It was therefore inferred that the evapotranspiration of 6 mm was overestimated by the author, or more likely, that the AWC of 19 mm/10 cm was underestimated, since the drought occurred in a layer 1.6 fold smaller.
In order to examine possibilities, we used an AWC value of 41.2 mm/10 cm for this soil, calculated from FCIPvg and PWPWP4D. Using the same evapotranspiration value (6 mm d-1), after 15 days of drought, the soil dried to a depth of 20 cm (Table 10), therefore suggesting that the choice of methods for estimating the AWC limits is critical. This finding was confirmed by Serafim et al. (2013) who reported year-round water availability for coffee to a depth of 120 cm, probably due to the higher AWC value when determined by conventional methods.
It is important to highlight that the AWC can indicate a high capacity of the evaluated soil to provide available water to plants, based on estimation methods involving the inflection point of the water retention curve for FC and PWP for WP4 (Table 8). But it is worth remembering that the Oxisols of the Cerrado region are fast-drying, due to the bimodal pore distribution (Carducci et al., 2011; 2013) (Figures 1 and 2) and shown by the slope of the water retention curves, represented by the "n" parameter of the van Genuchten (1980) model. Thus, it should be noted that water release in the availability range, between FC and PWP, for the same AWC value, may differ among soils or layers of a same soil, depending on the hydraulic conductivity. Thus soils with the same AWC can release water at different rates and have different capacities to supply the crop water demand.
CONCLUSIONS
1. The estimated field capacity varies depending on the method, observing a descending order of moisture levels in FC: FCIPvg> FCIPcp> FC6> FC10> FC33.
2. By the water retention curve obtained by the cubic polynomial model, lower moisture values were obtained at the inflection point than by the van Genuchten (1980) model, showing that the chosen model interferes with the FC estimate.
3. The high moisture value at PWP when using a sample with undisturbed structure from a depth of 20 cm was attributed to structural differences measured in that layer, since in the other layers this was not observed.
4. Lower moisture values were found for PWP when WP4-T instead of the Richards chamber was used for estimation, resulting in the estimation of a substantially higher AWC.
5. Depending on the estimation methods, the AWC can vary markedly, which should be closely observed, since this soil hydro-physical parameter, despite limited for not considering the dynamics of the soil-plant-atmosphere system, is still widely applicable, e.g., in agroclimatic crop zoning.
ACKNOWLEDGEMENTS
The authors thank the National Council for Scientific and Technological Development (CNPq) and the Research Foundation of the State of Minas Gerais (FAPEMIG) for funding the study, and the Soil Science Department of the Federal University of Lavras (DCS-UFLA) for the infrastructure and support.
LITERATURE CITED
- ANDRADE, R.S. & STONE, L.F. Estimativa da umidade na capacidade de campo em solos sob Cerrado. R. Bras. Eng. Agríc. Amb., 15:111-116, 2011.
- ANGELOTTI NETTO, A. & FERNANDES, E.J. Condutividade hidráulica de um Latossolo Vermelho em pousio e cultivo intensivo. Pesq. Agropec. Bras., 40:797-802, 2005.
- ARAÚJO, M.A.; SOUZA, J.L.M. & TSUKAHARA, R.Y. Modelos agro-meteorológicos na estimativa da produtividade da cultura da soja na região de Ponta Grossa, Estado do Paraná. Acta Sci. Agron., 33:23-31, 2011.
- ARAÚJO, M.A.; TORMENA, C.A. & SILVA, A.P. Propriedades físicas de um Latossolo Vermelho distrófico cultivado e sob mata nativa. R. Bras. Ci. Solo, 28:337-345, 2004.
- ARRUDA, F.B. Parâmetros de solo para o cálculo da água disponível com base na textura do solo. R. Bras. Ci. Solo, 11:11-15, 1987.
- BELL, M.A. & van KEULEN, A. Soil pedotransfer functions for four Mexican soils. Soil Sci. Soc. Am. J., 59:865-871, 1995.
- BERNARDO, S. Manual de irrigação. 4.ed. Viçosa, MG, Universidade Federal de Viçosa, 1987. 611p.
- BRIGGS, L.J. & SHANTZ, H.L. The wilting coefficient for different plants and its indirect determination. Washington, USDA, 1912. 83p. (Boletim, 230)
- CARDOSO, C.O.; ULLMANN, M.N. & EBERHARDT, E.L. Balanço hídrico agro-climático para Lages-SC. R. Ci. Agrovet., 2:118-130, 2003.
- CARDUCCI, C.E.; OLIVEIRA, G.C.; SEVERIANO, E.C. & ZEVIANI, W.M. Modelagem da curva de retenção de água de Latossolos utilizando a equação duplo van Genuchten. R. Bras. Ci. Solo, 35:77-86, 2011.
- CARDUCCI, C.E.; OLIVEIRA, G.C.; ZEVIANI, W.M.; LIMA, V.M.P. & SERAFIM, M.E. Retenção de água e distribuição bimodal de poros em solos sob sistema intensivo de manejo. Eng. Agríc., 33:291-302, 2013.
- CARLESSO, R. Absorção de água pelas plantas: Água disponível versus extraível e a produtividade das culturas. Ci. Rural, 25:183-188, 1995.
- CENTURION, J.F. & ANDRIOLI, I. Regime hídrico de alguns solos de Jaboticabal. R. Bras. Ci. Solo, 24:701-709, 2000.
- CIRINO, C.G. & GUERRA, H.O.C. Utilização das relações energia/umidade na caracterização físico-hídrica dos solos. Pesq. Agropec. Bras., 29:1973-1978, 1994.
- COSTA, W.A.; OLIVEIRA, C.A.D.S. & KATO, E. Modelos de ajuste e métodos para a determinação da curva de retenção de água de um Latossolo Vermelho-Amarelo. R. Bras. Ci. Solo, 32:515-523, 2008.
- DARDENGO, M.C.J.D.; REIS, E.F. & PASSOS, R.R. Influência da capacidade de campo na taxa de crescimento do cafeeiro conilon. R. Ceres, 57:42-47, 2010.
- DECAGON DEVICES, I. Dewpoint PotentiaMeter - Operator's manual version 1.3 WP4-T dewpoint meter. Pullman, 2000. 78p.
- DEXTER, A.R. Soil physical quality Part I. Theory, effects of soil texture, density, and organic matter, and effects on root growth. Geoderma, 120:201-214, 2004.
- DEXTER, A.R. & BIRD, N.R.A. Methods for predicting the optimum and the range of soil water contents for tillage based on the water retention curve. Soil Till. Res., 57:203-212, 2001.
- DOORENBOS, J. & KASSAN, A.H. Efeito da água no rendimento das culturas. Campina Grande, UFPB, 1994. 306 p. (Estudos FAO. Irrigação e Drenagem, 33)
- EMPRESA BRASILEIRA DE PESQUISA AGROPECUÁRIA - EMBRAPA. Centro Nacional de Pesquisa de Solos. Manual de métodos de análise de solo. 2.ed. Rio de Janeiro, 1997. 212p.
- EMPRESA BRASILEIRA DE PESQUISA AGROPECUÁRIA - EMBRAPA. Centro Nacional de Pesquisas de Solos. Sistema brasileiro de classificação de solos. 2.ed. Rio de Janeiro, 2006. 306p.
- FABIAN, A.J. & OTTONI FILHO, T.B. Determinação de capacidade de campo in situ ou através de equações de regressão. Pesq. Agropec. Bras., 35:1029-1036, 2000.
- FERREIRA, D.F. Sisvar: A computer statistical analysis system. Ci. Agrotec., 35:1039-1042, 2011.
- FERREIRA, M.M.; FERNANDES, B. & CURI, N. Mineralogia da fração argila e estrutura de Latossolos da região sudeste do Brasil. R. Bras. Ci. Solo, 23:507-514, 1999a.
- FERREIRA, M.M.; FERNANDES, B. & CURI, N. Influência da mineralogia da fração argila nas propriedades físicas de Latossolos da região sudeste do Brasil. R. Bras. Ci. Solo, 23:515-524, 1999b.
- FERREIRA, M.M. & MARCOS, Z.Z. Estimativa da capacidade de campo de Latossolo Roxo distrófico e Regossolo através do ponto de inflexão da curva característica de umidade. Ci. Prática, 7:96-101, 1983.
- GEE, G.W.; WARD, A.L.; ZHANG, Z.F.; CAMPBELL, G.S. & MATHISON, J. The influence of hydraulic nonequilibrium on pressure plate data. Vadose Zone J., 1:172-178, 2002.
- KAISER, D.R.; REINERT, D.J.; REICHERT, J.M.; COLLARES, G.L. & KUNZ, M. Intervalo hídrico ótimo no perfil explorado pelas raízes de feijoeiro em um Latossolo sob diferentes níveis de compactação. R. Bras. Ci. Solo, 33:845-855, 2009.
- KLEIN, V.A.; BASEGGIO, M.; MADALOSSO, T. & MARCOLIN, C.D. Textura do solo e a estimativa do teor de água no ponto de murcha permanente com psicrômetro. Ci. Rural, 40:1550-1556, 2010.
- KLEIN, V.A.; REICHERT, J.M. & REINERT, D.J. Água disponível em um Latossolo Vermelho argiloso e murcha fisiológica de culturas. R. Bras. Eng. Agríc. Amb., 10:646-650, 2006.
- LIMA, V.M.P.; OLIVEIRA, G.C.; SERAFIM, M.E.; CURI, N. & EVANGELISTA, A.R. Intervalo hídrico ótimo como indicador de melhoria da qualidade estrutural de Latossolo degradado. R. Bras. Ci. Solo, 36:71-78, 2012.
- LOPES, A.S. Solos sob "cerrado": Características, propriedades e manejo. Piracicaba, Associação Brasileira para a Pesquisa da Potassa e do Fosfato, 1983. 162p.
- MELLO, C.R.; OLIVEIRA, G.C.; RESCK, D.V.S.; LIMA, J.M. & DIAS JÚNIOR, M.S. Estimativa da capacidade de campo baseada no ponto de inflexão da curva característica. Ci. Agrotec., 26:836-841, 2002.
- OLIVEIRA, G.C.; DIAS JUNIOR, M.S.; RESCK, D.V.S. & CURI, N. Caracterização química e físico-hídrica de um Latossolo Vermelho após vinte anos de manejo e cultivo do solo. R. Bras. Ci. Solo, 28:327-336, 2004.
- PEREIRA, A.R.; VILLA NOVA, N.A. & SEDIYAMA, G.C. Evapo(transpi)ração. Piracicaba, FEALQ, 1997. 183p.
- PINTO, H.S.; ZULLO JR., J.; ASSAD, E.D.; BRUNINI, O.; ALFONSI, R.R. & CORAL, G. Zoneamento de riscos climáticos para a cafeicultura do estado de São Paulo. R. Bras. Agrometeo., 9:495-500, 2001.
- RANZANI, G. Solos de cerrado no Brasil. In: SIMPÓSIO SOBRE O CERRADO, 3., São Paulo, 1971. Anais.... , São Paulo, 1971. p.26-43.
- REICHARDT, K. Como superar o veranico no Cerrado. Inf. Agron., 32:1-2, 1985.
- REICHARDT, K. Capacidade de campo. R. Bras. Ci. Solo, 12:211-216, 1988.
- REICHARDT, K. & TIMM, L.C. Solo, planta e atmosfera: Conceitos, processos e aplicações. Barueri, Manole, 2004. 478p.
- REICHERT, J.M.; ALBUQUERQUE, J.A.; GUBIANI, P.I.; KAISER, D.R.; MINELLA, J.P.G. & REINERT, D.J. Hidrologia do solo, disponibilidade de água às plantas e zoneamento agroclimático. In: KLAUBERG FILHO, O.; MAFRA, A.L. & GATIBONI, L.C., eds. Tópicos em ciência do solo. Viçosa, MG, Sociedade Brasileira de Ciência do Solo, 2011. v.7, p.1-54.
- REYNOLDS, W.; DRURY, C.; YANG, X. & TAN, C. Optimal soil physical quality inferred through structural regression and parameter interactions. Geoderma, 146:466-474, 2008.
- RITCHIE, J.T.; BURNETT, E. & HENDERSON, R.C. Dryland evaporative flux in a subhumid climate. 3 - Soil water influences. Agron. J., 64:168-173, 1972.
- ROMANO, S. & SANTINI, A. Water retention and storage. In: DANE, J.H. & TOPP, G.C., eds. Methods of soil analysis. Madison, Soil Science Society America, 2002. p.721-738.
- RUIZ, H.A.; FERREIRA, G.B. & PEREIRA, J.B.M. Estimativa da capacidade de campo de Latossolos e Neossolos Quartzarênicos pela determinação do equivalente de umidade. R. Bras. Ci. Solo, 27:389-393, 2003.
- SCANLON, B.R. Water potential: Miscellaneous methods for measuring matric or water potential. In: DANE, J. & TOPP, C., eds. Methods of soil analysis: Physical methods. Madison, Soil Science Society of America, 2002. Part 4. p.643-670.
- SEDIYAMA, G.C.; MELO JUNIOR, J.C.F.; SANTOS, A.R.; RIBEIRO, A.; COSTA, M.H.; HAMAKAWA, P.J.; COSTA, J.M.N. & COSTA, L.C. Zoneamento agroclimático do cafeeiro (Coffea arabica L.) para o estado de Minas Gerais. R. Bras. Agrometeo., 9:501-509, 2001.
- SERAFIM, M.E.; OLIVEIRA, G.C.; OLIVEIRA, A.S.; LIMA, J.M.; GUIMARÃES, P.T.G. & COSTA, J.C. Sistema conservacionista e de manejo intensivo do solo no cultivo de cafeeiros na região do alto São Francisco, MG: Um estudo de caso. Biosci. J., 27:964-977, 2011.
- SERAFIM, M.E.; OLIVEIRA, G.C.; LIMA, J.M.; SILVA, B.M.; ZEVIANI, W.M. & LIMA, V.M.P. Disponibilidade hídrica e distinção de ambientes para cultivo de cafeeiros. R. Bras. Eng. Agríc. Amb., 17:362-370, 2013.
- SILVA, B.M. Dinâmica espaço-temporal da água no solo cultivado com cafeeiro nas condições climáticas do Alto São Francisco - MG. Lavras, Universidade Federal de Lavras, 2012. 78p. (Dissertação de Mestrado)
- SILVA, A.P.; KAY, B.D. & PERFECT, E. Characterization of the least limiting water range of soils. Soil Sci. Soc. Am. J., 58:1775-1781, 1994.
- SILVA, B.M.; OLIVEIRA, G.C.; SERAFIM, M.E.; SILVA JÚNIOR, J.J.; COLOMBO, A. & LIMA, J.M. Acurácia e calibração de sonda de capacitância em Latossolo Vermelho cultivado com cafeeiro. Pesq. Agropec. Bras., 47:277-286, 2012a.
- SILVA, B.M.; OLIVEIRA, G.C.; SILVA, É.A.; OLIVEIRA, L.M. & SERAFIM, M.E. Índice S no diagnóstico da qualidade estrutural de Latossolo muito argiloso sob manejo intensivo. Biosci. J., 28:338-345, 2012b.
- SILVA, J.C.; HELDWEIN, A.B.; RADONS, S.Z.; MALDANER, I.C.; TRENTIN, G. & GRIMM, E.L. Necessidade de irrigação para o feijoeiro na região central do Rio Grande do Sul. R. Bras. Eng. Agríc. Amb., 15:1030-1036, 2011.
- SOUZA, J.L.M. & FRIZZONE, J.A. Simulação do balanço hídrico para a cultura do cafeeiro nas regiões de Lavras e Uberlândia. Sci. Agric., 8:291-301, 2007.
- SOUZA, C.C.; OLIVEIRA, F.A.; SILVA, I.F. & AMORIM NETO, M.S. Avaliação de métodos de determinação de água disponível em solo cultivado com algodão. Pesq. Agropec. Bras., 37:337-341, 2002.
- van GENUCHTEN, M.T. A closed-form equation for predicting the hydraulic conductivity of unsaturated soils. Soil Sci. Soc. Am. J., 44:892-898, 1980.
- van GENUCHTEN, M.T.; LEIJ, F.J. & YATES, S.R. The RETC Code for quantifying the hydraulic functions of unsaturated soils, Version 1.0. Riverside, 1991.
- van LIER, Q.J. Índices de disponibilidade de água para as plantas. In: NOVAIS, R.F.; ALVAREZ V., V.H. & SCHAEFER, C.E.G.R., eds. Tópicos em ciência do solo. Viçosa, MG, Sociedade Brasileira de Ciência do Solo, 2000. v.1, p.95-106.
- VEIHMEYER, F.J. & HENDRICKSON, A.H. The relation of soil moisture to cultivation and plant growth. Soil Sci., 3:498-513, 1927.
- VEIHMEYER, F.J. & HENDRICKSON, A.H. The moisture equivalent as a measure of the field capacity of soils. Soil Sci., 32:181-193, 1931.
- VEIHMEYER, F.J. & HENDRICKSON, A.H. Methods of measuring field capacity and wilting percentages of soils. Soil Sci., 68:75-94, 1949.
- WHITE, R.E. Principles and practice of soil science. 4.ed. Oxford, Blackwell Publishing, 2006. 363p.
Publication Dates
-
Publication in this collection
18 June 2014 -
Date of issue
Apr 2014
History
-
Accepted
03 Dec 2013 -
Received
28 May 2013