
Abstracts
The assessment of spatial uncertainty in the prediction of nutrient losses by erosion associated with landscape models is an important tool for soil conservation planning. The purpose of this study was to evaluate the spatial and local uncertainty in predicting depletion rates of soil nutrients (P, K, Ca, and Mg) by soil erosion from green and burnt sugarcane harvesting scenarios, using sequential Gaussian simulation (SGS). A regular grid with equidistant intervals of 50 m (626 points) was established in the 200-ha study area, in Tabapuã, São Paulo, Brazil. The rate of soil depletion (SD) was calculated from the relation between the nutrient concentration in the sediments and the chemical properties in the original soil for all grid points. The data were subjected to descriptive statistical and geostatistical analysis. The mean SD rate for all nutrients was higher in the slash-and-burn than the green cane harvest scenario (Student’s t-test, p<0.05). In both scenarios, nutrient loss followed the order: Ca>Mg>K>P. The SD rate was highest in areas with greater slope. Lower uncertainties were associated to the areas with higher SD and steeper slopes. Spatial uncertainties were highest for areas of transition between concave and convex landforms.
green cane harvesting; burnt cane harvesting; geostatistics; landforms; sequential Gaussian simulation
A avaliação da incerteza espacial das predições das perdas de nutrientes por erosão, associada aos modelos de paisagem, é importante ferramenta na análise e no planejamento conservacionista do solo. O objetivo deste trabalho foi avaliar a incerteza espacial e o local na predição das taxas de empobrecimento do solo por nutrientes (P, K, Ca e Mg) em razão da erosão hídrica em dois sistemas de colheita da cana-de-açúcar (cana crua e queimada), utilizando-se a simulação sequencial gaussiana (SSG). O estudo foi realizado em uma área de 200 ha, localizada em Tabapuã, Estado de São Paulo, sudeste do Brasil. Uma malha de amostragem regular foi estabelecida na área, com intervalos equidistantes de 50 m, totalizando 626 pontos. A taxa de empobrecimento do solo foi calculada com base na relação entre concentração dos nutrientes no sedimento erodido e os atributos químicos do solo original, ponto a ponto. Os dados foram submetidos à análise estatística descritiva e geoestatística. A taxa média de empobrecimento do solo para todos os nutrientes avaliados foi superior no cenário de cana queimada em relação ao cenário de cana crua (teste t-Student; p<0,05). Em ambos os cenários, a ordem da perda dos nutrientes foi: Ca>Mg>K>P. Áreas com maior taxa de empobrecimento do solo foram relacionadas à maior declividade da paisagem. As menores incertezas estão associadas às áreas com maiores taxas de empobrecimento do solo e declividades. Por sua vez, as maiores incertezas estão associadas às áreas de transição entre as pedoformas côncava e convexa.
cana crua; cana queimada; empobrecimento do solo; geoestatística; pedoformas; simulação sequencial gaussiana
INTRODUCTION
Water erosion is one of the main causes of soil depletion due to the removal of nutrients and organic matter, aggravated in non-conservation soil tillage systems. Water erosion affects crop yields, increasing production costs, aside from deteriorating the quality of surface water and causing eutrophication of water sources. Nutrients are carried away by the runoff, adsorbed to soil colloids and/or solubilized (Schick et al., 2000Schick J, Bertol I, Balbinot JRAA, Batistela O. Erosão hídrica em Cambissolo Húmico alumínico submetido a diferentes sistemas de preparo e cultivo do solo: II. Perdas de nutrientes e carbono orgânico. R Bras Ci Solo. 2000;24:437-47.). Soil impoverishment at the source location of erosion and contamination of surrounding environments are related to the transferred sediments, which have different adsorption capacities of chemical substances, e.g., of pesticides.
The resistance of soil to rain action is determined by the erodibility, relief topography, management practices, and crops (Volk and Cogo, 2008Volk LBS, Cogo NP. Inter-relação biomassa vegetal subterrânea-estabilidade de agregados-erosão hídrica em solo submetido a diferentes formas de manejo. R Bras Ci Solo. 2008;32:1713-22.). In erosion-susceptible soils such as Alfisols, vulnerability to erosion is exacerbated in managements without vegetation cover (Lepsch, 2011Lepsch IF. 19 lições de pedologia. São Paulo: Oficina de Textos; 2011.).
This study investigated two sugarcane production systems: one with mechanical harvesting of green cane, where the plant residues are left on the soil surface,versus a manual harvesting system of sugarcane after burning, to eliminate the cane leaves (straw). The cultivation system with mechanical tillage and crop residue burning increases the amount of loose sediments carried away by runoff (Bertol et al., 2010Bertol I, Vázquez EV, González AP, Cogo NP, Luciano RV, Fabian EL. Sedimentos transportados pela enxurrada em eventos de erosão hídrica em um Nitossolo Háplico. R Bras Ci Solo. 2010;34:245-52.). In the other system, the green cane residues form a soil cover that reduces aggregate destruction in the soil surface layer by the lower impact of raindrops on the surface (Garbiate et al., 2011Garbiate MV, Vitorino ACT, Tomasini BA, Bergamin AC, Panachuki E. Erosão em entre sulcos em área cultivada com cana crua e queimada sob colheita manual e mecanizada. R Bras Ci Solo. 2011;35:2145-55.).
The process of particle translocation in the soil profile, along with erosion processes, increase the spatial variability of agricultural soils (Sanchez et al., 2009Sanchez RB, Marques Jr J, Souza ZM, Pereira GT, Martins Filho MV. Variabilidade espacial de atributos do solo e de fatores de erosão em diferentes pedoformas. Bragantia. 2009;68:1095-103.). Thus, the evaluation of the spatial variability of nutrient and soil losses and of erosion factors has been a focus of studies analyzing the implementation of soil conservation management practices (Campos et al., 2009Campos MCC, Marques Jr J, Pereira GT, Souza ZM, Montanari R. Planejamento agrícola e implantação de sistema de cultivo de cana-de-açúcar com auxílio de técnicas geoestatísticas. R Bras Eng Agric Amb. 2009;13:297-304.).
Variations in the soil properties in the landscape are related to the relief characteristics, such as slope and shapes (curvature). The relief forms define the distribution of water and soluble materials, causing convergence of these materials in concave areas, divergence in convex areas, and erosion and linear deposition in areas with slopes that favor the water movement (Pennock and Jong, 1987Pennock DJ, Jong E. The influence of slope curvature on soil erosion and deposition in Hummock terrain. Soil Sci. 1987;144:209-17.). Thus, geostatistical analyses are recommended to characterize the spatial variability of soil properties (Willding and Dress, 1983Wilding LP, Drees LR. Spatial variability and pedology. In: Wilding LP, Smeck NE, Hall GF, editors. Pedogenesis and soil taxonomy: concepts and interactions. New York: Elsevier; 1983. p.83-116.).
Among the geostatistical techniques, indicator kriging and sequential Gaussian simulation (SGS) are promising to establish new and more accurate technologies of erosion control (Sanchez et al., 2009Sanchez RB, Marques Jr J, Souza ZM, Pereira GT, Martins Filho MV. Variabilidade espacial de atributos do solo e de fatores de erosão em diferentes pedoformas. Bragantia. 2009;68:1095-103.). The latter can provide a quantitative measure of the spatial uncertainty (Silva et al., 2012Silva GRV, Souza ZM, Martins Filho MV, Barbosa RS, Souza GS. Soil, water and nutrient losses by interrill erosion from green cane cultivation. R Bras Ci Solo. 2012;36:963-70.) and has been used successfully as an alternative of evaluation and determination of the uncertainties of erosion processes and factors (Zhao et al., 2009Zhao Y, Xu X, Darilek J, Huang B, Sun W, Shi X. Spatial variability assessment of soil nutrients in an intense agricultural area, a case study of Rugao County in Yangtze River Delta Region, China. Environ Geol. 2009;57:1089-102.; Sun et al., 2012Sun X, Wu S, Wang H, Zhao Y, Zhang G, Man YB, Wong MH. Uncertainty analysis for the evaluation of agricultural soil quality based on digital soil maps. Soil Sci Soc Am J. 2012;76:1379-89.), allowing a more reliable delimitation of erosion-prone areas.
To map the soil nutrient depletion rate, the characterization of the spatial and local uncertainty by SGS is essential, since the construction of spatial distribution maps is insufficient. Moreover, the uncertainty of the location and spatial information that is being generated has to be quantified, since local information in form of estimates and their uncertainties contributes to a detailed planning of agricultural practices on different spatial and temporal scales, and enables an assessment of the risk of the decision to be made. The objective of this study was to evaluate the spatial and local uncertainty in the prediction of soil depletion rates of nutrients (P, K, Ca, and Mg), due to water erosion in two sugarcane harvest scenarios (green and burnt cane), based on sequential Gaussian simulation (SGS).
MATERIAL AND METHODS
The experimental area is located in the municipality of Tabapuã (SP), in the northwest of São Paulo State, Brazil (21o 05’ S, and 49o 01’ W, mean altitude of 500 m asl), covering 200 ha, with a history of intensive sugarcane cultivation for more than 20 consecutive years. According to Thornthwaite’s classification (1948), the climate is megathermic (C2dA’a’), sub-humid rainy, with little or no surplus water, and summer evapotranspiration less than 48 % of the annual total. The soil was classified as eutrophic Argissolo Vermelho-Amarelo (Typic Hapludalf) with medium texture, according to Santos et al. (2013)Santos HG, Jacomine PKT, Anjos LHC, Oliveira VA, Oliveira JB, Coelho MR, Lumbreras JF, Cunha TJF, Almeida JA, editores. Sistema brasileiro de classificação de solos. 3ª.ed. Rio de Janeiro: Embrapa Solos; 2013..
A sampling grid with 626 points spaced at regular distances of 50 m (Sanchez et al., 2009Sanchez RB, Marques Jr J, Souza ZM, Pereira GT, Martins Filho MV. Variabilidade espacial de atributos do solo e de fatores de erosão em diferentes pedoformas. Bragantia. 2009;68:1095-103.) was established, at which the exact concentrations of the chemical properties were evaluated (Figure 1a). In geomorphological and soil analyses, aerial photos (1:35,000) were used for field assessments and construction of the elevation profile. The slope map was constructed from the digital elevation model (DEM) based on slope intervals, as classified by Lepsch (1991)Lepsch IF. Manual para levantamento utilitário do meio físico e classificação de terras no sistema de capacidade de uso. Campinas: Sociedade Brasileira de Ciência de Solo; 1991.: A - plain (0-2 %); B - gently undulating (2-5 %); C - moderately undulating (5-10 %) (Figure 1b). Two landforms, a concave and convex, were also identified by the DEM, according to the models proposed by Troeh (1965)Troeh FR. Landform equations fitted to contour maps. Am J Sci. 1965;263:616-27. (Figure 1c).
Sampling grid (a), digital elevation model and slope class (b), and landforms in the study area (c).
Based on the chemical property data obtained by Sanchez et al. (2009)Sanchez RB, Marques Jr J, Souza ZM, Pereira GT, Martins Filho MV. Variabilidade espacial de atributos do solo e de fatores de erosão em diferentes pedoformas. Bragantia. 2009;68:1095-103. and the nutrient concentrations (P, K, Ca, and Mg) in eroded sediments, determined by Martins Filho et al. (2009) in this same area, the soil depletion (SD) rates were estimated (Bertol et al., 2004Bertol I, Leite D, Guadagnin JC, Ritter SR. Erosão hídrica em um Nitossolo Háplico submetido a diferentes sistemas de manejo sob chuva simulada. II. Perdas de nutrientes e carbono orgânico. R Bras Ci Solo. 2004;28:1045-54.) in two scenarios of sugarcane harvesting (manual harvesting of burnt cane and mechanical harvesting of green cane). Thus, the study investigated the cultivation of cane harvested green and burnt, grown on the same soil type with similar topography (mean slope of around 0.052 mm-1), in the same production cycles, with the same sugarcane variety and similar cultural practices. Differences consisted only of the harvest systems: in the first case, the cane was harvested mechanically (green cane) in an area with a history of over 20 years without sugarcane burning, with large amounts of crop residues (mean 14 t ha-1), left on the soil surface after harvest. In the second, the cane was burnt in an area with a history of sugarcane cultivation since 1970, with burning of the sugarcane fields and manual harvesting. The SD rate was estimated by equation 1:

where SD>1 (dimensionless) means that the sediment is enriched with nutrients from the soil. In this case, soil depletion occurs. The data were evaluated based on values from samplings at the fifth sugarcane harvest.
At planting, the sugarcane variety SP-813 250 was fertilized with 812 L ha-1 of the N-P-K mixture 04-12-10, and ratoon cane was fertilized with 944.21 L ha-1 of the mixture 10-00-10, aside from vinasse application in the area.
The SD rate was evaluated by descriptive statistics, calculating the mean, standard error of the mean, standard deviation, minimum value, median, maximum value, coefficient of variation (CV), and skewness and kurtosis coefficients. Mean values between scenarios (burnt and green harvested cane) were compared by the Student’s t-test in dependent samples (p<0.05). Subsequently, the spatial dependence of the SD rate was evaluated to identify whether the samples are dependent on the geographical position in relation to the experimental variogram, which, based on the assumption of stationarity of the intrinsic hypothesis (Deutsch and Journel, 1998Deutsch CV, Journel AG. GSLIB: Geostatistical Software Library and user’s guide. 2nd.ed. New York: Oxford University Press; 1998.), can be estimated by:
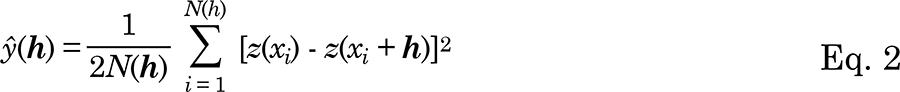
where ŷ(h) is the semi-variance estimate; N(h) is the number of pairs of observed valuesZ(xi), Z(xi+ h)separated by the distance h; andxi is the spatial position of the variable Z. A permissible mathematical model was fitted to the experimental variogram and its coefficients (the nugget effect -C0; sill -C0+C1; and the range - a) were estimated. To select the models of experimental variograms, the lowest RSS (residual sum of squares) values and the highest R2(coefficient of determination) were considered.
Prior to the application of the SGS technique, the SD rate data were transformed to a standardized Gaussian distribution (where mean = 0 and variance = 1). The principle of SGS consists of refining the sampling grid and defining the path of the visit without a predetermined order (random) for each point of the sample grid. Thereafter, the mean and the variance of the Gaussian conditional cumulative distribution function (ccdf) is determined for each point to be simulated, by ordinary kriging estimation using the normalized data of the variogram. Later, a simulated value of this ccdf is generated and added to the set of conditional data consisting of the observed and previously simulated points. In this way, we successively proceeded to the next point set in the random path, repeating the previous steps until all sample grid points were visited. Finally, the normalized data were re-transformed to the original scale of the observed data, thus generating one realization. For multiple realizations, these steps are repeated with different random paths for each realization (Deutsch and Journel, 1998Deutsch CV, Journel AG. GSLIB: Geostatistical Software Library and user’s guide. 2nd.ed. New York: Oxford University Press; 1998.).
In this study, we simulated 200 realizations using software WinGslib (Deutsch and Journel, 1998Deutsch CV, Journel AG. GSLIB: Geostatistical Software Library and user’s guide. 2nd.ed. New York: Oxford University Press; 1998.). From the simulated realizations, mean maps of spatial distribution of the variables were generated by calculating the mean point of all realizations, providing estimates called E-type (Deutsch and Journel, 1998Deutsch CV, Journel AG. GSLIB: Geostatistical Software Library and user’s guide. 2nd.ed. New York: Oxford University Press; 1998.). Likewise, the standard deviation of all simulated maps was calculated point by point, providing the deviation map, to evaluate the uncertainties in both sugarcane scenarios.
RESULTS AND DISCUSSION
The fact that the mean SD rates exceeded 1.0 for all nutrients studied (Table 1) indicates the occurrence of soil depletion, characterizing the selective drain of material transported in the erosion process, consisting mainly of fine particles, reactive soil fractions and hence a great capacity of removing nutrients (Silva et al., 2005Silva AM, Silva MLN, Curi N, Lima JM, Avanzi JC, Ferreira MM. Perdas de solo, água, nutrientes e carbono orgânico em Cambissolo e Latossolo sob chuva natural. Pesq Agropec Bras. 2005;40:1223-30.). The SD rates >1 can also be explained by the fact that the nutrient levels in the sediment vary according to their concentrations in the soil, which is directly influenced by fertilization. According to Bertol et al. (2004)Bertol I, Leite D, Guadagnin JC, Ritter SR. Erosão hídrica em um Nitossolo Háplico submetido a diferentes sistemas de manejo sob chuva simulada. II. Perdas de nutrientes e carbono orgânico. R Bras Ci Solo. 2004;28:1045-54., nutrient concentrations in eroded sediments have a positive linear correlation with the chemical composition of the 0.000-0.025 m layer from which the particles were removed.
The mean rates of soil depletion (SD) for P, K, Ca, and Mg in the burnt cane scenario were higher than those in the green cane scenario, according to the Student’s t-test in dependent samples (p<0.05) (Table 1). This fact resulted from the absence of plant residues on the soil surface.
The reductions in SD rates in the green compared to the burnt cane scenario were 78.87 % for P; 88.11 % for K; 81.59 % for Ca; and 81.40 % for Mg. These reductions can be explained by the burning of crop residues, since bare soil is more prone to accelerated erosion, so the reductions in SD rate will be greater than the concentrations in the green cane scenario without straw burning, as observed byKnicker (2007)Knicker H. How does fire affect the nature and stability of soil organic nitrogen and carbon? A review. Biogeochemistry. 2007;85:91-118.. Thus, the higher SD rate in burnt cane is also related to the practice of burning before harvest, since the SD rate is inversely proportional to the nutrient concentration in the original soil, and burning can reduce the concentration in comparison with unburnt soils.
The mean SD values greater than 1 (Table 1) for the green cane scenario were due to the fact that the plant residue left on the soil surface determine the size distribution of the sediment carried away by runoff. These plant residues reduce the runoff speed, increasing the deposition time of the larger sediment, favoring the transfer of particles with smaller diameter, including clay, thus removing nutrients from the soil (Silva et al., 2005Silva AM, Silva MLN, Curi N, Lima JM, Avanzi JC, Ferreira MM. Perdas de solo, água, nutrientes e carbono orgânico em Cambissolo e Latossolo sob chuva natural. Pesq Agropec Bras. 2005;40:1223-30.; Silva et al., 2012Silva GRV, Souza ZM, Martins Filho MV, Barbosa RS, Souza GS. Soil, water and nutrient losses by interrill erosion from green cane cultivation. R Bras Ci Solo. 2012;36:963-70.).
In the burnt as well as in the green cane scenario, the mean SD rate has the following order: Ca>Mg>K>P (Table 1). The divalent cations Ca and Mg are less prone to leaching for being more strongly adsorbed to the colloidal fraction than the monovalent cations of the soil (Bertol et al., 2004)Bertol I, Leite D, Guadagnin JC, Ritter SR. Erosão hídrica em um Nitossolo Háplico submetido a diferentes sistemas de manejo sob chuva simulada. II. Perdas de nutrientes e carbono orgânico. R Bras Ci Solo. 2004;28:1045-54.. Due to the stronger binding of Ca and Mg than of K and P to the colloidal fraction, the increase in the transport speed of these sediments is facilitated, aside from the fact that the colloidal fraction and organic matter are the first components removed by erosion, due to their low density (Seganfredo et al., 1997)Seganfredo ML, Eltz FLF, Brum ACR. Perdas de solo, água e nutrientes por erosão em sistemas de culturas em plantio direto. R Bras Ci Solo. 1997;21:287-91.. Phosphorus is the most resistant to removal, due to its mechanism of increasing the adsorption energy and being gradually converted to less mobile forms.
The mean SD rates for P, K, Ca, and Mg in the burnt cane scenario were, respectively, 1.42, 1.43, 4.40, and 3.28 (Table 1). For the same Alfisol with slope 0.052 m m-1, also in unburnt sugarcane cultivation with no crop residues, Martins Filho et al. (2009)Martins Filho MV, Liccioti TT, Pereira GT, Marques Jr J, Sanchez RB. Perdas de solo e nutrientes por erosão num Argissolo com resíduos vegetais de cana-de-açúcar. Eng Agric. 2009;29:8-18. determined SD rates for P, K, Ca, and Mg, respectively, in the order of 3.8, 1.3, 3.9, and 2.9. Although soil depletion was stated in both studies, we observed higher SD values than Martins Filho et al. (2009)Martins Filho MV, Liccioti TT, Pereira GT, Marques Jr J, Sanchez RB. Perdas de solo e nutrientes por erosão num Argissolo com resíduos vegetais de cana-de-açúcar. Eng Agric. 2009;29:8-18., except for the SD of P, caused by the burning of crop residues which accelerated erosion, resulting in higher P loss from the soil. Another important detail is that in the evaluation of Martins Filho et al. (2009)Martins Filho MV, Liccioti TT, Pereira GT, Marques Jr J, Sanchez RB. Perdas de solo e nutrientes por erosão num Argissolo com resíduos vegetais de cana-de-açúcar. Eng Agric. 2009;29:8-18., the area had been mechanically harvested for five years, and in the treatment with 0 % soil cover sugarcane was harvested without burning.
According to the classification proposed by Warrick and Nielsen (1980)Warrick AW, Nielsen DR. Spatial variability of soil physical properties in the field. In: Hillel D, editor. Applications of soil physics. New York: Academic; 1980. p.319-44., the values of the coefficients of variation for SD rates were low (CV<12 %), except for P and Mg in the green sugarcane scenario, where CV was moderate (12 %<CV<24 %). The asymmetry coefficient for the SD rates for the green and burnt cane scenarios were lower than 1 and the mean and median values were close; although a symmetrical distribution is not mandatory, it is a good indicator to improve the application of the geostatistical technique (Table 1).
The exponential model fits the experimental variograms best for all nutrients, in both scenarios (Table 2). This model represents the essence of spatial randomness, when changes in the soil are the major contribution to variation, indicating that the SD rate for all nutrients, in both scenarios, is more erratic on a small scale (Deutsch and Journel, 1998Deutsch CV, Journel AG. GSLIB: Geostatistical Software Library and user’s guide. 2nd.ed. New York: Oxford University Press; 1998.). The degree of spatial dependence (DSD) for the SD rate for all nutrients, in both scenarios, was classified as moderate (25<DSD≤75 %) (Cambardella et al., 1994Cambardella CA, Moorman TB, Novak JM, Parkin TB, Karlen DL, Turco RF, Konopka AE. Field-scale variability of soil properties in central Iowa soils. Soil Sci Soc Am J. 1994;58:1501-11.). The ranges defined by the SD rate for each evaluated nutrient were similar in both scenarios. The lowest spatial continuity of K, in the green cane scenario, was given by the lowest range value (146.58 m). This can be explained by the high mobility of K in the soil profile, since the retention power of the exchangeable cations Ca, Mg and K on soil colloids follows a series called lyotropic, resulting in greater K leaching in well-drained soils (Raij, 1991Raij Bvan. Fertilidade do solo e adubação. Piracicaba: Ceres; 1991.). Therefore, the presence of crop residues which improve the rate of water infiltration into the soil profile, according to Panachuki et al. (2011)Panachuki E, Bertol I, Sobrinho TA, Oliveira PTS, Bicca DBR. Perdas de solo e de água e infiltração de água em Latossolo Vermelho sob sistemas de manejo. R Bras Ci Solo. 2011;35:1777-85., can further exacerbate K leaching. Another important factor in this process is the practice of vinasse application, which is K-rich and can aggravate the leaching of this nutrient (Silva et al., 2007)Silva MAS, Griebeler NP, Borges LC. Uso de vinhaça e impactos nas propriedades do solo e lençol freático. R Bras Eng Agric Amb. 2007;11:108-14..
The spatial variation patterns of SD for P, K, Ca, and Mg, in both cultivation scenarios (Figure 2), were strongly related with the classes B and C of the area with slope >2 % (gently and moderately undulating) (Figure 1b). Although, in both scenarios, the highest SD rates were determined for slope class C (5 - 10 %; moderately undulating), in the green cane scenario, soil depletion was far lower than in the burnt cane scenario, due to the effect of plant residues left on the soil surface, as found by Martins Filho et al. (2009)Martins Filho MV, Liccioti TT, Pereira GT, Marques Jr J, Sanchez RB. Perdas de solo e nutrientes por erosão num Argissolo com resíduos vegetais de cana-de-açúcar. Eng Agric. 2009;29:8-18..
E-type estimates of P, K, Ca, and Mg soil depletion rates in burnt and green sugarcane harvest scenarios stems.
Soil impoverishment is related to areas with low slopes (2 - 5 %) (class B) (Figure 1b). Therefore, the slopes associated with the relief forms in the landscape affect the SD rate (Figure 2). In general, lower SD rates were observed in the transition between landforms, and in the concave compared the convex landform. Sanchez et al. (2009)Sanchez RB, Marques Jr J, Souza ZM, Pereira GT, Martins Filho MV. Variabilidade espacial de atributos do solo e de fatores de erosão em diferentes pedoformas. Bragantia. 2009;68:1095-103. confirmed that small changes in the slope interfere with soil formation processes and determine the flow of water and soil solutes.
The spatial distribution maps (E-type), along with the percentages of areas with higher or lower SD rates for each nutrient in green and burnt cane scenarios (Table 3), emphasize that despite the soil depletion in the two scenarios, the green cane scenario is less aggressive than that of burnt cane. For nutrient P, SD values between 1.22 and 1.55 correspond to 89.17 % of the total area of burnt cane (BC) while for the green cane scenario (GC), this range of values corresponds to only 23 % of the total area. Regarding the SD rate of K, 44.28 % of the BC and 0.22 % of the GC area correspond to a SD range from 1.40 to 1.72. For the SD rate of Ca, the variability class from 4.30 to 5.80 corresponds to 60.06 % of the total BC area, and only 0.17 % of the GC area. In turn, the SD values for Mg from 3.3 and 4.4 represent an area of 39.59 % for BC and of 0.04 % for GC. The reduction of these areas is a result of the decrease in sediment concentration in runoff, which carries off the nutrients, due to the straw left after mechanical harvesting. Garbiate et al. (2011)Garbiate MV, Vitorino ACT, Tomasini BA, Bergamin AC, Panachuki E. Erosão em entre sulcos em área cultivada com cana crua e queimada sob colheita manual e mecanizada. R Bras Ci Solo. 2011;35:2145-55. found a 7.6-fold lower sediment concentration in runoff from green than from burnt cane.
Percentage of areas of E-type estimates of P, K, Ca and Mg soil depletion rates, as function of numerical class of the soil depletion rates values in burnt cane (BC) and green cane (GC) harvest scenarios
The evaluation of the local uncertainty by means of histograms (Figure 2) shows that for all tested SD rates, the highest coefficients of variation, which correspond to the highest local uncertainties of the estimate, lie exactly in the upper part of the area, where the SD rates are lower (Figure 2). In turn, standard deviation maps (Figure 3) report that the highest spatial uncertainty caused by simulations coincides with the lowest slope classes, especially of class B (2 - 5 %), and the lowest SD rates. The uncertainties of the SD rates of P and K were lower than those of Ca and Mg. This fact coincides with the lowest SD rates, following the descending order of values: Ca>Mg>K>P (Figure 2). In general, there were no major differences in the spatial uncertainty between the different scenarios evaluated, indicating that the cropping scenario does not influence the reduction of uncertainty of the estimates.
Standard deviation estimates of P, K, Ca, and Mg soil depletion rates in burnt and green sugarcane harvest scenarios.
The fact that the spatial and local estimates of uncertainty for SD rates for all analyzed nutrients were highest for the highest part of the landscape was because this region is a transition area between concave and convex landforms (Figure 1c). This relief transition influences the surface water flow directly, causing greater variability in the process of soil and nutrient losses (Sanchez et al., 2009Sanchez RB, Marques Jr J, Souza ZM, Pereira GT, Martins Filho MV. Variabilidade espacial de atributos do solo e de fatores de erosão em diferentes pedoformas. Bragantia. 2009;68:1095-103.). The spatial and local uncertainties addressed in this paper show the quality of information being generated, as well as the possible risk of an erroneous use of spatial distribution maps of SD rates, aside from identifying locations in the landscape with greater uncertainty. A practical application for these findings is that at locations with greater uncertainty, a higher sampling density is recommended to minimize uncertainty and increase the reliability of the drawing of isolines of spatial variability (Silva Júnior et al., 2012Silva Júnior JF, Marques Júnior J, Camargo LA, Teixeira DDB, Panosso AR, Pereira GT. Simulação geoestatística na caracterização espacial de óxidos de ferro em diferentes pedoformas. R Bras Ci Solo. 2012;36:1690-703.). Therefore, the use of spatial and local uncertainties also enhances sampling planning, which is the most expensive stage in agricultural production scenarios.
CONCLUSIONS
The description of the spatial and local uncertainty of the sequential Gaussian simulation plays a fundamental role in precision mapping of soil nutrient depletion rates.
The characterization of spatial uncertainty provides a basis for soil sampling planning to determine the nutrient depletion rate.
The uncertainties of soil depletion estimates were highest for areas of transition between concave and convex landforms.
The cultivation systems influenced the spatial estimates of soil depletion rates, but not the spatial and local uncertainties.
REFERENCES
- Bertol I, Leite D, Guadagnin JC, Ritter SR. Erosão hídrica em um Nitossolo Háplico submetido a diferentes sistemas de manejo sob chuva simulada. II. Perdas de nutrientes e carbono orgânico. R Bras Ci Solo. 2004;28:1045-54.
- Bertol I, Vázquez EV, González AP, Cogo NP, Luciano RV, Fabian EL. Sedimentos transportados pela enxurrada em eventos de erosão hídrica em um Nitossolo Háplico. R Bras Ci Solo. 2010;34:245-52.
- Cambardella CA, Moorman TB, Novak JM, Parkin TB, Karlen DL, Turco RF, Konopka AE. Field-scale variability of soil properties in central Iowa soils. Soil Sci Soc Am J. 1994;58:1501-11.
- Campos MCC, Marques Jr J, Pereira GT, Souza ZM, Montanari R. Planejamento agrícola e implantação de sistema de cultivo de cana-de-açúcar com auxílio de técnicas geoestatísticas. R Bras Eng Agric Amb. 2009;13:297-304.
- Deutsch CV, Journel AG. GSLIB: Geostatistical Software Library and user’s guide. 2nd.ed. New York: Oxford University Press; 1998.
- Garbiate MV, Vitorino ACT, Tomasini BA, Bergamin AC, Panachuki E. Erosão em entre sulcos em área cultivada com cana crua e queimada sob colheita manual e mecanizada. R Bras Ci Solo. 2011;35:2145-55.
- Knicker H. How does fire affect the nature and stability of soil organic nitrogen and carbon? A review. Biogeochemistry. 2007;85:91-118.
- Lepsch IF. 19 lições de pedologia. São Paulo: Oficina de Textos; 2011.
- Lepsch IF. Manual para levantamento utilitário do meio físico e classificação de terras no sistema de capacidade de uso. Campinas: Sociedade Brasileira de Ciência de Solo; 1991.
- Martins Filho MV, Liccioti TT, Pereira GT, Marques Jr J, Sanchez RB. Perdas de solo e nutrientes por erosão num Argissolo com resíduos vegetais de cana-de-açúcar. Eng Agric. 2009;29:8-18.
- Panachuki E, Bertol I, Sobrinho TA, Oliveira PTS, Bicca DBR. Perdas de solo e de água e infiltração de água em Latossolo Vermelho sob sistemas de manejo. R Bras Ci Solo. 2011;35:1777-85.
- Pennock DJ, Jong E. The influence of slope curvature on soil erosion and deposition in Hummock terrain. Soil Sci. 1987;144:209-17.
- Raij Bvan. Fertilidade do solo e adubação. Piracicaba: Ceres; 1991.
- Sanchez RB, Marques Jr J, Souza ZM, Pereira GT, Martins Filho MV. Variabilidade espacial de atributos do solo e de fatores de erosão em diferentes pedoformas. Bragantia. 2009;68:1095-103.
- Santos HG, Jacomine PKT, Anjos LHC, Oliveira VA, Oliveira JB, Coelho MR, Lumbreras JF, Cunha TJF, Almeida JA, editores. Sistema brasileiro de classificação de solos. 3ª.ed. Rio de Janeiro: Embrapa Solos; 2013.
- Schick J, Bertol I, Balbinot JRAA, Batistela O. Erosão hídrica em Cambissolo Húmico alumínico submetido a diferentes sistemas de preparo e cultivo do solo: II. Perdas de nutrientes e carbono orgânico. R Bras Ci Solo. 2000;24:437-47.
- Seganfredo ML, Eltz FLF, Brum ACR. Perdas de solo, água e nutrientes por erosão em sistemas de culturas em plantio direto. R Bras Ci Solo. 1997;21:287-91.
- Silva AM, Silva MLN, Curi N, Lima JM, Avanzi JC, Ferreira MM. Perdas de solo, água, nutrientes e carbono orgânico em Cambissolo e Latossolo sob chuva natural. Pesq Agropec Bras. 2005;40:1223-30.
- Silva GRV, Souza ZM, Martins Filho MV, Barbosa RS, Souza GS. Soil, water and nutrient losses by interrill erosion from green cane cultivation. R Bras Ci Solo. 2012;36:963-70.
- Silva Júnior JF, Marques Júnior J, Camargo LA, Teixeira DDB, Panosso AR, Pereira GT. Simulação geoestatística na caracterização espacial de óxidos de ferro em diferentes pedoformas. R Bras Ci Solo. 2012;36:1690-703.
- Silva MAS, Griebeler NP, Borges LC. Uso de vinhaça e impactos nas propriedades do solo e lençol freático. R Bras Eng Agric Amb. 2007;11:108-14.
- Sun X, Wu S, Wang H, Zhao Y, Zhang G, Man YB, Wong MH. Uncertainty analysis for the evaluation of agricultural soil quality based on digital soil maps. Soil Sci Soc Am J. 2012;76:1379-89.
- Thornthwaite CW. An aproach towards a rationalclassification of climate. Geogr Rev. 1948;38:55-94.
- Troeh FR. Landform equations fitted to contour maps. Am J Sci. 1965;263:616-27.
- Volk LBS, Cogo NP. Inter-relação biomassa vegetal subterrânea-estabilidade de agregados-erosão hídrica em solo submetido a diferentes formas de manejo. R Bras Ci Solo. 2008;32:1713-22.
- Warrick AW, Nielsen DR. Spatial variability of soil physical properties in the field. In: Hillel D, editor. Applications of soil physics. New York: Academic; 1980. p.319-44.
- Wilding LP, Drees LR. Spatial variability and pedology. In: Wilding LP, Smeck NE, Hall GF, editors. Pedogenesis and soil taxonomy: concepts and interactions. New York: Elsevier; 1983. p.83-116.
- Zhao Y, Xu X, Darilek J, Huang B, Sun W, Shi X. Spatial variability assessment of soil nutrients in an intense agricultural area, a case study of Rugao County in Yangtze River Delta Region, China. Environ Geol. 2009;57:1089-102.
Publication Dates
-
Publication in this collection
Jul-Aug 2015
History
-
Received
17 July 2014 -
Accepted
20 Feb 2015


