ABSTRACT
Recycling of carbon (C) and nitrogen (N) from plants into soils is decisive for maintaining soil organic matter and soil fertility. Therefore, we quantified plant biomass and C and N in the shoots and roots from the topsoil layer for a wide range of annual crops grown under subtropical conditions. We grew 26 species, 13 main crops, and 13 cover crops, in the field in standard sowing arrangements. Root biomass was recovered from the 0.00-0.20 m soil layer at flowering, and shoot biomass was measured at flowering for all crops and at maturity only for the main crops. Root dry matter (DM) exhibited an average of 14.9 ± 5.7 % of the total shoot biomass at flowering, and the mean shoot DM to root DM ratio was 6.9 (2.8-15.0) for the 26 crops considered. Leguminous species had less root DM (0.5 to 1.0 Mg ha-1) than grass species (1.1 to 2.3 Mg ha-1). The shoot C to root C ratio varied consistently with DM, while the root N to shoot N ratio varied considerably among species. Proportionally more biomass, C, and N was allocated to the root systems of grasses (Poaceae species) than non-grass species (especially Fabaceae species). The findings of this study contribute to designing rotations to include species that promote cycling of N and have high potential for adding C to the soil through roots. In this sense, the use of intercropped grasses and legumes is a promising strategy, especially for cover crops.
biomass allocation; cover crops; Fabaceae; Poaceae; shoot to root ratio
INTRODUCTION
Agricultural soils are important components of terrestrial ecosystems. They allow food production but also help in reducing greenhouse gas emissions through C sequestration (Lal, 2004Lal R. Soil carbon sequestration to mitigate climate change. Geoderma. 2004;123:1-22. https://doi.org/10.1016/j.geoderma.2004.01.032
https://doi.org/10.1016/j.geoderma.2004....
). The quantity of nutrients produced and of C sequestered annually for a given soil mainly depends on the crops used, the environmental conditions, and management practices. The choice of crops and crop rotations have multiple effects, determining the pattern of soil covered by living or dead plant biomasses, total biomass production, the quantity and quality of the biomasses recycled, subsequent accumulation of C and nutrients, and their potential for recycling back to soils. This last effect is of primary importance, as plant biomass is the prime source for renewal of soil organic matter and plant rhizodeposition (Bolinder et al., 2007Bolinder MA, Janzen HH, Gregorich EG, Angers DA, VandenBygaart AJ. An approach for estimating net primary productivity and annual carbon inputs to soil for common agricultural crops in Canada. Agr Ecosyst Environ. 2007;118:29-42. https://doi.org/10.1016/j.agee.2006.05.013
https://doi.org/10.1016/j.agee.2006.05.0...
).
Allocation of plant biomass among the various vegetative parts (leaves, stems, and roots), the quality of the plant biomasses (chemical and physical traits of plants), and the links between quality and decomposability have received considerable attention, particularly in natural ecosystems (Cornelissen and Thompson, 1997Cornelissen JHC, Thompson K. Functional leaf attributes predict litter decomposition rate in herbaceous plants. New Phytol. 1997;135:109-14. https://doi.org/10.1007/BF02377145
https://doi.org/10.1007/BF02377145...
; De Deyn et al., 2008De Deyn GB, Cornelissen JHC, Bardgett RD. Plant functional traits and soil carbon sequestration in contrasting biomes. Ecol Lett. 2008;11:516-31. https://doi.org/10.1111/j.1461-0248.2008.01164.x
https://doi.org/10.1111/j.1461-0248.2008...
; Birouste et al., 2012Birouste M, Kazakou E, Blanchard A, Roumet C. Plant traits and decomposition: are the relationships for roots comparable to those for leaves? Ann Bot. 2012;109:463-72. https://doi.org/10.1093/aob/mcr297
https://doi.org/10.1093/aob/mcr297...
; Freschet et al., 2013Freschet GT, Cornwell WK, Wardle DA, Elumeeva TG, Liu W, Jackson BG, Onipchenko VG, Soudzilovskaia NA, Tao J, Cornelissen JHC. Linking litter decomposition of above- and below-ground organs to plant-soil feedbacks worldwide. J Ecol. 2013;101:943-52. https://doi.org/10.1111/1365-2745.12092
https://doi.org/10.1111/1365-2745.12092...
). Functional traits of plants, in particular, can express plant strategy regarding resource exploitation (e.g., light and nutrients) (Poorter et al., 2012Poorter H, Niklas KJ, Reich PB, Oleksyn J, Poot P, Mommer L. Biomass allocation to leaves, stems and roots: meta-analyses of interspecific variation and environmental control. New Phytol. 2012;193:30-50. https://doi.org/10.1111/j.1469-8137.2011.03952.x
https://doi.org/10.1111/j.1469-8137.2011...
; Freschet et al., 2015Freschet GT, Swart EM, Cornelissen JHC. Integrated plant phenotypic responses to contrasting above- and below-ground resources: key roles of specific leaf area and rootmass fraction. New Phytol. 2015;206:1247-60. https://doi.org/10.1111/nph.13352
https://doi.org/10.1111/nph.13352...
). In agricultural systems, interspecific variations in biomass allocation have been studied relatively little (Tribouillois et al., 2015Tribouillois H, Cruz P, Cohan J-P, Justes E. Modelling agroecosystem nitrogen functions provided by cover crop species in bispecific mixtures using functional traits and environmental factors. Agr Ecosyst Environ. 2015;207:218-28. https://doi.org/10.1016/j.agee.2015.04.016
https://doi.org/10.1016/j.agee.2015.04.0...
); notably, the root component has long been neglected, due to lack of economic stake. It is also much harder to quantify root biomass compared to shoots and to study its decomposition in soils. The situation has changed over the past 15 years and an increasing aim is to manage and, if possible, increase the potential for root-derived C stabilization in soil (Dos Santos et al., 2011Santos NZ, Diecklow J, Bayer C, Molin R, Favaretto N, Pauletti V, Piva JT. Forages, cover crops and related shoot and root additions in no-till rotations to C sequestration in a subtropical Ferralsol. Soil Till Res. 2011;111:208-18. https://doi.org/10.1016/j.still.2010.10.006
https://doi.org/10.1016/j.still.2010.10....
; Katterer et al., 2011Kätterer T, Bolinder MA, Andrén O, Kirchmann H, Menichetti L. Roots contribute more to refractory soil organic matter than above-ground crop residues, as revealed by a long-term field experiment. Agr Ecosyst Environ. 2011;141:184-92. https://doi.org/10.1016/j.agee.2011.02.029
https://doi.org/10.1016/j.agee.2011.02.0...
; Sanaullah et al., 2011Sanaullah M, Chabbi A, Leifeld J, Bardoux G, Billou D, Rumpel C. Decomposition and stabilization of root litter in top- and subsoil horizons: what is the difference? Plant Soil. 2011;338:127-41. https://doi.org/10.1007/s11104-010-0554-4
https://doi.org/10.1007/s11104-010-0554-...
; Menichetti et al., 2015Menichetti L, Ekblad A, Kätterer T. Contribution of roots and amendments to soil carbon accumulation within the soil profile in a long-term field experiment in Sweden. Agr Ecosyst Environ. 2015;200:79-87. https://doi.org/10.1016/j.agee.2014.11.003
https://doi.org/10.1016/j.agee.2014.11.0...
), as well as set up alternative cropping systems with crop rotations (Naudin et al., 2012Naudin K, Scopel E, Andriamandroso ALH, Rakotosolofo M, Ratsimbazafy NRSA, Rakotozandriny JDN, Salgado P, Giller KE. Trade-offs between biomass use and soil cover. The case of rice-based cropping systems in the Lake Alaotra region of Madagascar. Expl Agric. 2012;48:194-209. https://doi.org/10.1017/S001447971100113X
https://doi.org/10.1017/S001447971100113...
; Valbuena et al., 2012Valbuena D, Erenstein O, Tui SH-K, Abdoulaye T, Claessens L, Duncan AJ, Gérard B, Rufino MC, Teufel N, van Rooyen A, van Wijk MT. Conservation agriculture in mixed crop-livestock systems: scoping crop residue trade-offs in Sub-Saharan Africa and South Asia. Field Crop Res. 2012;132:175-84. https://doi.org/10.1016/j.fcr.2012.02.022
https://doi.org/10.1016/j.fcr.2012.02.02...
) and optimize the trade-off between several ecosystem services (Tribouillois et al., 2015Tribouillois H, Cruz P, Cohan J-P, Justes E. Modelling agroecosystem nitrogen functions provided by cover crop species in bispecific mixtures using functional traits and environmental factors. Agr Ecosyst Environ. 2015;207:218-28. https://doi.org/10.1016/j.agee.2015.04.016
https://doi.org/10.1016/j.agee.2015.04.0...
). Even in agricultural systems, which are highly managed compared to natural systems, a better understanding of the allocation of biomass to shoots and roots for annual crops is a key issue to better predict soil C and nutrient dynamics and the effects of agrosystem management on soil C stabilization. This issue is relevant not only in systems where crop residues are exported but also to some extent in no-till agricultural systems, where aboveground residues are left at the soil surface as mulch and where plant roots represent the only entry of organic matter in depth (Zibilske et al., 2005).
Root dry matter (DM) may represent 23 to 45 % of the total DM of crops (Prakash et al., 2002Prakash V, Kundu S, Ghosh BN, Singh RD, Gupta HS. Annual carbon input to soil through rainfed soybean (Glycine max) - wheat (Triticum aestivum) cropping sequence in mid-hills of North-West Himalaya. Indian J Agr Sci. 2002;72:14-7.). The ratio of shoot to root DM (S:R) or of root to shoot DM (R:S) varies across families and species (Xu and Juma, 1993Xu JG, Juma NG. Above- and below-ground transformation of photosynthetically fixed carbon by two barley (Hordeum vulgare L.) cultivars in a Typic Cryoboroll. Soil Biol Biochem. 1993;25:1263-72. https://doi.org/10.1016/0038-0717(93)90223-X
https://doi.org/10.1016/0038-0717(93)902...
; Roumet et al., 2008Roumet C, Lafont F, Sari M, Warembourg F, Garnier E. Root traits and taxonomic affiliation of nine herbaceous species grown in glasshouse conditions. Plant Soil. 2008;312:69-83. https://doi.org/10.1007/s11104-008-9635-z
https://doi.org/10.1007/s11104-008-9635-...
), growing conditions, and phenological stage (Bolinder et al., 1997Bolinder MA, Angers DA, Dubuc JP. Estimating shoot to root ratios and annual carbon inputs in soils for cereal crops. Agr Ecosyst Environ. 1997;63:61-6. https://doi.org/10.1016/S0167-8809(96)01121-8
https://doi.org/10.1016/S0167-8809(96)01...
; Plaza-Bonilla et al., 2014Plaza-Bonilla D, Álvaro-Fuentes J, Hansen NC, Lampurlanés J, Cantero-Martínez C. Winter cereal root growth and aboveground-belowground biomass ratios as affected by site and tillage system in dry land Mediterranean conditions. Plant Soil. 2014;374:925-39. https://doi.org/10.1007/s11104-013-1926-3
https://doi.org/10.1007/s11104-013-1926-...
). The root N content generally represents 10-15 % of the total plant N (Kumar and Goh, 2000Kumar K, Goh KM. Biological nitrogen fixation, accumulation of soil nitrogen and nitrogen balance for white clover (Trifolium repens L.) and field pea (Pisum sativum L.) grown for seed. Field Crop Res. 2000;68:49-59. https://doi.org/10.1016/S0378-4290(00)00109-X
https://doi.org/10.1016/S0378-4290(00)00...
), but in legume species, it can reach 40 % of the total plant N (Rochester et al., 1998Rochester IJ, Peoples MB, Constable GA, Gault R. Faba beans and other legumes add nitrogen to irrigated cotton cropping systems. Australian J Exp Agr. 1998;38:253-60. https://doi.org/10.1071/EA97132
https://doi.org/10.1071/EA97132...
). Currently, sufficient data are not available on root biomass and root-C and root-N inputs from annual crops, especially for cover crops in farming systems. Recent studies have referred to such estimates, including studies that take root contributions and the rate of humification of roots into account (Katterer et al., 2011Kätterer T, Bolinder MA, Andrén O, Kirchmann H, Menichetti L. Roots contribute more to refractory soil organic matter than above-ground crop residues, as revealed by a long-term field experiment. Agr Ecosyst Environ. 2011;141:184-92. https://doi.org/10.1016/j.agee.2011.02.029
https://doi.org/10.1016/j.agee.2011.02.0...
; Menichetti et al., 2015Menichetti L, Ekblad A, Kätterer T. Contribution of roots and amendments to soil carbon accumulation within the soil profile in a long-term field experiment in Sweden. Agr Ecosyst Environ. 2015;200:79-87. https://doi.org/10.1016/j.agee.2014.11.003
https://doi.org/10.1016/j.agee.2014.11.0...
). However, most of these studies were based on a relatively small number of measurements of root biomasses or used production estimates with average coefficients (harvest index, shoot to root ratios, average C content, etc.). Limited availability of information forces the routine use of few results and their means as a reference to estimate the inputs of C and N in the soil (Bolinder et al., 2007Bolinder MA, Janzen HH, Gregorich EG, Angers DA, VandenBygaart AJ. An approach for estimating net primary productivity and annual carbon inputs to soil for common agricultural crops in Canada. Agr Ecosyst Environ. 2007;118:29-42. https://doi.org/10.1016/j.agee.2006.05.013
https://doi.org/10.1016/j.agee.2006.05.0...
; Boddey et al., 2010Boddey RM, Jantalia CP, Conceição PC, Zanatta JA, Bayer C, Mielniczuk J, Dieckow J, Santos HP, Denardin JE, Aita C, Giacomini SJ, Alves BJR, Urquiaga S. Carbon accumulation at depth in Ferralsols under zero-till subtropical agriculture. Glob Change Biol. 2010;16:784-95. https://doi.org/10.1111/j.1365-2486.2009.02020.x
https://doi.org/10.1111/j.1365-2486.2009...
; Dos Santos et al., 2011Santos NZ, Diecklow J, Bayer C, Molin R, Favaretto N, Pauletti V, Piva JT. Forages, cover crops and related shoot and root additions in no-till rotations to C sequestration in a subtropical Ferralsol. Soil Till Res. 2011;111:208-18. https://doi.org/10.1016/j.still.2010.10.006
https://doi.org/10.1016/j.still.2010.10....
). This motivated the approach adopted here, namely, estimation of crop residues (roots and shoots) for a wide diversity of crops, representing virtually all crops of the area of this study and comparing crops grown under identical climate and soil conditions, except for fertilization, which was applied only to crops that are generally fertilized.
Since plant species and family are primary factors in determining biomass allocation to shoots and roots, we hypothesized that Poaceae species (Gramineae) would exhibit a greater relative accumulation of C in root system compared to other species. The objective of this study was to assess the contribution of roots and shoots to the recycling of C and N in the topsoil layer for a large range of crops used either as main crops or cover crops in no-tilled agricultural systems under subtropical conditions.
MATERIALS AND METHODS
Description of the site and cropping system
The field study was conducted in an experimental area (29° 43’ 13” S, 53° 42’ 19” W, altitude 88 m) of the Department of Soil Science, Federal University of Santa Maria in the state of Rio Grande do Sul, Brazil. The agricultural area is characterized by biannual crop rotation, with two main crops (or a main crop and a cover crop) sown in the autumn and then in the spring, or with a cover crop grown in the summer between the two main crops. The climate is subtropical humid with hot summers, with annual rainfall of 1,686 mm, and mean annual air temperature of 19.3 °C. The soil is classified as a Typic Hapludalf (Soil Survey Staff, 2014), which corresponds to an Argissolo Vermelho Distrófico arênico (Santos et al., 2013Santos HG, Jacomine PKT, Anjos LHC, Oliveira VA, Oliveira JB, Coelho MR, Lumbreras JF, Cunha TJF. Sistema brasileiro de classificação de solos. 3a ed. Rio de Janeiro: Embrapa Solos; 2013.). The main soil properties are shown in table 1.
Crop species and crop management
Twenty-six species of annual crops were used, as follows: 11 grasses (Poaceae) and 15 non-grasses (Fabaceae, 11; Asteraceae, 1; Brasicaceae, 2; Euphorbiaceae, 1) (Table 2). Thirteen of the species were cropped as main crops, and the other 13 were cropped as cover crops. The main crops and cover crops were cultivated either during spring-summer or during autumn-winter. Cover crops were all harvested at flowering, which corresponds to the stage of cutting of cover crops in fields. All species were grown in soil with a consolidated no-till system (over 12 years) and without the use of irrigation. The species were sown in 20 m2 (4 × 5 m) plots with three replicates, distributed in a randomized experimental design. Sowing was carried out manually to achieve greater uniformity and distribution of the plants in rows. For species sown in seed holes (jack bean, castor bean, and gray mucuna), we used four seeds per seed hole; after seedling emergence, only two plants were left in each plant hill. The row spacing, and density of plant species depended on the species and ranged from 0.17 to 0.90 m and from 3 to 420 plants per m2, respectively, according to farmers’ practices in the area (Table 2). All the crops were managed according to technical recommendations for the area. Weed control was performed manually during the early stage of plant growth.
Shoot and root sampling and analysis
The roots of all species were collected during the reproductive stage corresponding to full flowering of the plants. The sampling stage was chosen as the time that best represented root system weight and composition, i.e., at the beginning of plant senescence (e.g., Amos and Walters, 2006Amos B, Walters DT. Maize root biomass and net rhizodeposited carbon: an analysis of the literature. Soil Sci Soc Am J. 2006;70:1489-503. https://doi.org/10.2136/sssaj2005.0216
https://doi.org/10.2136/sssaj2005.0216...
). The biomass of aboveground parts (shoots) was measured both at flowering and at physiological maturity for the primary crops, and at flowering for the cover crops. In both cases, measurement always included the actual date of crop harvest in the fields.
The plants were collected on an average of 0.48 linear meters per block, except for oilseed radish, ryegrass, and rye, which were collected on 1.1 linear meters to increase the representativeness of the biomasses collected. The number of plants collected ranged from 2 to 54, depending on the distance between the rows and the plant density (Table 2). The roots were collected from the top 0.00-0.20 m soil layer of the same crop plot, with three replicates per species. This approach was chosen because it is impossible to quantitatively determine the roots throughout the rooting depth, particularly for many crop species, such as those in this study. Studies in the literature showed that the root mass present in the topsoil for annual crops accounted for over 70 % of the total root mass of the plant (Buyanovsky and Wagner, 1986Buyanovsky GA, Wagner GH. Post-harvest residue input to cropland. Plant Soil. 1986;93:57-65. https://doi.org/10.1007/BF02377145
https://doi.org/10.1007/BF02377145...
; Bolinder et al., 1997Bolinder MA, Angers DA, Dubuc JP. Estimating shoot to root ratios and annual carbon inputs in soils for cereal crops. Agr Ecosyst Environ. 1997;63:61-6. https://doi.org/10.1016/S0167-8809(96)01121-8
https://doi.org/10.1016/S0167-8809(96)01...
; Giacomini et al., 2009Giacomini SJ, Aita C, Jantalia CP, Urquiaga S. Aproveitamento pelo milho do nitrogênio amoniacal de dejetos líquidos de suínos em plantio direto e preparo reduzido do solo. Pesq Agropec Bras. 2009;44:761-8. https://doi.org/10.1590/S0100-204X2009000700017
https://doi.org/10.1590/S0100-204X200900...
; Williams et al., 2013Williams JD, McCool DK, Reardon CL, Douglas Jr CL, Albrecht SL, Rickman RW. Root:shoot ratios and belowground biomass distribution for Pacific Northwest dryland crops. J Soil Water Conserv. 2013;68:349-60. https://doi.org/10.2489/jswc.68.5.349
https://doi.org/10.2489/jswc.68.5.349...
). We therefore selected this approach, which accounts for most of the recycling of roots in the soil surface layers but neglected the potential stabilization of root-derived C in deeper layers (Sanaullah et al., 2011Sanaullah M, Chabbi A, Leifeld J, Bardoux G, Billou D, Rumpel C. Decomposition and stabilization of root litter in top- and subsoil horizons: what is the difference? Plant Soil. 2011;338:127-41. https://doi.org/10.1007/s11104-010-0554-4
https://doi.org/10.1007/s11104-010-0554-...
).
An excavation method was used to collect the roots. The excavation consisted of opening a pit in the soil (areas from 0.09 to 0.36 m2) to a depth of 0.20 m, perpendicular to the planting row; the width of the trench was equal to the distance between two rows (from 0.17 to 0.90 m, depending on the crop), and half the trench was located on each side of the plant row (Table 2). The vertical distribution of roots in the topsoil was determined by separately sampling the 0.00-0.10 and 0.10-0.20 m depth layers. The horizontal distribution of the root biomass of the spring species was evaluated in the 0.00-0.10 m soil layer. To do so, the collection area of the roots was divided into two portions (50/50) at increasing distances from plant rows or initial seed holes.
Afterwards, the monoliths (soil + roots) were transported to the laboratory, the main roots were first removed from the soil manually, and then the entire soil sample was washed under running water over a 1-mm mesh sieve. After collection, the shoots and roots, nodule-free roots for legume species, were dried at 65 °C to constant weight. The dried roots were separated manually according to their diameter (Ø) as either coarse roots (Ø ≥2 mm) or fine roots (1< Ø <2 mm). The dried residues of the shoots and roots were finely ground (<1 mm) using a Wiley mill. A 1-g subsample of the ground material was incinerated in a muffle furnace at 550 °C for 4 h to determine the ash content and to express the results free of ash. The total organic C and total N contents of the shoots and roots were determined from the finely ground subsamples dried at 65 °C using an elemental analyzer (FlashEA 1112, Thermo Electron Corporation, Milan, Italy). The amount of C (QC) and N (QN) in the roots and the shoots were obtained by multiplying the content of the elements by the amount of dry matter (DM) of roots and shoots produced per hectare.
Data treatment and statistical analyses
Calculations were performed to express the interspecific plant allocation to above- and below-ground fractions. First, the leaf, stem, and root mass fractions (LMF, SMF, and RMF), i.e., the weight of the various organs expressed relative to the total weight of the vegetative parts of the plant, were plotted against the shoot + root DM for all crops (Poorter et al., 2012Poorter H, Niklas KJ, Reich PB, Oleksyn J, Poot P, Mommer L. Biomass allocation to leaves, stems and roots: meta-analyses of interspecific variation and environmental control. New Phytol. 2012;193:30-50. https://doi.org/10.1111/j.1469-8137.2011.03952.x
https://doi.org/10.1111/j.1469-8137.2011...
). The ratio of the shoot DM to root DM (SDM:RDM) was calculated by dividing the total DM of the shoots by the total DM of the roots measured in the 0.00-0.20 m layer, both measured at the flowering stage for all of the crops. For the main crops, the SDM:RDM ratios were also calculated at maturity. The shoot C to root C (SC:RC) and the shoot N to root N (SN:RN) ratios were calculated by dividing the QC and QN in the shoots, measured at the flowering stage for the cover crops and at the maturity stage for the main crops, by the QC and QN in the roots measured at the flowering stage for all of the crops. As the ratios were not normally distributed, we calculated the mean S:R ratios after a log2 transformation of the individual crop species ratio and then expressed the back-transformed mean S:R according to Poorter and Sack (2012)Poorter H, Sack L. Pitfalls and possibilities in the analysis of biomass allocation patterns in plants. Front Plant Sci. 2012;3:259. https://doi.org/10.3389/fpls.2012.00259
https://doi.org/10.3389/fpls.2012.00259...
. Lastly, the root mass fraction (0.00-0.20 m layer) was also plotted against the total shoot mass fraction for each species. This type of analysis avoids the problem of the ratio approach, where two ratios could be equal with very different values in the numerators and denominators (Poorter and Sack, 2012Poorter H, Sack L. Pitfalls and possibilities in the analysis of biomass allocation patterns in plants. Front Plant Sci. 2012;3:259. https://doi.org/10.3389/fpls.2012.00259
https://doi.org/10.3389/fpls.2012.00259...
).
The percentage of fine roots (%RF) was calculated as the DM of the roots 1< Ø <2 mm relative to the total DM of the roots recovered. The percentage of roots present in the 0.00-0.10 m depth layer relative to the total root DM recovered in the 0.00-0.20 m depth layer was also calculated.
A principal component analysis (PCA) was conducted on the correlation matrix obtained from the results of the root biomass (i.e., %R0-10 and %RF), the root-C and N contents (i.e., QC and QN), the S:R ratios (i.e., SC:RC and SN:RN), and the total N content (%N). The PCA produced an ordination of the species and the properties of the roots, which were plotted in one and two dimensions, respectively, based on the scores of the first two principal components (PCs). A correlation circle was computed to assess the importance of each property of the roots in the PC axes. We considered r values (i.e., the correlation coefficient) as a significant contributor when r ≥0.5.
The data were analyzed via a two-way analysis of variance (Anova). The means of the treatments were compared using the Scott-Knott test at 5 % probability. The statistical tests were performed using Statistica® software (version 7.0).
RESULTS
Biomass allocation in the shoots and roots
The DM production in the shoots varied greatly among the 26 species studied, from 2.4 Mg ha-1 DM for oilseed rape to 12.2 Mg ha-1 DM for pigeonpea, plus a high value of 22.5 Mg ha-1 DM for millet (Table 3). At flowering, the DM accumulation in the plant shoots did not distinguish the main crops from the cover crops and the grasses from the non-grasses when millet was discarded from the analysis, due to its very high shoot DM production (Table 3). However, the summer crops produced significantly greater shoot DM during flowering compared to the winter crops. Regarding the main crops, which were sampled both at the flowering and the maturity stages, the general pattern was an average decrease in the shoot DM between flowering and maturity, although this decrease was not significant for wheat, rye, triticale, and white oat when considered individually. The accumulation of roots Ø ≥1 mm in the 0.00-0.20 m soil layer varied considerably depending on the species and ranged from 0.53 Mg ha-1 for castor bean up to 1.85 Mg ha-1 for sunflower and black oat (Table 3). Analyzing the average values of the root DM, we observed that the cover crops produce 22 % less root DM than the main crops, that grasses produced 1.6 times more DM than non-grasses, and that winter species produce 10 % more root DM than summer species.
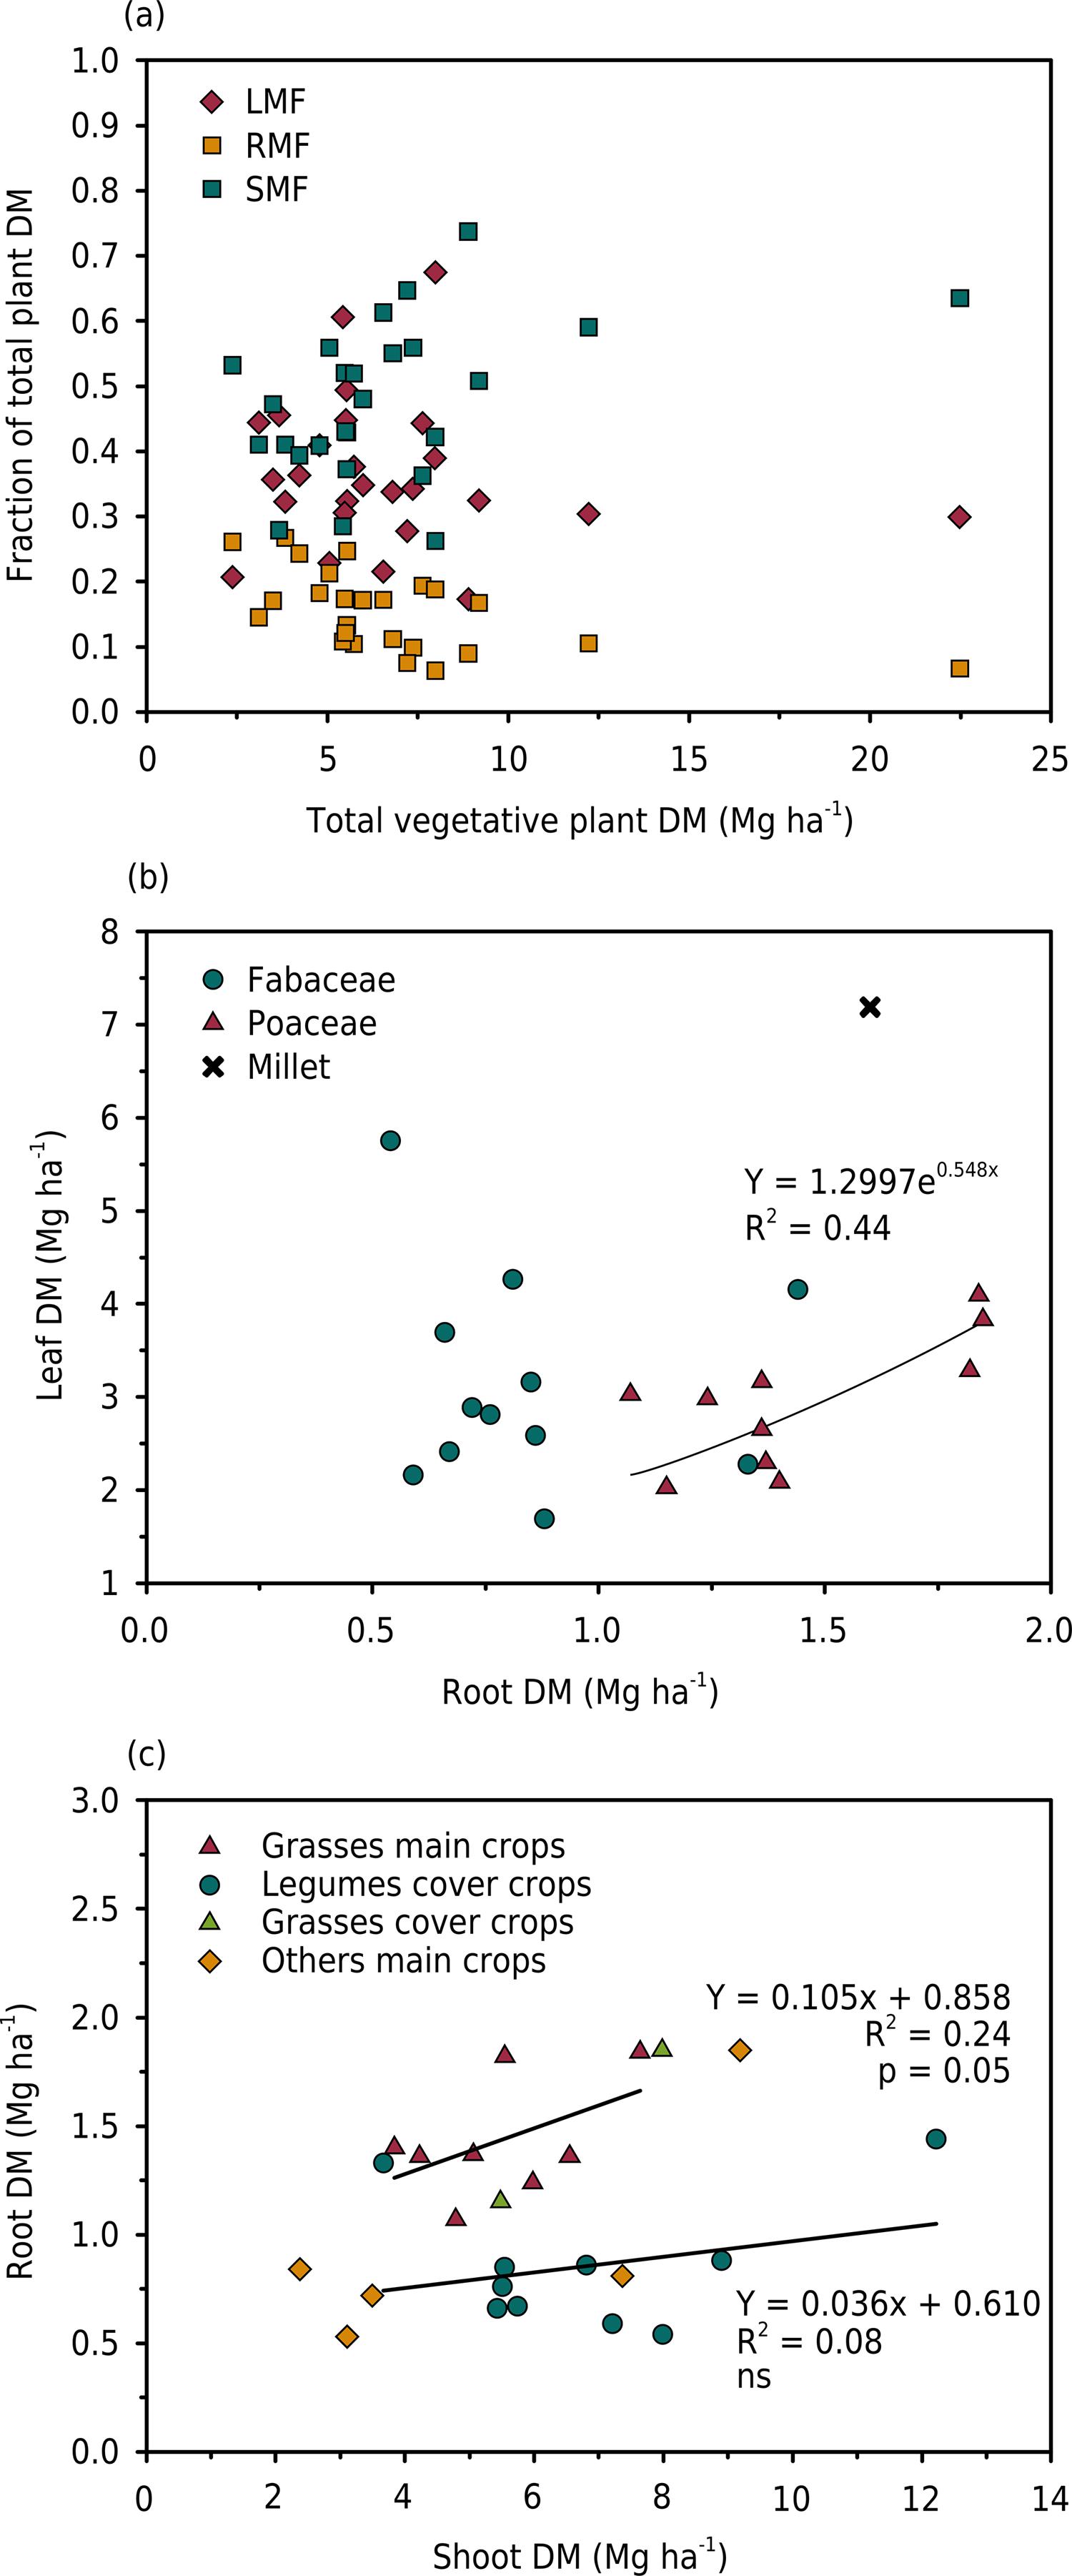
The fraction of total plant DM of leaf (LMF), stem (SMF), and root (RMF) for all species at flowering is presented in figure 1a. The LMF ranged from 0.27 to 0.53 in main crops and from 0.17 to 0.67 in cover crops. The SMF ranged from 0.34 to 0.52 in main crops and from 0.26 to 0.74 in cover crops. The RMF in main crops ranged from 0.08 to 0.25 and in cover crops from 0.06 to 0.27.
Allocation of plant dry matter biomass (DM): (a) proportion of leaf (LMF), stem (SMF), and root (RMF) to total vegetative biomass (leaf + stem + root) at the flowering stage; (b) relationships between leaf and root biomass at the flowering stage for the Poaceae and Fabaceae species; (c) relationships between root biomass and shoot biomass at flowering or maturity stages for the different crops.
The allocation of biomass to the leaf from the root reveals the plant strategy for resource acquisition. At flowering (Figure 1b), the root DM of the Fabaceae crops was, on average, lower than the root DM of species from the Poaceae family. Additionally, for similar leaf DM, the Poaceae species invested more in the roots compared to the Fabaceae species. For the Poaceae species, there was a significant relationship between leaf and root DM (except for millet), whereas there was no relationship within the group of Fabaceae species. Pooling data for flowering and maturity stages for all species (Figure 1c), there was a linear relationship between root DM and shoot DM for the Poaceae species (harvested either at the flowering or maturity stage). Conversely, there were no relationships among other species (Fabaceae family and others), due to small changes in root DM, which ranged from 0.5 to 1.0 Mg ha-1, regardless of shoot production. There was no influence of harvest time on the pattern observed, with Poaceae species harvested at flowering having the same relationship as other Poaceae species harvested at maturity.
The SDM:RDM ratio ranged from 2.8 (vetch) to 15.0 (jack bean) at flowering time (Table 4). At flowering, SDM:RDM > 10, i.e., a low root DM compared to the shoot DM, was observed for millet, crotalaria juncea, showy rattlebox, and jack bean. For main crops measured at both the flowering and maturity stages, the SDM:RDM tended to be slightly lower at maturity (except for soybean), although the differences were not significant. For the grass species (Poaceae family), the mean SDM:RDM was 5.4 and was significantly lower compared to other non-grass species (8.3). The mean SDM:RDM was much lower for the main crops compared to the cover crops and for the winter crops compared to the summer crops.
Carbon and nitrogen contents in shoots and roots
In general, the accumulation of shoot C followed the total DM and ranged from 1.13 (oilseed rape) to 10.33 (millet) Mg ha-1 C (Table 3). Both the shoot N content and the total N accumulation in the shoots were two to three times greater in the cover crops compared to the main crops, as expected; the cover crops were primarily legumes (only three grass species were used as cover crops), but also harvested and recycled at their flowering stages, when the N content in the plant tissues was higher. The cropping period (summer vs. winter) did not discriminate shoot N content, but the total amount of N accumulated was much higher for the summer crops due to their high shoot DM.
The main crops had significantly higher amounts of root DM and C (in the 0.00-0.20 m layer) compared to the cover crops (Table 3), which corresponded to higher amounts in roots for the grass crops (mean 668 kg ha-1 C) compared to the non-grass crops (mean 413 kg ha-1 C). There were significant differences between the species grown in the summer and those grown in the winter (497 vs. 542 kg ha-1 C). Nitrogen accumulation in the roots ranged from approximately 5 (castor bean, showy rattlebox, and oilseed rape) to 50 kg ha-1 N (vetch) and clearly differentiated the crop species. The grasses, which had high root DM, had lower N content in their roots than the non-grass species, which reduced the difference in the root N accumulation between the grasses and non-grasses. Vetch plants were an exception, which combined high root DM and very high N content of the roots.
As expected, the SC:RC ratio varied consistently with the SDM:RDM (Table 4). Regarding N distribution between shoots and roots, the ratio varied considerably among species by a factor of approximately 5, with a lower SN:RN for the grass species (mean at 2.7) compared to the non-grass species (mean at 12.5). This arises from the combination of a lower mean N accumulation in the grass shoots compared to the non-grasses shoots and a higher DM and accumulated N in the grass roots compared to the non-grass roots. This translates into a large difference in SN:RN between the main crops and the cover crops, and between the winter crops and the summer crops. In the non-grass species, vetch exhibited an SN:RN that was 5 times lower than the mean value observed for the other species of this group of plants, due to its low accumulation of N in the shoots compared to N in the roots (Table 4). Although these differences are also the fruit of the dates of cutting of crops (at maturity for the main crops, at flowering for cover crops), these large differences in the S:R for N well reflect the differences in the potential N recycling of these species.
Root traits
The plants differed greatly in their proportion of fine roots (Table 3), with grasses exhibiting primarily fine roots, in contrast with non-grasses, which were characterized by a root system composed of approximately 60 % of root DM as coarse roots (Ø ≥2 mm). Within the group of grass species studied, the exceptions were corn, sorghum, and millet, which had root systems consisting of approximately 45 % coarse roots and, within the group of non-grass species, pea and vetch, which had 100 % fine roots. The highest N content in the root tissues was observed for pea, vetch, and gray mucuna. For the others species, the root N contents ranged from 5.2 to 18.0 g kg-1, with large variation among species. The differences observed in the N content of the root tissues explain the wide variation in the C:N ratio of the roots (from 12 for vetch roots to 90 for sunflower roots) (Table 3). Small but significant differences in the C:N ratio were observed between summer and winter crops, grasses and non-grasses, and main and cover crops.
Regardless of species, on average, 84 % of the total root DM recovered in the top 0.20 m of the soil was present in the 0.00-0.10 m layer, ranging from 64 % for blue lupine to 96 % for millet (Table 3). The proportion of roots in the soil surface layer was slightly but significantly higher for grasses compared to non-grasses (89 vs. 80 %). The spatial distribution of the roots in the top 0.00-0.10 m layer, which was analyzed for the summer crops only, showed that more than 80 % of the root DM was concentrated near the rows or the seed holes (mean 90 ± 4 %) (Figure 2).
Relative horizontal distribution of root dry matter (DM) in the 0.00-0.10 m soil layer, either near the plant row (or seed hole) (red bars) or between rows (green bars), determined for crops grown in the spring/summer (% of total DM in the layer). Species: Sh = sunn hemp; Sr = showy rattlebox; B = dry edible bean; Jb = jack bean; Gm = gray mucuna; S = soybean; Sw = sunflower; Cb = castor bean; C = corn; Sg = sorghum; Ml = millet. Means followed by the same letters for plant row (uppercase) or between rows (lowercase) do not differ significantly by the LSD test (p<0.05).
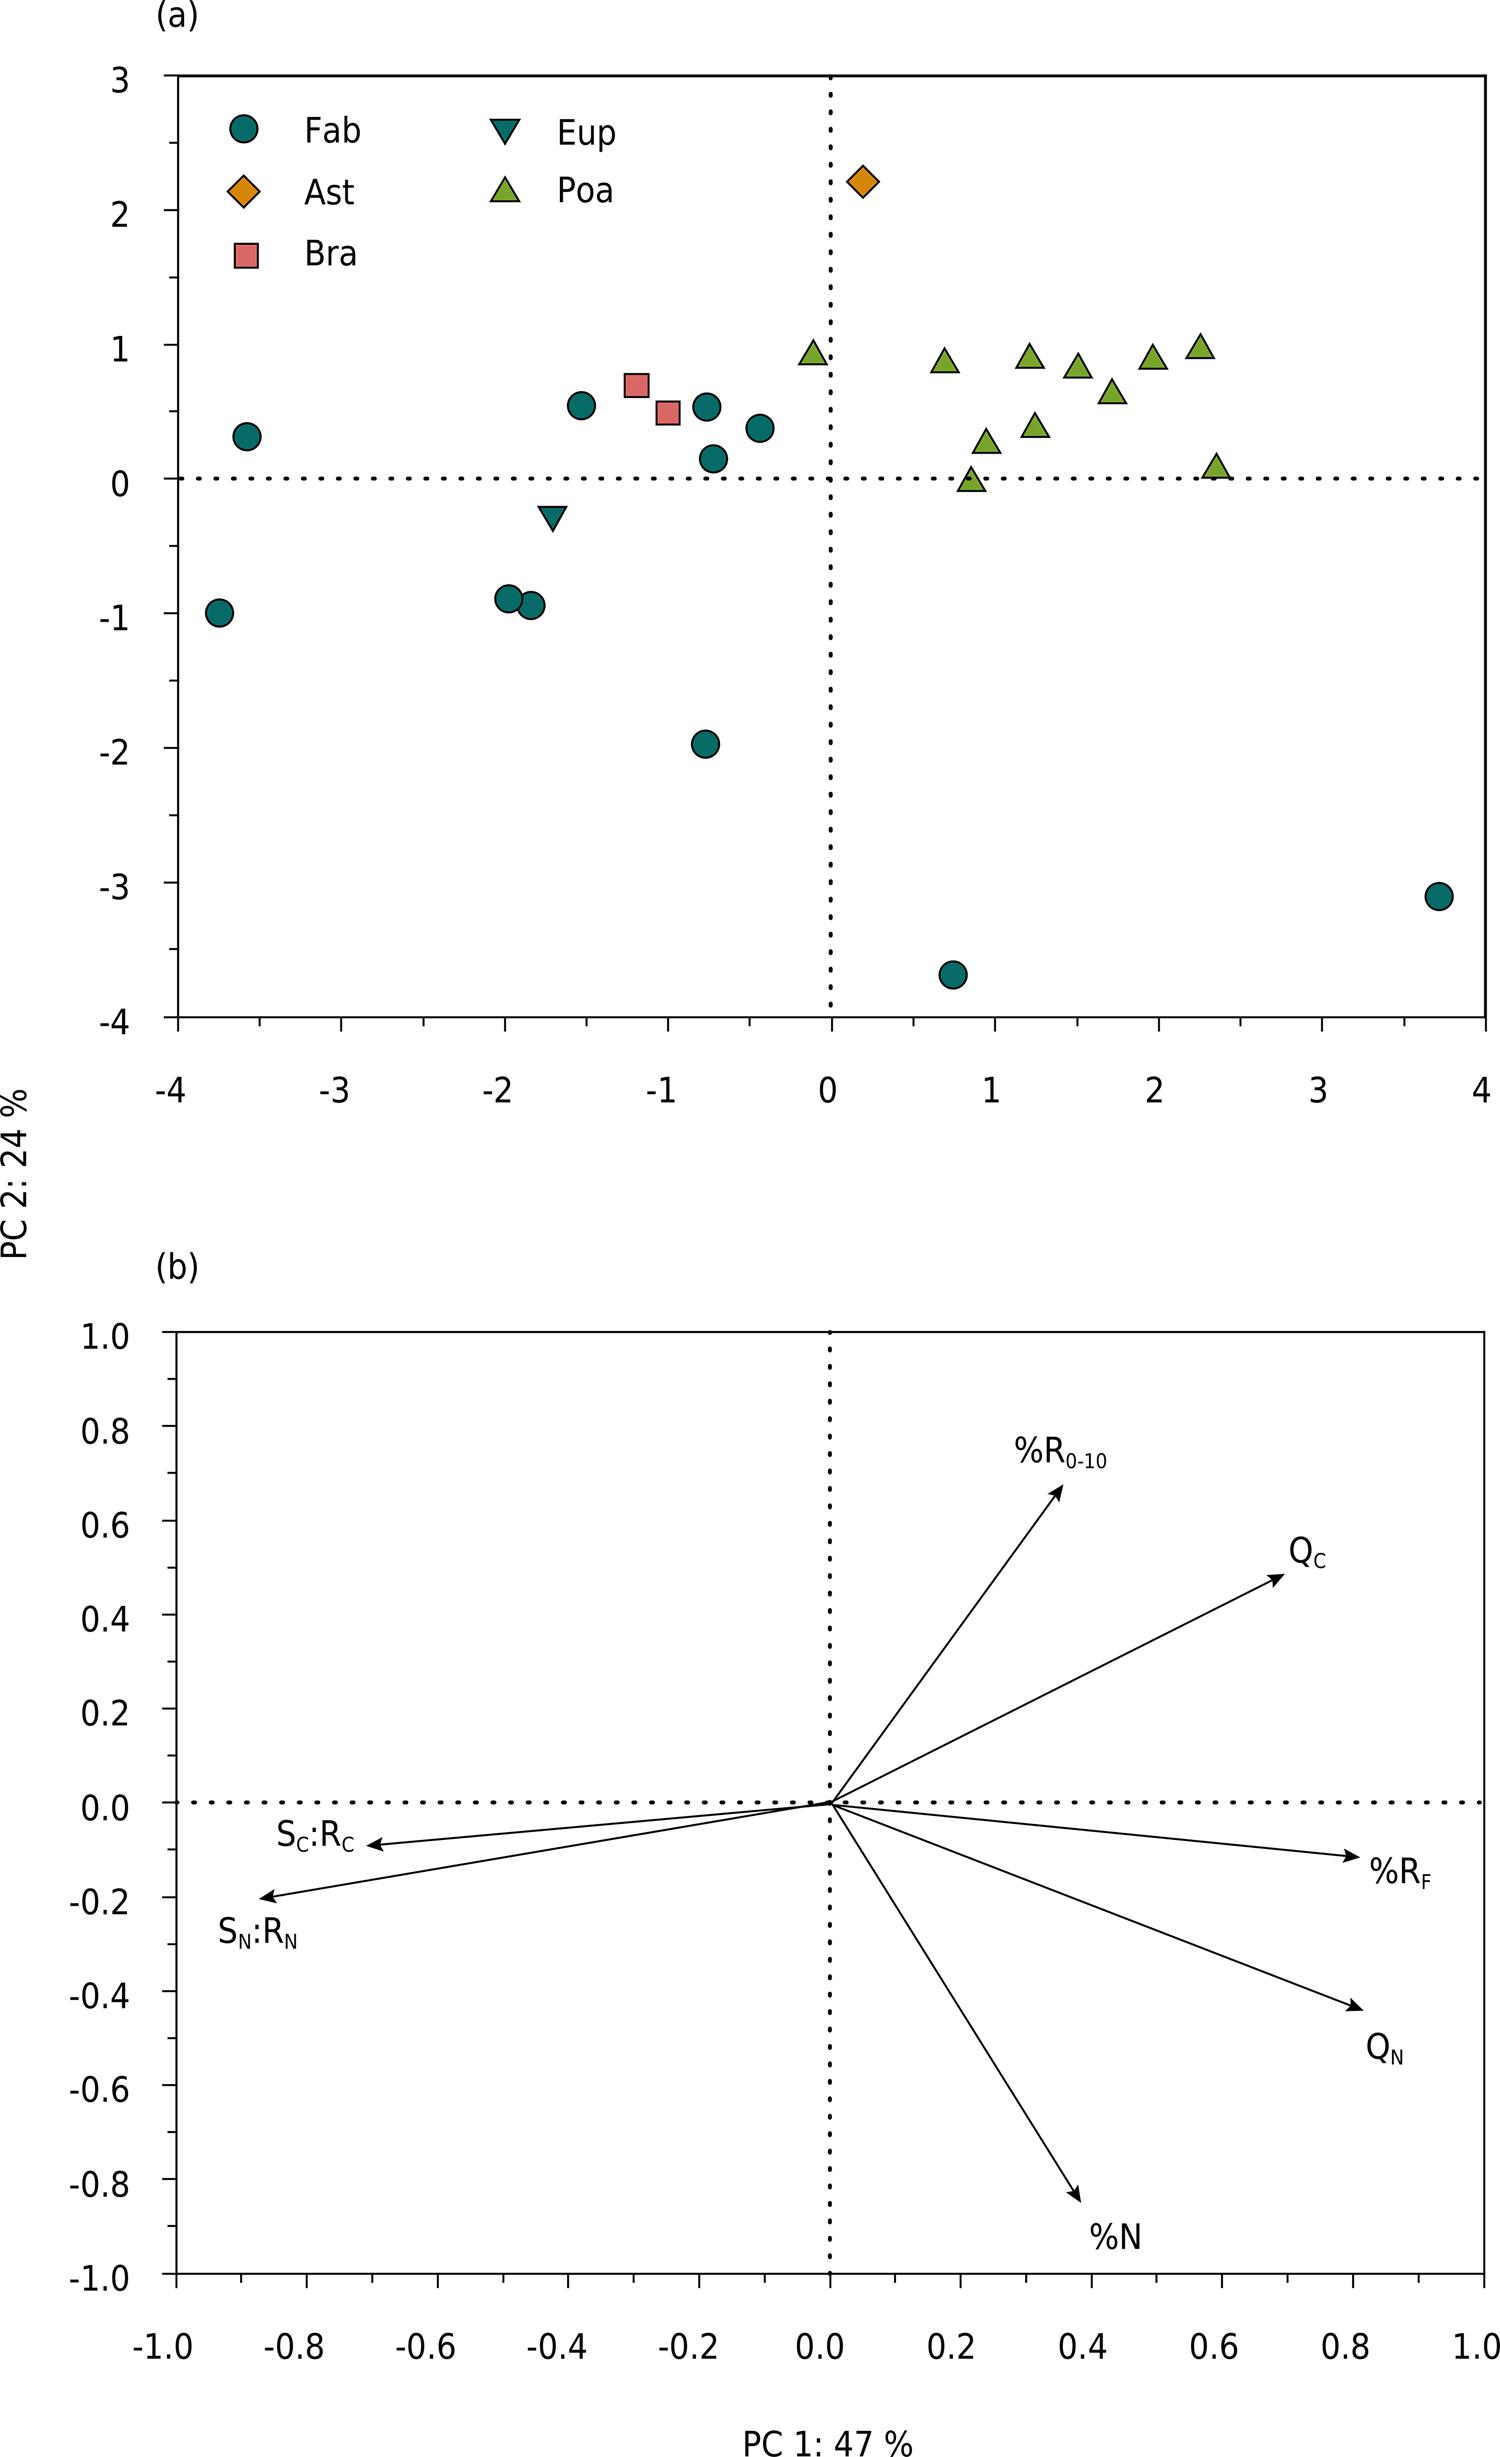
Principal component analysis (PCA) showed that the first two principal components (PC) accounted for 71 % of the total variance of the data (Figure 3). The PC 1 explained 48 % of the variance of the data and clearly discriminated the Poaceae (grass) species in the positive region (Figure 3a), which significantly correlated with the %RF, QN, and Qc (in the range r = 0.72 to 0.81) (Figure 3b). In PC 1, other plant species corresponded to the negative region, except the vetch and pea of Fabaceae, which strongly correlated with the SN:RN and SC:RC parameters (Figure 3b). The PC 2 explained 23 % of the variance of the data and identified the grass species primarily in the negative region of the PCA (Figure 3a), which were significantly correlated with the %R0-10 (r = -0.66) (Figure 3b). Vetch and pea were strongly correlated with %N. The %RF exhibited strong significant and negative correlation with SN/RN (r = -0.65; p<0.001), positive intermediate correlation with N (r = +0.59; p<0.01), and slight correlation with QC (r = +0.44; p<0.05) (Figure 3b). The %RF was not significantly correlated with the %N total in the roots. The %R0-10 was significantly correlated with C (r = +0.50; p<0.05).
Factorial map (PC 1 × PC 2) (a) and correlation circle (b) obtained from principal component analysis (PCA) performed using data from the roots of 27 species: vertical distribution (%R0.00-0.10), proportion of fine roots (%RF), root C and N contents (QC, QN), root N concentration (%N), and shoot:root ratio for N and C inputs (SN:RN and SC:RC). Fab = Fabaceae; Poa = Poaceae; Ast = Asteraceae; Bra = Brassicaceae; Eup = Euphorbiaceae.
DISCUSSION
Root and stem production exhibited great diversity in the biomass DM among the different species. In particular, millet produced a very high aboveground biomass compared to the other crops, whereas its root biomass was proportionally low. The root DM collected from the 0.00-0.20 m layer represented an average of 13.6 ± 4.5 % of the total vegetative biomass at flowering (ranging from 6.3 % for jack bean to 26.6 % for vetch). The S:R ratio allowed the results to be compared to other production conditions. Our results are in the upper range of the values available in the literature. On average, the S:R ratio estimated at the flowering stage of the crops was 7.1 (2.8-15.0) for the 26 crops considered, whereas Bolinder et al. (2007)Bolinder MA, Janzen HH, Gregorich EG, Angers DA, VandenBygaart AJ. An approach for estimating net primary productivity and annual carbon inputs to soil for common agricultural crops in Canada. Agr Ecosyst Environ. 2007;118:29-42. https://doi.org/10.1016/j.agee.2006.05.013
https://doi.org/10.1016/j.agee.2006.05.0...
obtained an S:R value of 5.0 (1.0-10.7) for nine crops grown in different systems and climates of North America. Therefore, there is good agreement regarding both the average and the range of variation of this ratio. Under relatively close climatic conditions, Dos Santos et al. (2011)Santos NZ, Diecklow J, Bayer C, Molin R, Favaretto N, Pauletti V, Piva JT. Forages, cover crops and related shoot and root additions in no-till rotations to C sequestration in a subtropical Ferralsol. Soil Till Res. 2011;111:208-18. https://doi.org/10.1016/j.still.2010.10.006
https://doi.org/10.1016/j.still.2010.10....
used a similar S:R ratio for oat (3.1) and either a lower or higher S:R for other crops (corn, wheat, ryegrass, soybean, and vetch). Is bias possible in comparison of the various species studied by sampling in the 0.00-0.20 m layer, due to the various root development strategies, for example, between Poaceae and Fabaceae? In fact, we observed that most of the root biomass recovered in the 0.00-0.20 m layer was located in the 0.00-0.10 m layer (80-87 % of the total, on average) and that the proportion of fine roots was lower for the Fabaceae species, making their root collection easier. Consequently, we assumed that the root C and N inputs in the top layer of the species studied could be compared to one another. The contribution of fine roots to deep C stabilization could not be neglected for all species (Sanaullah et al., 2011Sanaullah M, Chabbi A, Leifeld J, Bardoux G, Billou D, Rumpel C. Decomposition and stabilization of root litter in top- and subsoil horizons: what is the difference? Plant Soil. 2011;338:127-41. https://doi.org/10.1007/s11104-010-0554-4
https://doi.org/10.1007/s11104-010-0554-...
), and C rhizodeposition of the crops was not quantified. Thus, these results do not address the effects of growing plant species on soil C storage. Recent work estimated that rhizodeposited C represents between 65 to 100 % of the measurable root C (Katterer et al., 2011Kätterer T, Bolinder MA, Andrén O, Kirchmann H, Menichetti L. Roots contribute more to refractory soil organic matter than above-ground crop residues, as revealed by a long-term field experiment. Agr Ecosyst Environ. 2011;141:184-92. https://doi.org/10.1016/j.agee.2011.02.029
https://doi.org/10.1016/j.agee.2011.02.0...
).
Recycled DM and recycled C were highly correlated due to the small variation in the C content in the plant tissues, corresponding to an average of 462 g kg-1 C for the roots and 472 g kg-1 C for the shoots. As expected, a high %N was observed for plant parts harvested at the flowering stage (cover crops), which, coupled with a higher amount of aboveground biomass, led to three times greater accumulation of N in the shoots for the cover crops compared to the main crops (on average 177 vs. 59 kg ha-1 N). For the roots sampled during flowering, the %N was far more similar among species, corresponding to an average of 14.1 g kg-1 N of root biomass, even if the %N remained significantly higher for legumes compared to grasses. Along with variations in shoot N, typology among the species was even more pronounced considering SN:RN = 2.71 for the grass species and SN:RN = 9.0 for the legumes, considering the species sampled during flowering. This implies a very different strategy in plants regarding plant N allocation and its subsequent fate.
Further analysis of the plant biomass allocation to the leaves and roots was necessary because similar S:R ratios may be obtained from different values of the shoot and roots; therefore, these ratios tell little regarding the strategies of the different species (Poorter et al., 2012Poorter H, Niklas KJ, Reich PB, Oleksyn J, Poot P, Mommer L. Biomass allocation to leaves, stems and roots: meta-analyses of interspecific variation and environmental control. New Phytol. 2012;193:30-50. https://doi.org/10.1111/j.1469-8137.2011.03952.x
https://doi.org/10.1111/j.1469-8137.2011...
). Our results clearly showed that the leguminous plants had root DM values lower than the grass plants, and their root dry weight varied little. Conversely, for grasses, we found a greater production of root DM, and root DM was proportional to the total shoot (leaf + stem) DM. Two exceptions to this pattern were the roots of vetch and peas, which exhibited high N contents and their entire root system as fine roots. This suggests a relatively low average investment of the Fabaceae in roots compared to the Poaceae. These results agree well with previous studies conducted in natural ecosystems on plant strategies for resource use and allocation. In both field and laboratory conditions, Roumet et al. (2006Roumet C, Urcelay C, Díaz S. Suites of root traits differ between annual and perennial species growing in the field. New Phytol. 2006;170:357-68. https://doi.org/10.1111/j.1469-8137.2006.01667.x
https://doi.org/10.1111/j.1469-8137.2006...
, 2008Roumet C, Lafont F, Sari M, Warembourg F, Garnier E. Root traits and taxonomic affiliation of nine herbaceous species grown in glasshouse conditions. Plant Soil. 2008;312:69-83. https://doi.org/10.1007/s11104-008-9635-z
https://doi.org/10.1007/s11104-008-9635-...
) showed that root characteristics (i.e., root traits) for Poaceae, Fabaceae, and Asteraceae species differ strongly between Fabaceae and Poaceae. Grasses had a higher root dry matter, a higher proportion of fine roots, and a lower N content compared to the Fabaceae species, whereas the Asteraceae species showed intermediate characteristics. Compared to Fabaceae, Poaceae also allocated a greater proportion of biomass to the roots (Roumet et al., 2008Roumet C, Lafont F, Sari M, Warembourg F, Garnier E. Root traits and taxonomic affiliation of nine herbaceous species grown in glasshouse conditions. Plant Soil. 2008;312:69-83. https://doi.org/10.1007/s11104-008-9635-z
https://doi.org/10.1007/s11104-008-9635-...
).
As in natural ecosystems (Freschet et al., 2015Freschet GT, Swart EM, Cornelissen JHC. Integrated plant phenotypic responses to contrasting above- and below-ground resources: key roles of specific leaf area and rootmass fraction. New Phytol. 2015;206:1247-60. https://doi.org/10.1111/nph.13352
https://doi.org/10.1111/nph.13352...
), the properties of agrosystems dominated by root biomass production likely differ strongly from those of agrosystems dominated by shoot biomass production, particularly in terms of soil organic matter build-up and nutrient recycling. Redin et al. (2014)Redin M, Guénon R, Recous S, Schmatz R, Freitas LL, Aita C, Giacomini SJ. Carbon mineralization in soil of roots from twenty crop species, as affected by their chemical composition and botanical family. Plant Soil. 2014;378:205-14. https://doi.org/10.1007/s11104-013-2021-5
https://doi.org/10.1007/s11104-013-2021-...
used plant residues from the same experimental area and showed that both the chemical traits of root residues and their potential degradation in the soil varied according to the families of their species. In particular, roots from the Poaceae species exhibited a lower N content, a lower lignin content, and a lower variability in overall chemical composition compared to roots from the Fabaceae species. They also decomposed significantly more slowly than other species. Therefore, different features of grass and non-grass species may make different contributions in terms of C and nutrient cycling, the so-called “afterlife effects” of plant traits on agroecosystem functions (Freschet et al., 2012Freschet GT, Aerts R, Cornelissen JHC. A plant economics spectrum of litter decomposability. Funct Ecol. 2012;26:56-65. https://doi.org/10.1111/j.1365-2435.2011.01913.x
https://doi.org/10.1111/j.1365-2435.2011...
). In an agricultural context, the selection of crops and rotations, i.e., the contributions of grass and legume crops as main crops and the presence or absence of cover crops directly affect the potential for C and nutrient recycling in the soil and subsequent stabilization or mineralization (Tribouillois et al., 2015Tribouillois H, Cruz P, Cohan J-P, Justes E. Modelling agroecosystem nitrogen functions provided by cover crop species in bispecific mixtures using functional traits and environmental factors. Agr Ecosyst Environ. 2015;207:218-28. https://doi.org/10.1016/j.agee.2015.04.016
https://doi.org/10.1016/j.agee.2015.04.0...
).
CONCLUSIONS
The pattern of allocation of biomass, C, and N to shoots and roots of annual crops grown under subtropical conditions in Brazil agreed well with previous observations made from plants grown in natural ecosystems under different climatic conditions.
Grasses (Poaceae species) allocated proportionally more biomass, C, and N to their root systems compared to non-grass species (Fabaceae species, notably).
Different functional traits were observed in the large range of crops evaluated (main crops and cover crops), which could be combined either in space (mixed cropping) or in time (rotation) to ensure not only satisfactory primary productivity but also long-term preservation of fertility and soil C storage.
ACKNOWLEDGMENTS
This study was supported by the Brazil government through the Conselho Nacional de Desenvolvimento Científico e Tecnológico (CNPq) and the Coordenação de Aperfeiçoamento de Pessoal de Nível Superior (Capes), as well as by the French National Institute for Agricultural Research (INRA). Bilateral Brazilian and French collaboration was funded under Program CNPq - Ciência sem Fronteiras, process number 401724/2012-3.
REFERENCES
- Amos B, Walters DT. Maize root biomass and net rhizodeposited carbon: an analysis of the literature. Soil Sci Soc Am J. 2006;70:1489-503. https://doi.org/10.2136/sssaj2005.0216
» https://doi.org/10.2136/sssaj2005.0216 - Birouste M, Kazakou E, Blanchard A, Roumet C. Plant traits and decomposition: are the relationships for roots comparable to those for leaves? Ann Bot. 2012;109:463-72. https://doi.org/10.1093/aob/mcr297
» https://doi.org/10.1093/aob/mcr297 - Boddey RM, Jantalia CP, Conceição PC, Zanatta JA, Bayer C, Mielniczuk J, Dieckow J, Santos HP, Denardin JE, Aita C, Giacomini SJ, Alves BJR, Urquiaga S. Carbon accumulation at depth in Ferralsols under zero-till subtropical agriculture. Glob Change Biol. 2010;16:784-95. https://doi.org/10.1111/j.1365-2486.2009.02020.x
» https://doi.org/10.1111/j.1365-2486.2009.02020.x - Bolinder MA, Angers DA, Dubuc JP. Estimating shoot to root ratios and annual carbon inputs in soils for cereal crops. Agr Ecosyst Environ. 1997;63:61-6. https://doi.org/10.1016/S0167-8809(96)01121-8
» https://doi.org/10.1016/S0167-8809(96)01121-8 - Bolinder MA, Janzen HH, Gregorich EG, Angers DA, VandenBygaart AJ. An approach for estimating net primary productivity and annual carbon inputs to soil for common agricultural crops in Canada. Agr Ecosyst Environ. 2007;118:29-42. https://doi.org/10.1016/j.agee.2006.05.013
» https://doi.org/10.1016/j.agee.2006.05.013 - Buyanovsky GA, Wagner GH. Post-harvest residue input to cropland. Plant Soil. 1986;93:57-65. https://doi.org/10.1007/BF02377145
» https://doi.org/10.1007/BF02377145 - Cornelissen JHC, Thompson K. Functional leaf attributes predict litter decomposition rate in herbaceous plants. New Phytol. 1997;135:109-14. https://doi.org/10.1007/BF02377145
» https://doi.org/10.1007/BF02377145 - De Deyn GB, Cornelissen JHC, Bardgett RD. Plant functional traits and soil carbon sequestration in contrasting biomes. Ecol Lett. 2008;11:516-31. https://doi.org/10.1111/j.1461-0248.2008.01164.x
» https://doi.org/10.1111/j.1461-0248.2008.01164.x - Freschet GT, Aerts R, Cornelissen JHC. A plant economics spectrum of litter decomposability. Funct Ecol. 2012;26:56-65. https://doi.org/10.1111/j.1365-2435.2011.01913.x
» https://doi.org/10.1111/j.1365-2435.2011.01913.x - Freschet GT, Cornwell WK, Wardle DA, Elumeeva TG, Liu W, Jackson BG, Onipchenko VG, Soudzilovskaia NA, Tao J, Cornelissen JHC. Linking litter decomposition of above- and below-ground organs to plant-soil feedbacks worldwide. J Ecol. 2013;101:943-52. https://doi.org/10.1111/1365-2745.12092
» https://doi.org/10.1111/1365-2745.12092 - Freschet GT, Swart EM, Cornelissen JHC. Integrated plant phenotypic responses to contrasting above- and below-ground resources: key roles of specific leaf area and rootmass fraction. New Phytol. 2015;206:1247-60. https://doi.org/10.1111/nph.13352
» https://doi.org/10.1111/nph.13352 - Giacomini SJ, Aita C, Jantalia CP, Urquiaga S. Aproveitamento pelo milho do nitrogênio amoniacal de dejetos líquidos de suínos em plantio direto e preparo reduzido do solo. Pesq Agropec Bras. 2009;44:761-8. https://doi.org/10.1590/S0100-204X2009000700017
» https://doi.org/10.1590/S0100-204X2009000700017 - Kätterer T, Bolinder MA, Andrén O, Kirchmann H, Menichetti L. Roots contribute more to refractory soil organic matter than above-ground crop residues, as revealed by a long-term field experiment. Agr Ecosyst Environ. 2011;141:184-92. https://doi.org/10.1016/j.agee.2011.02.029
» https://doi.org/10.1016/j.agee.2011.02.029 - Kumar K, Goh KM. Biological nitrogen fixation, accumulation of soil nitrogen and nitrogen balance for white clover (Trifolium repens L.) and field pea (Pisum sativum L.) grown for seed. Field Crop Res. 2000;68:49-59. https://doi.org/10.1016/S0378-4290(00)00109-X
» https://doi.org/10.1016/S0378-4290(00)00109-X - Lal R. Soil carbon sequestration to mitigate climate change. Geoderma. 2004;123:1-22. https://doi.org/10.1016/j.geoderma.2004.01.032
» https://doi.org/10.1016/j.geoderma.2004.01.032 - Menichetti L, Ekblad A, Kätterer T. Contribution of roots and amendments to soil carbon accumulation within the soil profile in a long-term field experiment in Sweden. Agr Ecosyst Environ. 2015;200:79-87. https://doi.org/10.1016/j.agee.2014.11.003
» https://doi.org/10.1016/j.agee.2014.11.003 - Naudin K, Scopel E, Andriamandroso ALH, Rakotosolofo M, Ratsimbazafy NRSA, Rakotozandriny JDN, Salgado P, Giller KE. Trade-offs between biomass use and soil cover. The case of rice-based cropping systems in the Lake Alaotra region of Madagascar. Expl Agric. 2012;48:194-209. https://doi.org/10.1017/S001447971100113X
» https://doi.org/10.1017/S001447971100113X - Plaza-Bonilla D, Álvaro-Fuentes J, Hansen NC, Lampurlanés J, Cantero-Martínez C. Winter cereal root growth and aboveground-belowground biomass ratios as affected by site and tillage system in dry land Mediterranean conditions. Plant Soil. 2014;374:925-39. https://doi.org/10.1007/s11104-013-1926-3
» https://doi.org/10.1007/s11104-013-1926-3 - Poorter H, Niklas KJ, Reich PB, Oleksyn J, Poot P, Mommer L. Biomass allocation to leaves, stems and roots: meta-analyses of interspecific variation and environmental control. New Phytol. 2012;193:30-50. https://doi.org/10.1111/j.1469-8137.2011.03952.x
» https://doi.org/10.1111/j.1469-8137.2011.03952.x - Poorter H, Sack L. Pitfalls and possibilities in the analysis of biomass allocation patterns in plants. Front Plant Sci. 2012;3:259. https://doi.org/10.3389/fpls.2012.00259
» https://doi.org/10.3389/fpls.2012.00259 - Prakash V, Kundu S, Ghosh BN, Singh RD, Gupta HS. Annual carbon input to soil through rainfed soybean (Glycine max) - wheat (Triticum aestivum) cropping sequence in mid-hills of North-West Himalaya. Indian J Agr Sci. 2002;72:14-7.
- Redin M, Guénon R, Recous S, Schmatz R, Freitas LL, Aita C, Giacomini SJ. Carbon mineralization in soil of roots from twenty crop species, as affected by their chemical composition and botanical family. Plant Soil. 2014;378:205-14. https://doi.org/10.1007/s11104-013-2021-5
» https://doi.org/10.1007/s11104-013-2021-5 - Rochester IJ, Peoples MB, Constable GA, Gault R. Faba beans and other legumes add nitrogen to irrigated cotton cropping systems. Australian J Exp Agr. 1998;38:253-60. https://doi.org/10.1071/EA97132
» https://doi.org/10.1071/EA97132 - Roumet C, Lafont F, Sari M, Warembourg F, Garnier E. Root traits and taxonomic affiliation of nine herbaceous species grown in glasshouse conditions. Plant Soil. 2008;312:69-83. https://doi.org/10.1007/s11104-008-9635-z
» https://doi.org/10.1007/s11104-008-9635-z - Roumet C, Urcelay C, Díaz S. Suites of root traits differ between annual and perennial species growing in the field. New Phytol. 2006;170:357-68. https://doi.org/10.1111/j.1469-8137.2006.01667.x
» https://doi.org/10.1111/j.1469-8137.2006.01667.x - Sanaullah M, Chabbi A, Leifeld J, Bardoux G, Billou D, Rumpel C. Decomposition and stabilization of root litter in top- and subsoil horizons: what is the difference? Plant Soil. 2011;338:127-41. https://doi.org/10.1007/s11104-010-0554-4
» https://doi.org/10.1007/s11104-010-0554-4 - Santos HG, Jacomine PKT, Anjos LHC, Oliveira VA, Oliveira JB, Coelho MR, Lumbreras JF, Cunha TJF. Sistema brasileiro de classificação de solos. 3a ed. Rio de Janeiro: Embrapa Solos; 2013.
- Santos NZ, Diecklow J, Bayer C, Molin R, Favaretto N, Pauletti V, Piva JT. Forages, cover crops and related shoot and root additions in no-till rotations to C sequestration in a subtropical Ferralsol. Soil Till Res. 2011;111:208-18. https://doi.org/10.1016/j.still.2010.10.006
» https://doi.org/10.1016/j.still.2010.10.006 - Tribouillois H, Cruz P, Cohan J-P, Justes E. Modelling agroecosystem nitrogen functions provided by cover crop species in bispecific mixtures using functional traits and environmental factors. Agr Ecosyst Environ. 2015;207:218-28. https://doi.org/10.1016/j.agee.2015.04.016
» https://doi.org/10.1016/j.agee.2015.04.016 - Valbuena D, Erenstein O, Tui SH-K, Abdoulaye T, Claessens L, Duncan AJ, Gérard B, Rufino MC, Teufel N, van Rooyen A, van Wijk MT. Conservation agriculture in mixed crop-livestock systems: scoping crop residue trade-offs in Sub-Saharan Africa and South Asia. Field Crop Res. 2012;132:175-84. https://doi.org/10.1016/j.fcr.2012.02.022
» https://doi.org/10.1016/j.fcr.2012.02.022 - Xu JG, Juma NG. Above- and below-ground transformation of photosynthetically fixed carbon by two barley (Hordeum vulgare L.) cultivars in a Typic Cryoboroll. Soil Biol Biochem. 1993;25:1263-72. https://doi.org/10.1016/0038-0717(93)90223-X
» https://doi.org/10.1016/0038-0717(93)90223-X - Williams JD, McCool DK, Reardon CL, Douglas Jr CL, Albrecht SL, Rickman RW. Root:shoot ratios and belowground biomass distribution for Pacific Northwest dryland crops. J Soil Water Conserv. 2013;68:349-60. https://doi.org/10.2489/jswc.68.5.349
» https://doi.org/10.2489/jswc.68.5.349 - Zibilske LM, Materon LA. Biochemical properties of decomposing cotton and corn stem and root residues. Soil Sci Soc Am J. 2005;69:378-86. https://doi.org/10.2136/sssaj2005.0378
» https://doi.org/10.2136/sssaj2005.0378
Publication Dates
-
Publication in this collection
06 Aug 2018 -
Date of issue
2018
History
-
Received
24 Oct 2017 -
Accepted
15 Apr 2018