
Abstract:
The objective of this work was to evaluate the effects of genomic information on the genetic evaluation of hip height in Brahman cattle using different matrices built from genomic and pedigree data. Hip height measurements from 1,695 animals, genotyped with high-density SNP chip or imputed from 50 K high-density SNP chip, were used. The numerator relationship matrix (NRM) was compared with the H matrix, which incorporated the NRM and genomic relationship (G) matrix simultaneously. The genotypes were used to estimate three versions of G: observed allele frequency (HGOF), average minor allele frequency (HGMF), and frequency of 0.5 for all markers (HG50). For matrix comparisons, animal data were either used in full or divided into calibration (80% older animals) and validation (20% younger animals) datasets. The accuracy values for the NRM, HGOF, and HG50 were 0.776, 0.813, and 0.594, respectively. The NRM and HGOF showed similar minor variances for diagonal and off-diagonal elements, as well as for estimated breeding values. The use of genomic information resulted in relationship estimates similar to those obtained based on pedigree; however, HGOF is the best option for estimating the genomic relationship matrix and results in a higher prediction accuracy. The ranking of the top 20% animals was very similar for all matrices, but the ranking within them varies depending on the method used.
Index terms:
Bos indicus; beef cattle; genomics; rare alleles
Resumo:
O objetivo deste trabalho foi avaliar os efeitos da informação genômica na avaliação genética para altura do quadril em bovinos da raça Brahman, por meio de diferentes matrizes construídas com dados genômicos e de pedigree. Utilizaram-se medidas de altura do quadril de 1.695 animais, genotipados com SNP chip de alta densidade ou imputados do 50 K SNP chip de alta densidade. A matriz de pedigree “numerator relationship matrix” (NRM) foi comparada à matriz H, a qual incorporou as matrizes NRM e de parentesco genômico (G) simultaneamente. Os genótipos foram utilizados para estimar três versões de G: frequência observada dos alelos (HGOF), média da menor frequência alélica (HGMF) e frequência de 0,5 para todos os marcadores (HG50). Para a comparação das matrizes, foram utilizadas informações completas ou divididas em conjuntos de dados de calibração (80% dos animais mais velhos) e de validação (20% dos mais jovens). Os valores de acurácia para NRM, HGOF e HG50 foram 0,776, 0,813 e 0,594, respectivamente. NRM e HGOF foram semelhantes, com menores variâncias para os elementos da diagonal e fora da diagonal, bem como para os valores genéticos estimados. O uso de informações genômicas resultou em estimativas de parentesco semelhantes às obtidas com base em pedigree; entretanto, HGOF é a melhor opção para estimar a matriz de parentesco genômico e resulta em maiores acurácias de predição. O ranking dos animais top 20% foi muito semelhante para as matrizes, mas a classificação dentro destas varia dependendo do método.
Termos para indexação:
Bos indicus; gado de corte; genômica; alelos raros
Introduction
Traditionally, animal selection studies target traits of interest and use the phenotype of individuals and information of kinship derived from pedigree records, which is the basis for building the numerator relationship matrix (NRM) (Henderson, 1975HENDERSON, C.R. Rapid method for computing the inverse of a relationship matrix. Journal of Dairy Science, v.58, p.1727-1730, 1975. DOI: 10.3168/jds.S0022-0302(75)84776-X.
https://doi.org/10.3168/jds.S0022-0302(7...
). This animal breeding and selection method is efficient, but the process can be slow, especially for traits measured only in one sex, such as milk production; measured after the slaughter of animals, including meat quality; or measured late in life, as, for example, longevity (Goddard & Hayes, 2009GODDARD, M.E.; HAYES, B.J. Mapping genes for complex traits in domestic animals and their use in breeding programmes. Nature Reviews Genetics, v.10, p.381-391, 2009. DOI: 10.1038/nrg2575.
https://doi.org/10.1038/nrg2575...
) and hip height. In breeding programs focused on economically important traits, researchers seek to identify genes, genetic markers associated to these traits, or methodologies to enhance or accelerate genomic selection. The application of a single-step genome-wide association approach in Brahman cattle has allowed identifying multiple regions scattered across the genome that influence weights at different ages. The most interesting regions found were connected to previously identified quantitative trait loci (QTLs) and to genes influencing growth and weight traits (Martínez et al., 2017MARTÍNEZ, R.; BEJARANO, D.; GÓMEZ, Y.; DASONEVILLE, R.; JIMÉNEZ, A.; EVEN, G.; SÖLKNER, J.; MÉSZÁROS, G. Genome-wide association study for birth, weaning and yearling weight in Colombian Brahman cattle. Genetics and Molecular Biology, v.40, p.453-459, 2017. DOI: 10.1590/1678-4685-gmb-2016-0017.
https://doi.org/10.1590/1678-4685-gmb-20...
).
The advancement of technology and the opportunity of genotyping a high number of individuals for numerous alleles make it possible to use information on alleles that can be shared through common ancestors in the pedigree, including ancestors that may be missing from the pedigree or not genotyped. This makes the use of a genomic relationship matrix (G) feasible (VanRaden, 2008VANRADEN, P.M. Efficient methods to compute genomic predictions. Journal of Dairy Science, v.91, p.4414-4423, 2008. DOI: 10.3168/jds.2007-0980.
https://doi.org/10.3168/jds.2007-0980...
), allowing to increase the accuracy of predicted breeding values in genetic evaluations. Genomic selection using the G matrix can increase the rate of genetic improvement and reduce the cost of progeny testing. This has been observed in the dairy system, although some practical barriers are still faced in its implementation in the beef sector, primarily due to the lack of short-term return on investment for most producers and to incremental and relatively small genetic gains (Rolf et al., 2014ROLF, M.M.; DECKER, J.E.; MCKAY, S.D.; TIZIOTO, P.C.; BRANHAM, K.A.; WHITACRE, L.K.; HOFF, J.L.; REGITANO, L.C.A.; TAYLOR, J.F. Genomics in the United States beef industry. Livestock Science, v.166, p.84-93, 2014. DOI: 10.1016/j.livsci.2014.06.005.
https://doi.org/10.1016/j.livsci.2014.06...
).
Breeding values are obtained, traditionally, using mixed model equations that adopt the NRM based on pedigree information. In one form of genomic selection, the NRM or the G matrix represent the additive genetic matrix. However, in most cases, the G matrix includes genomic information of fewer animals. Therefore, Legarra et al. (2009)LEGARRA, A.; AGUILAR, I.; MISZTAL, I. A relationship matrix including full pedigree and genomic information. Journal of Dairy Science, v.92, p.4656-4663, 2009. DOI: 10.3168/jds.2009-2061.
https://doi.org/10.3168/jds.2009-2061...
and Misztal et al. (2009)MISZTAL, I.; LEGARRA, A.; AGUILAR, I. Computing procedures for genetic evaluation including phenotypic, full pedigree, and genomic information. Journal of Dairy Science, v.92, p.4648-4655, 2009. DOI: 10.3168/jds.2009-2064.
https://doi.org/10.3168/jds.2009-2064...
proposed a method that integrates the NRM and G matrix in a single H matrix, enabling genetic evaluation based on the best linear unbiased prediction (Blup), which was successfully applied to dairy cattle (Aguilar et al., 2010AGUILAR, I.; MISZTAL, I.; JOHNSON, D.L.; LEGARRA, A.; TSURUTA, S.; LAWLOR, T.J. Hot topic: a unified approach to utilize phenotypic, full pedigree, and genomic information for genetic evaluation of Holstein final score. Journal of Dairy Science, v.93, p.743-752, 2010. DOI: 10.3168/jds.2009-2730.
https://doi.org/10.3168/jds.2009-2730...
). Forni et al. (2011)FORNI, S.; AGUILAR, I.; MISZTAL, I. Different genomic relationship matrices for single-step analysis using phenotypic, pedigree and genomic information. Genetic Selection Evolution, v.43, art.1, 2011. DOI: 10.1186/1297-9686-43-1.
https://doi.org/10.1186/1297-9686-43-1...
used different strategies to create the G matrix and subsequently integrate it with the NRM by varying the allele frequencies of a population of pigs; the authors concluded that building the G matrix this way did not affect the estimated breeding values and variance components of the studied population. Brito et al. (2017)BRITO, L.F.; CLARKE, S.M.; MCEWAN, J.C.; MILLER, S.P.; PICKERING, N.K.; BAIN, W.E.; DODDS, K.G.; SARGOLZAEI, M.; SCHENKEL, F.S. Prediction of genomic breeding values for growth, carcass and meat quality traits in a multi-breed sheep population using a HD SNP chip. BMC Genetics, v.18, art.7, 2017. DOI: 10.1186/s12863-017-0476-8.
https://doi.org/10.1186/s12863-017-0476-...
also evaluated alternative genomic relationship matrices, validation designs, and genomic prediction scenarios in a sheep program, and found that the G matrix, using the observed allele frequency, presented the highest average accuracies and is recommended for genomic predictions. These results show the importance of assessing the contribution of genomic information in genetic evaluation processes in different species and different population structures.
The objective of this work was to evaluate the effects of genomic information on the genetic evaluation of hip height in Brahman cattle using different matrices built from genomic and pedigree data.
Materials and Methods
The investigated population of Brahman cattle has 90% Bos indicus genetics (Bolormaa et al., 2013bBOLORMAA, S.; PRYCE, J.E.; KEMPER, K.E.; HAYES, B.J.; ZHANG, Y.; TIER, B.; BARENDSE, W.; REVERTER, A.; GODDARD, M.E. Detection of quantitative trait loci in Bos indicus and Bos taurus cattle using genome-wide association studies. Genetics Selection Evolution, v.45, art.43, 2013b.). Hip height (HH, cm) measurements taken from 1,695 Brahman animals, between 15 and 18 months of age, were used in the present study. These cattle represent a subset of the extensively phenotyped population bred by the Cooperative Research Centre for Beef Genetic Technologies (Beef CRC, Armidale, Australia) and described previously in detail (Barwick et al., 2009BARWICK, S.A.; JOHNSTON, D.J.; BURROW, H.M.; HOLROYD, R.G.; FORDYCE, G.; WOLCOTT, M.L.; SIM, W.D.; SULLIVAN, M.T. Genetics of heifer performance in ‘wet’ and ‘dry’ seasons and their relationships with steer performance in two tropical beef genotypes. Animal Production Science, v.49, p.367-382, 2009. DOI: 10.1071/EA08273.
https://doi.org/10.1071/EA08273...
; Fortes et al., 2011FORTES, M.R.S.; REVERTER, A.; NAGARAJ, S.H.; ZHANG, Y.; JONSSON, N.N.; BARRIS, W.; LEHNERT, S.; BOE-HANSEN, G.B.; HAWKEN, R.J. A single nucleotide polymorphism-derived regulatory gene network underlying puberty in 2 tropical breeds of beef cattle. Journal of Animal Science, v.89, p.1669-1683, 2011. DOI: 10.2527/jas.2010-3681.
https://doi.org/10.2527/jas.2010-3681...
; Hawken et al., 2012HAWKEN, R.J.; ZHANG, Y.D.; FORTES, M.R.S.; COLLIS, E.; BARRIS, W.C.; CORBET, N.J.; WILLIAMS, P.J.; FORDYCE, G.; HOLROYD, R.G.; WALKLEY, J.R.W.; BARENDSE, W.; JOHNSTON, D.J.; PRAYAGA, K.C.; TIER, B.; REVERTER, A.; LEHNERT, S.A. Genome-wide association studies of female reproduction in tropically adapted beef cattle. Journal of Animal Science, v.90, p.1398-410, 2012. DOI: 10.2527/jas.2011-4410.
https://doi.org/10.2527/jas.2011-4410...
). All individuals in this population have genotype information for 777,000 single nucleotide polymorphisms (SNPs), and these high-density SNP data were genotyped or imputed.
All these animals were genotyped using three different SNP chips (Illumina, Inc., San Diego, CA, USA): the BovineSNP50 beadchip, version 1, to genotype females; version 2, to genotype males, which, combined, are the 1,695 phenotyped animals; and the high-density SNP chip to genotype 917 samples from sires and selected representative animals of the Beef CRC populations, which were genotyped with the high-density SNP chip to allow for genotype imputation using the Beagle program (Browning & Browning, 2011BROWNING, B.L.; BROWNING, S.R. A fast, powerful method for detecting identity by descent. American Journal of Human Genetics, v.88, p.173-182, 2011. DOI: 10.1016/j.ajhg.2011.01.010.
https://doi.org/10.1016/j.ajhg.2011.01.0...
) with average of imputation accuracy of 0.90. For further detail on genotyping, imputation, and quality control see Bolormaa et al. (2013a)BOLORMAA, S.; PRYCE, J.E.; KEMPER, K.; SAVIN, K.; HAYES, B.J.; BARENDSE, W.; ZHANG, Y.; REICH, C.M.; MASON, B.A.; BUNCH, R.J.; HARRISON, B.E.; REVERTER, A.; HERD, R.M.; TIER, B.; GRASER, H.-U.; GODDARD, M.E. Accuracy of prediction of genomic breeding values for residual feed intake and carcass and meat quality traits in Bos taurus, Bos indicus, and composite beef cattle. Journal of Animal Science, v.91, p.3088-3104, 2013a. DOI: 10.2527/jas.2012-5827.
https://doi.org/10.2527/jas.2012-5827...
.
In the quality control analysis, the SNP was excluded if the minor allele frequency was lower than 0.05 or the correlation between the SNPs was higher than 0.95. After quality control procedures, 569,620 SNPs remained to estimate the genomic relationship coefficients in the G matrices.
The pedigree information used to build the NRM was composed of 3,030 animals, including the genotyped ones, corresponding to 55.94% of the total population. Estimated breeding values for HH were calculated using the animal model with the fixed effects of sex, cohort (interaction between year of birth and farm), and age at HH measurement fitted as a covariate. To obtain the estimated breeding values, the NRM used a traditional method based on pedigree information.
The combined pedigree-genomic relationship matrix, denominated H, was calculated using both pedigree and genomic information according to Aguilar et al. (2010)AGUILAR, I.; MISZTAL, I.; JOHNSON, D.L.; LEGARRA, A.; TSURUTA, S.; LAWLOR, T.J. Hot topic: a unified approach to utilize phenotypic, full pedigree, and genomic information for genetic evaluation of Holstein final score. Journal of Dairy Science, v.93, p.743-752, 2010. DOI: 10.3168/jds.2009-2730.
https://doi.org/10.3168/jds.2009-2730...
. The G matrix was obtained using the method of VanRaden (2008)VANRADEN, P.M. Efficient methods to compute genomic predictions. Journal of Dairy Science, v.91, p.4414-4423, 2008. DOI: 10.3168/jds.2007-0980.
https://doi.org/10.3168/jds.2007-0980...
:
where M is the matrix that specifies which marker alleles each individual inherited with m columns (m is the total number of markers) and n rows (n is the total number of genotyped individuals); and P is the matrix with the frequency of the second allele (pj), expressed as 2pj. The M matrix was filled by 0 if first homozygous, 1 if heterozygous, or 2 if second homozygous. The frequencies used to obtain P were those described by Forni et al. (2011)FORNI, S.; AGUILAR, I.; MISZTAL, I. Different genomic relationship matrices for single-step analysis using phenotypic, pedigree and genomic information. Genetic Selection Evolution, v.43, art.1, 2011. DOI: 10.1186/1297-9686-43-1.
https://doi.org/10.1186/1297-9686-43-1...
: observed allele frequency of each SNP (GOF), average minor allele frequency (GMF), and frequency of 0.5 for all markers (G50). To avoid problems with inversion in the mixed model equations, the method proposed by VanRaden (2008)VANRADEN, P.M. Efficient methods to compute genomic predictions. Journal of Dairy Science, v.91, p.4414-4423, 2008. DOI: 10.3168/jds.2007-0980.
https://doi.org/10.3168/jds.2007-0980...
, with weighting factor of 0.95 between the G matrix and the NRM, was used (Aguilar et al., 2010AGUILAR, I.; MISZTAL, I.; JOHNSON, D.L.; LEGARRA, A.; TSURUTA, S.; LAWLOR, T.J. Hot topic: a unified approach to utilize phenotypic, full pedigree, and genomic information for genetic evaluation of Holstein final score. Journal of Dairy Science, v.93, p.743-752, 2010. DOI: 10.3168/jds.2009-2730.
https://doi.org/10.3168/jds.2009-2730...
).
After obtaining the weighted G matrix (Gw), the inverse of H was calculated using the following equation (Aguilar et al., 2010AGUILAR, I.; MISZTAL, I.; JOHNSON, D.L.; LEGARRA, A.; TSURUTA, S.; LAWLOR, T.J. Hot topic: a unified approach to utilize phenotypic, full pedigree, and genomic information for genetic evaluation of Holstein final score. Journal of Dairy Science, v.93, p.743-752, 2010. DOI: 10.3168/jds.2009-2730.
https://doi.org/10.3168/jds.2009-2730...
; Christensen & Lund, 2010CHRISTENSEN, O.F.; LUND, M.S. Genomic prediction when some animals are not genotyped. Genetic Selection Evolution, v.42, art.2, 2010. DOI: 10.1186/1297-9686-42-2.
https://doi.org/10.1186/1297-9686-42-2...
):
where H-1 is the inverse of the pedigree-genomic relationship matrix; NRM-1 is the inverse of the pedigree-based numerator relationship matrix; Gw -1 is the inverse of the genomic matrix; and NRM22 -1 is the inverse of the pedigree-based numerator relationship matrix of the genotyped individuals. Considering the variations in the allele frequencies used to build the G matrices, three versions of the H matrix were also built: HGOF, HGMF, and HG50.
To compare the accuracies of the genomic estimated breeding values (GEBVs) obtained with each H matrix, the mean accuracy was estimated using the prediction error variance (PEV), calculated by:
where ri is the accuracy of the mean additive value for each matrix i; αa2 is the additive variance estimated for each matrix i; and PEVj is the prediction error variance for each animal j estimated by matrix i.
To obtain the inversions of these matrices, as well as the estimates of the variance components, genetic parameters, and the PEV, the restricted maximum likelihood (REML) methods in the Wombat software were used (Meyer, 2007Meyer, K. WOMBAT: a tool for mixed model analyses in quantitative genetics by restricted maximum likelihood (REML). Journal of Zhejiang University-Science B, v.8, p.815-821, 2007. DOI: 10.1631/jzus.2007.B0815.
https://doi.org/10.1631/jzus.2007.B0815...
). The mean accuracies of the GEBVs based on 1,695 GEBVs were calculated using phenotypes of all the animals genotyped for the prediction (GEN) and 80% of the phenotypic information, i.e., the subset of data corresponding to the oldest animals (old) in the dataset.
To compare the accuracy of prediction, the old subset (n = 1.356 animals) was used to predict the GEBVs of 20% of the youngest animals (young subset, n = 339 animals); this accuracy was estimated by omitting the phenotypes of the younger animals from the prediction. This way, an alternative accuracy metric, denominated prediction accuracy (r), was calculated, based on the correlations between the adjusted phenotype (Phenadj) and the GEBVs, as follows:
where hi 2 is the heritability estimated for HH for each matrix i (HGOF, HGMF, and HG50). The correlation between the GEBVs estimated with and without including the phenotypes of young animals in the prediction was also determined.
The three versions of the H matrix were compared considering the ranking of the animals based on the estimated GEBVs. To compare the rankings, animals that had higher GEBVs for HH, i.e., top 20% of the population (top 20%, n = 339), were investigated. The Spearman rank coefficient (ρ) was used to compare the top 20%, defined as the Pearson correlation coefficient between ranked variables (Yitzhaki & Schechtman, 2013YITZHAKI, S.; SCHECHTMAN, E. The Gini methodology: a primer on a statistical methodology. New York: Springer, 2013. 548p. DOI: 10.1007/978-1-4614-4720-7.
https://doi.org/10.1007/978-1-4614-4720-...
), using the alternative formula proposed by Conover (1999)CONOVER, W.J. Practical nonparametric statistics. 3rd ed. New York: John Wiley & Sons, 1999. 578p. :
where di 2 is the difference between the ranks of each observation for two variables and n is the number of observations. The standard Pearson correlation between rankings of animals in different matrices was also estimated.
Results and Discussion
Minor variances and both diagonal and off-diagonal elements were obtained for HGOF, HGMF, HG50, and the NRM (Table 1). For the diagonal elements, the NRM showed lower variance, probably because it is incomplete and the inbreeding value of the studied population is very low, indicating that there is a weak relationship between the evaluated families. Furthermore, the NRM calculates the probability of kinship, decreasing the variances of elements. However, when genomic information was used, these families did share common alleles and the estimated relationship coefficients were different. These results were expected because genomic relationships reflect a relationship that represents the actual gene fraction shared between individuals (Choi et al., 2017CHOI, T.; LIM, D.; PARK, B.; SHARMA, A.; KIM, J.-J.; KIM, S.; LEE, S.H. Accuracy of genomic breeding value prediction for intramuscular fat using different genomic relationship matrices in Hanwoo (Korean cattle). Asian-Australasian Journal of Animal Science, v.30, p.907-911, 2017. DOI: 10.5713/ajas.15.0983.
https://doi.org/10.5713/ajas.15.0983...
). The HGMF and HG50 matrices used the same allele frequency for all markers: 0.27 average minor allele frequency or 0.50, respectively. Observed allele frequencies were distant from 0.5 for many markers (Figure 1), which may be an effect of the SNP chip development, based mostly on Bos taurus and not on B. indicus data (Gibbs et al., 2009GIBBS, R.A.; TAYLOR, J.F.; VAN TASSELL, C.P.; BARENDSE, W.; EVERSOLE, K.A.; GILL, C.A.; GREEN, R.D.; HAMERNIK, D.L.; KAPPES, S.M.; LIEN, S.; MATUKUMALLI, L.K.; MCEWAN, J.C.; NAZARETH, L.V.; SCHNABEL, R.D.; WEINSTOCK, G.M.; WHEELER, D.A.; AJMONE-MARSAN, P.; BOETTCHER, P.J.; CAETANO, A.R.; GARCIA, J.F.; HANOTTE, O.; MARIANI, P.; SKOW, L.C.; SONSTEGARD, T.S.; WILLIAMS, J.L.; DIALLO, B.; HAILEMARIAM, L.; MARTINEZ, M.L.; MORRIS, C.A.; SILVA, L.O.C.; SPELMAN, R.J.; MULATU, W.; ZHAO, K.; ABBEY, C.A.; AGABA, M.; ARAUJO, F.R.; BUNCH, R.J.; BURTON, J.; GORNI, C.; OLIVIER, H.; HARRISON, B.E.; LUFF, B.; MACHADO, M.A.; MWAKAYA, J.; PLASTOW, G.; SIM, W.; SMITH, T.; THOMAS, M.B.; VALENTINI, A.; WILLIAMS, P.; WOMACK, J.; WOOLIAMS, J.A.; LIU, Y.; QIN, X.; WORLEY, K.C.; GAO, C.; JIANG, H.; MOORE, S.S.; REN, Y.; SONG, X-Z.; BUSTAMANTE, C.D.; HERNANDEZ, R.D.; MUZNY, D.M.; PATIL, S.; SAN LUCAS, A.; FU, Q.; KENT, M.P.; VEGA, R.; MATUKUMALLI, A.; MCWILLIAM, S.; SCLEP, G.; BRYC, K.; CHOI, J.; GAO, H.; GREFENSTETTE, J.J.; MURDOCH, B.; STELLA, A.; VILLA-ANGULO, R.; WRIGHT, M.; AERTS, J.; JANN, O.; NEGRINI, R.; GODDARD, M.E.; HAYES, B.J.; BRADLEY, D.G.; SILVA, M.B. da; LAU, L.P.L.; LIU, G.E.; LYNN, D.J.; PANZITTA, F.; DODDS, K.G. Genome-wide survey of SNP variation uncovers the genetic structure of cattle breeds. Science, v.324, p.528-532, 2009. DOI: 10.1126/science.1167936.
https://doi.org/10.1126/science.1167936...
). These frequency distributions, however, were not reported by Choi et al. (2017)CHOI, T.; LIM, D.; PARK, B.; SHARMA, A.; KIM, J.-J.; KIM, S.; LEE, S.H. Accuracy of genomic breeding value prediction for intramuscular fat using different genomic relationship matrices in Hanwoo (Korean cattle). Asian-Australasian Journal of Animal Science, v.30, p.907-911, 2017. DOI: 10.5713/ajas.15.0983.
https://doi.org/10.5713/ajas.15.0983...
, who also studied B. taurus cattle.

Distribution of observed frequencies for the second allele of the genotyped Brahman cattle.
The data used to compare variance components were either the full phenotype dataset of genotyped animals (GEN, n=1,695) or a subset that included 80% of the oldest animals (old, n=1,356). In both GEN and old datasets, the variance components were similar when the matrices estimated with the same methodology were compared (i.e., the NRM of GEN was similar to that of the old dataset) (Table 2). However, when matrices estimated with different methodologies were compared, the variance components were different. These differences between matrices are in contrast with the data presented by Forni et al. (2011)FORNI, S.; AGUILAR, I.; MISZTAL, I. Different genomic relationship matrices for single-step analysis using phenotypic, pedigree and genomic information. Genetic Selection Evolution, v.43, art.1, 2011. DOI: 10.1186/1297-9686-43-1.
https://doi.org/10.1186/1297-9686-43-1...
, who detected that the additive variance was higher when the difference between the average diagonal and off-diagonal elements of the matrix was lower. In the present study, the differences in the diagonal and off-diagonal elements estimated with the NRM, HGOF, and HGMF were not significant (0.99, 1.03, and 0.93 respectively), but the additive variances differed. Forni et al. (2011)FORNI, S.; AGUILAR, I.; MISZTAL, I. Different genomic relationship matrices for single-step analysis using phenotypic, pedigree and genomic information. Genetic Selection Evolution, v.43, art.1, 2011. DOI: 10.1186/1297-9686-43-1.
https://doi.org/10.1186/1297-9686-43-1...
found this relationship was true only for HG50, which, in the present work, showed a difference of 0.68 between coefficients.
The variance components obtained using HGOF and the NRM were quite similar in the present study, which is consistent with the findings of Riley et al. (2007)RILEY, D.G.; COLEMAN, S.W.; CHASE JR., C.C.; OLSON, T.A.; HAMMOND, A.C. Genetic parameters for body weight, hip height, and the ratio of weight to hip height from random regression analyses of Brahman feedlot cattle. Journal of Animal Science, v.85, p.42-52, 2007. DOI: 10.2527/jas.2005-651.
https://doi.org/10.2527/jas.2005-651...
. Variance components in HGMF and HG50 were less similar to those in the NRM, compared with HGOF, and may have been inflated with the use of fixed allele frequencies. Several researchers related problems with inflated estimates of variance components due to false kinship coefficients (Aguilar et al., 2010AGUILAR, I.; MISZTAL, I.; JOHNSON, D.L.; LEGARRA, A.; TSURUTA, S.; LAWLOR, T.J. Hot topic: a unified approach to utilize phenotypic, full pedigree, and genomic information for genetic evaluation of Holstein final score. Journal of Dairy Science, v.93, p.743-752, 2010. DOI: 10.3168/jds.2009-2730.
https://doi.org/10.3168/jds.2009-2730...
; Forni et al., 2011FORNI, S.; AGUILAR, I.; MISZTAL, I. Different genomic relationship matrices for single-step analysis using phenotypic, pedigree and genomic information. Genetic Selection Evolution, v.43, art.1, 2011. DOI: 10.1186/1297-9686-43-1.
https://doi.org/10.1186/1297-9686-43-1...
); in this case, in HGMF and HG50 matrices that showed higher values than the NRM or HGOF.
When observed allele frequencies are distant from 0.5, “rare” alleles have greater influence on the relationship estimated, and this may be the underlying reason why HG50 and HGMF were approximated to each other and distanced from the NRM and HGOF (Figure 1). This difference between the NRM and HG50 or HGMF was not verified by Forni et al. (2011)FORNI, S.; AGUILAR, I.; MISZTAL, I. Different genomic relationship matrices for single-step analysis using phenotypic, pedigree and genomic information. Genetic Selection Evolution, v.43, art.1, 2011. DOI: 10.1186/1297-9686-43-1.
https://doi.org/10.1186/1297-9686-43-1...
, who tested the same variations of H in a population of pigs. The average minor allele frequency obtained in the studied population was similar to that reported by Forni et al. (2011)FORNI, S.; AGUILAR, I.; MISZTAL, I. Different genomic relationship matrices for single-step analysis using phenotypic, pedigree and genomic information. Genetic Selection Evolution, v.43, art.1, 2011. DOI: 10.1186/1297-9686-43-1.
https://doi.org/10.1186/1297-9686-43-1...
: 0.24 and 0.27, respectively. However, the distribution of allele frequencies was different: while in the pig population allele frequencies were all close to 0.5, in the Brahman cattle population many markers had allele frequencies distant from 0.5. The presence of these “rare” markers may reflect the fact that the families in this population can be distinct. Estimates of genetic covariance in G matrices are influenced by allele frequencies in the population. Ideally, G matrices should be estimated using the allele frequencies from the unselected base population (Forni et al., 2011FORNI, S.; AGUILAR, I.; MISZTAL, I. Different genomic relationship matrices for single-step analysis using phenotypic, pedigree and genomic information. Genetic Selection Evolution, v.43, art.1, 2011. DOI: 10.1186/1297-9686-43-1.
https://doi.org/10.1186/1297-9686-43-1...
), which is not available. In a real situation, it is practically impossible to obtain this information, and the three methods tested alternative solutions. Relationships using the observed allele frequencies can provide more accurate predictions of genetic merit than those that use only pedigree-derived relationships in the NRM methodology. It is possible that this increased accuracy was a result of more precise estimates of genetic covariance between relatives, as suggested by Clark et al. (2012)CLARK, S.A.; HICKEY, J.M.; DAETWYLER, H.D.; VAN DER WERF, J.H.J. The importance of information on relatives for the prediction of genomic breeding values and the implications for the makeup of reference data sets in livestock breeding schemes. Genetic Selection Evolution, v.44, art.4, 2012. DOI: 10.1186/1297-9686-44-4.
https://doi.org/10.1186/1297-9686-44-4...
.
On average, the choice of a relationship matrix did not influence the GEBVs, as correlations were high (Figure 2). However, when validation phenotypes were omitted (20% young omitted), the GEBVs estimated for the youngest animals in the population varied and correlations between the GEBVs from the H matrices and the NRM were lower. Choi et al. (2017)CHOI, T.; LIM, D.; PARK, B.; SHARMA, A.; KIM, J.-J.; KIM, S.; LEE, S.H. Accuracy of genomic breeding value prediction for intramuscular fat using different genomic relationship matrices in Hanwoo (Korean cattle). Asian-Australasian Journal of Animal Science, v.30, p.907-911, 2017. DOI: 10.5713/ajas.15.0983.
https://doi.org/10.5713/ajas.15.0983...
also found lower correlations between pedigree-based estimated breeding values and the GEBVs when omitting phenotype values for intramuscular fat and marbling scores in Hanwoo cattle.
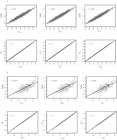
Correlations between estimated breeding values obtained by the pedigree-based numerator relationship matrix (NRM) and the genomic relationship coefficients with observed allele frequency (HGOF), average minor allele frequency (HGMF), and frequency of 0.5 for all markers (HG50), using phenotypes from all 1,695 genotyped Brahman animals (A) and omitting 20% of the phenotypic information of 339 of the top 20% animals for validation purposes (B).
The GEBVs predicted for the GEN and old datasets in all matrices did not differ significantly (Table 3). The accuracy of the GEBVs when young phenotypes were omitted decreased, which is in alignment with Forni et al. (2011)FORNI, S.; AGUILAR, I.; MISZTAL, I. Different genomic relationship matrices for single-step analysis using phenotypic, pedigree and genomic information. Genetic Selection Evolution, v.43, art.1, 2011. DOI: 10.1186/1297-9686-43-1.
https://doi.org/10.1186/1297-9686-43-1...
and Choi et al. (2017)CHOI, T.; LIM, D.; PARK, B.; SHARMA, A.; KIM, J.-J.; KIM, S.; LEE, S.H. Accuracy of genomic breeding value prediction for intramuscular fat using different genomic relationship matrices in Hanwoo (Korean cattle). Asian-Australasian Journal of Animal Science, v.30, p.907-911, 2017. DOI: 10.5713/ajas.15.0983.
https://doi.org/10.5713/ajas.15.0983...
. This was expected because the G matrices include more related animals. For the young dataset, the accuracy was lower, approximately 8%, when using the NRM rather than the inclusion of genomic information. A closer relationship between the reference and validation set showed a higher accuracy of the GEBV (Choi et al., 2017CHOI, T.; LIM, D.; PARK, B.; SHARMA, A.; KIM, J.-J.; KIM, S.; LEE, S.H. Accuracy of genomic breeding value prediction for intramuscular fat using different genomic relationship matrices in Hanwoo (Korean cattle). Asian-Australasian Journal of Animal Science, v.30, p.907-911, 2017. DOI: 10.5713/ajas.15.0983.
https://doi.org/10.5713/ajas.15.0983...
). In the present study, the average accuracy reflects more variance component estimates than predictive ability; therefore, HGOF provided a better rate than the other matrices. The average accuracy for HGOF the highest in all population scenarios. The correlations shown in the young scenario for genomic matrices were higher than those in the NRM.
Besides the advantage of HGOF presenting variance components similar to those of the NRM, it also resulted in higher accuracies for the predicted GEBVs, which may be an artefact of inflated additive variance as observed previously. It is possible that HGOF was the best option in the present study for two reasons: the presence of extreme allele frequencies observed for many markers and the fact that the validation population was not independent from the calibration dataset. As the young animals used for validation are related to the old animals (calibration), it is expected that the observed allele frequencies be similar in both subgroups of this Brahman population. In practice, animals that are related to the reference population will benefit the most from genomic selection, with higher chances of receiving accurate GEBVs. Mehrban et al. (2017)MEHRBAN, H.; LEE, D.H.; MORADI, M.H.; ILCHO, C.; NASERKHEIL, M.; IBÁÑEZ-ESCRICHE, N. Predictive performance of genomic selection methods for carcass traits in Hanwoo beef cattle: impacts of the genetic architecture. Genetics Selection Evolution, v.49, p.1-13, 2017. DOI: 10.1186/s12711-016-0283-0.
https://doi.org/10.1186/s12711-016-0283-...
evaluated methods for genomic prediction in Hanwoo cattle and found low accuracies between the training and validation groups. These lower accuracies are mainly attributed to the small training population size and to the large effective population size.
Another difference between matrices is related to the ranking of individual animals. With the selection of 20% of the genotyped animals with higher GEBVs (top 20%, n = 339), 87% of them were the same (common animals) when the NRM was compared with any of the H matrices (Table 4). Between different H matrices, 99% of the top 20% animals were the same (Figure 3). However, the ranking of these top 20% animals was different between matrices, impacting the correlations between matrices (Figure 2 B). In the comparisons between the H matrices, almost all top 20% animals were the same and the Spearman coefficient between ranking positions was higher. In the comparisons between the NRM and H matrix, the correlations between animal rankings were also similar, around 0.83.
Pearson correlations between estimated breeding values above the diagonal and Spearman coefficients calculated between the rank position of each animal below the diagonal for Brahman animals (top 20%, n=339) in common between the different matrices and that show the highest genomic estimated breeding values(1).

Correlations estimated with different relationship matrices for ranking between: A, all 1,695 genotyped Brahman animals; and B, 339 top 20% animals. Rankings were based on the estimated breeding values of all the 1,695 animals genotyped. NRM, pedigree-based numerator relationship matrix; HGOF, genomic relationship matrix with observed allele frequency; HGMF, genomic relationship matrix with average minor allele frequency; and HG50, genomic relationship matrix with frequency of 0.5 for all markers.
The top 20% animals were a similar group irrespective of which H matrix or NRM formulation was used. However, within this top 20%, the individual rankings of animals varied. Variations in the ranking of animals may be a problematic issue for the practical application of genomic selection because of commercial implications. In some countries, bull ranking is used as a marketing tool, and the bull ranked as number 1 could sell more doses of semen or achieve a higher price on an auction and sire a higher number of offspring in the following generation, for example. Evidently, if a different bull is ranked using different methods (NRM, HGOF, HGMF, and HG50), there is room for discussion and conflict of interest.
Conclusions
-
The use of the observed allele frequency (HGOF) is the best option for estimating the genomic relationship matrix and results in a higher accuracy of predictions.
-
The ranking of the top 20% animals is very similar for all matrices, but ranking within these varies depending on the method used.
Acknowledgments
To Cooperative Research Centre for Beef Genetic Technologies (Beef CRC), for resources; to Meat & Livestock Australia (MLA), for financial support to genotype the Brahman animals (project number B.NBP.0723); to Coordenação de Aperfeiçoamento de Pessoal de Nível Superior (Capes), for fellowship granted (process number 13843/12-5); to Lab of Scientific Computation Applied to Animal Science (LuCCA-Z), to Queensland Alliance for Agriculture and Food Innovation (QAAFI), and to Commonwealth Scientific and Industrial Research Organisation (CSIRO), for providing the structures for the experiment.
References
- AGUILAR, I.; MISZTAL, I.; JOHNSON, D.L.; LEGARRA, A.; TSURUTA, S.; LAWLOR, T.J. Hot topic: a unified approach to utilize phenotypic, full pedigree, and genomic information for genetic evaluation of Holstein final score. Journal of Dairy Science, v.93, p.743-752, 2010. DOI: 10.3168/jds.2009-2730.
» https://doi.org/10.3168/jds.2009-2730 - BARWICK, S.A.; JOHNSTON, D.J.; BURROW, H.M.; HOLROYD, R.G.; FORDYCE, G.; WOLCOTT, M.L.; SIM, W.D.; SULLIVAN, M.T. Genetics of heifer performance in ‘wet’ and ‘dry’ seasons and their relationships with steer performance in two tropical beef genotypes. Animal Production Science, v.49, p.367-382, 2009. DOI: 10.1071/EA08273.
» https://doi.org/10.1071/EA08273 - BOLORMAA, S.; PRYCE, J.E.; KEMPER, K.; SAVIN, K.; HAYES, B.J.; BARENDSE, W.; ZHANG, Y.; REICH, C.M.; MASON, B.A.; BUNCH, R.J.; HARRISON, B.E.; REVERTER, A.; HERD, R.M.; TIER, B.; GRASER, H.-U.; GODDARD, M.E. Accuracy of prediction of genomic breeding values for residual feed intake and carcass and meat quality traits in Bos taurus, Bos indicus, and composite beef cattle. Journal of Animal Science, v.91, p.3088-3104, 2013a. DOI: 10.2527/jas.2012-5827.
» https://doi.org/10.2527/jas.2012-5827 - BOLORMAA, S.; PRYCE, J.E.; KEMPER, K.E.; HAYES, B.J.; ZHANG, Y.; TIER, B.; BARENDSE, W.; REVERTER, A.; GODDARD, M.E. Detection of quantitative trait loci in Bos indicus and Bos taurus cattle using genome-wide association studies. Genetics Selection Evolution, v.45, art.43, 2013b.
- BRITO, L.F.; CLARKE, S.M.; MCEWAN, J.C.; MILLER, S.P.; PICKERING, N.K.; BAIN, W.E.; DODDS, K.G.; SARGOLZAEI, M.; SCHENKEL, F.S. Prediction of genomic breeding values for growth, carcass and meat quality traits in a multi-breed sheep population using a HD SNP chip. BMC Genetics, v.18, art.7, 2017. DOI: 10.1186/s12863-017-0476-8.
» https://doi.org/10.1186/s12863-017-0476-8 - BROWNING, B.L.; BROWNING, S.R. A fast, powerful method for detecting identity by descent. American Journal of Human Genetics, v.88, p.173-182, 2011. DOI: 10.1016/j.ajhg.2011.01.010.
» https://doi.org/10.1016/j.ajhg.2011.01.010 - CHOI, T.; LIM, D.; PARK, B.; SHARMA, A.; KIM, J.-J.; KIM, S.; LEE, S.H. Accuracy of genomic breeding value prediction for intramuscular fat using different genomic relationship matrices in Hanwoo (Korean cattle). Asian-Australasian Journal of Animal Science, v.30, p.907-911, 2017. DOI: 10.5713/ajas.15.0983.
» https://doi.org/10.5713/ajas.15.0983 - CHRISTENSEN, O.F.; LUND, M.S. Genomic prediction when some animals are not genotyped. Genetic Selection Evolution, v.42, art.2, 2010. DOI: 10.1186/1297-9686-42-2.
» https://doi.org/10.1186/1297-9686-42-2 - CLARK, S.A.; HICKEY, J.M.; DAETWYLER, H.D.; VAN DER WERF, J.H.J. The importance of information on relatives for the prediction of genomic breeding values and the implications for the makeup of reference data sets in livestock breeding schemes. Genetic Selection Evolution, v.44, art.4, 2012. DOI: 10.1186/1297-9686-44-4.
» https://doi.org/10.1186/1297-9686-44-4 - CONOVER, W.J. Practical nonparametric statistics. 3rd ed. New York: John Wiley & Sons, 1999. 578p.
- FORNI, S.; AGUILAR, I.; MISZTAL, I. Different genomic relationship matrices for single-step analysis using phenotypic, pedigree and genomic information. Genetic Selection Evolution, v.43, art.1, 2011. DOI: 10.1186/1297-9686-43-1.
» https://doi.org/10.1186/1297-9686-43-1 - FORTES, M.R.S.; REVERTER, A.; NAGARAJ, S.H.; ZHANG, Y.; JONSSON, N.N.; BARRIS, W.; LEHNERT, S.; BOE-HANSEN, G.B.; HAWKEN, R.J. A single nucleotide polymorphism-derived regulatory gene network underlying puberty in 2 tropical breeds of beef cattle. Journal of Animal Science, v.89, p.1669-1683, 2011. DOI: 10.2527/jas.2010-3681.
» https://doi.org/10.2527/jas.2010-3681 - GIBBS, R.A.; TAYLOR, J.F.; VAN TASSELL, C.P.; BARENDSE, W.; EVERSOLE, K.A.; GILL, C.A.; GREEN, R.D.; HAMERNIK, D.L.; KAPPES, S.M.; LIEN, S.; MATUKUMALLI, L.K.; MCEWAN, J.C.; NAZARETH, L.V.; SCHNABEL, R.D.; WEINSTOCK, G.M.; WHEELER, D.A.; AJMONE-MARSAN, P.; BOETTCHER, P.J.; CAETANO, A.R.; GARCIA, J.F.; HANOTTE, O.; MARIANI, P.; SKOW, L.C.; SONSTEGARD, T.S.; WILLIAMS, J.L.; DIALLO, B.; HAILEMARIAM, L.; MARTINEZ, M.L.; MORRIS, C.A.; SILVA, L.O.C.; SPELMAN, R.J.; MULATU, W.; ZHAO, K.; ABBEY, C.A.; AGABA, M.; ARAUJO, F.R.; BUNCH, R.J.; BURTON, J.; GORNI, C.; OLIVIER, H.; HARRISON, B.E.; LUFF, B.; MACHADO, M.A.; MWAKAYA, J.; PLASTOW, G.; SIM, W.; SMITH, T.; THOMAS, M.B.; VALENTINI, A.; WILLIAMS, P.; WOMACK, J.; WOOLIAMS, J.A.; LIU, Y.; QIN, X.; WORLEY, K.C.; GAO, C.; JIANG, H.; MOORE, S.S.; REN, Y.; SONG, X-Z.; BUSTAMANTE, C.D.; HERNANDEZ, R.D.; MUZNY, D.M.; PATIL, S.; SAN LUCAS, A.; FU, Q.; KENT, M.P.; VEGA, R.; MATUKUMALLI, A.; MCWILLIAM, S.; SCLEP, G.; BRYC, K.; CHOI, J.; GAO, H.; GREFENSTETTE, J.J.; MURDOCH, B.; STELLA, A.; VILLA-ANGULO, R.; WRIGHT, M.; AERTS, J.; JANN, O.; NEGRINI, R.; GODDARD, M.E.; HAYES, B.J.; BRADLEY, D.G.; SILVA, M.B. da; LAU, L.P.L.; LIU, G.E.; LYNN, D.J.; PANZITTA, F.; DODDS, K.G. Genome-wide survey of SNP variation uncovers the genetic structure of cattle breeds. Science, v.324, p.528-532, 2009. DOI: 10.1126/science.1167936.
» https://doi.org/10.1126/science.1167936 - GODDARD, M.E.; HAYES, B.J. Mapping genes for complex traits in domestic animals and their use in breeding programmes. Nature Reviews Genetics, v.10, p.381-391, 2009. DOI: 10.1038/nrg2575.
» https://doi.org/10.1038/nrg2575 - HAWKEN, R.J.; ZHANG, Y.D.; FORTES, M.R.S.; COLLIS, E.; BARRIS, W.C.; CORBET, N.J.; WILLIAMS, P.J.; FORDYCE, G.; HOLROYD, R.G.; WALKLEY, J.R.W.; BARENDSE, W.; JOHNSTON, D.J.; PRAYAGA, K.C.; TIER, B.; REVERTER, A.; LEHNERT, S.A. Genome-wide association studies of female reproduction in tropically adapted beef cattle. Journal of Animal Science, v.90, p.1398-410, 2012. DOI: 10.2527/jas.2011-4410.
» https://doi.org/10.2527/jas.2011-4410 - HENDERSON, C.R. Rapid method for computing the inverse of a relationship matrix. Journal of Dairy Science, v.58, p.1727-1730, 1975. DOI: 10.3168/jds.S0022-0302(75)84776-X.
» https://doi.org/10.3168/jds.S0022-0302(75)84776-X - LEGARRA, A.; AGUILAR, I.; MISZTAL, I. A relationship matrix including full pedigree and genomic information. Journal of Dairy Science, v.92, p.4656-4663, 2009. DOI: 10.3168/jds.2009-2061.
» https://doi.org/10.3168/jds.2009-2061 - MARTÍNEZ, R.; BEJARANO, D.; GÓMEZ, Y.; DASONEVILLE, R.; JIMÉNEZ, A.; EVEN, G.; SÖLKNER, J.; MÉSZÁROS, G. Genome-wide association study for birth, weaning and yearling weight in Colombian Brahman cattle. Genetics and Molecular Biology, v.40, p.453-459, 2017. DOI: 10.1590/1678-4685-gmb-2016-0017.
» https://doi.org/10.1590/1678-4685-gmb-2016-0017 - MEHRBAN, H.; LEE, D.H.; MORADI, M.H.; ILCHO, C.; NASERKHEIL, M.; IBÁÑEZ-ESCRICHE, N. Predictive performance of genomic selection methods for carcass traits in Hanwoo beef cattle: impacts of the genetic architecture. Genetics Selection Evolution, v.49, p.1-13, 2017. DOI: 10.1186/s12711-016-0283-0.
» https://doi.org/10.1186/s12711-016-0283-0 - Meyer, K. WOMBAT: a tool for mixed model analyses in quantitative genetics by restricted maximum likelihood (REML). Journal of Zhejiang University-Science B, v.8, p.815-821, 2007. DOI: 10.1631/jzus.2007.B0815.
» https://doi.org/10.1631/jzus.2007.B0815 - MISZTAL, I.; LEGARRA, A.; AGUILAR, I. Computing procedures for genetic evaluation including phenotypic, full pedigree, and genomic information. Journal of Dairy Science, v.92, p.4648-4655, 2009. DOI: 10.3168/jds.2009-2064.
» https://doi.org/10.3168/jds.2009-2064 - RILEY, D.G.; COLEMAN, S.W.; CHASE JR., C.C.; OLSON, T.A.; HAMMOND, A.C. Genetic parameters for body weight, hip height, and the ratio of weight to hip height from random regression analyses of Brahman feedlot cattle. Journal of Animal Science, v.85, p.42-52, 2007. DOI: 10.2527/jas.2005-651.
» https://doi.org/10.2527/jas.2005-651 - ROLF, M.M.; DECKER, J.E.; MCKAY, S.D.; TIZIOTO, P.C.; BRANHAM, K.A.; WHITACRE, L.K.; HOFF, J.L.; REGITANO, L.C.A.; TAYLOR, J.F. Genomics in the United States beef industry. Livestock Science, v.166, p.84-93, 2014. DOI: 10.1016/j.livsci.2014.06.005.
» https://doi.org/10.1016/j.livsci.2014.06.005 - VANRADEN, P.M. Efficient methods to compute genomic predictions. Journal of Dairy Science, v.91, p.4414-4423, 2008. DOI: 10.3168/jds.2007-0980.
» https://doi.org/10.3168/jds.2007-0980 - YITZHAKI, S.; SCHECHTMAN, E. The Gini methodology: a primer on a statistical methodology. New York: Springer, 2013. 548p. DOI: 10.1007/978-1-4614-4720-7.
» https://doi.org/10.1007/978-1-4614-4720-7
Publication Dates
-
Publication in this collection
June 2018
History
-
Received
23 Feb 2017 -
Accepted
10 Aug 2017


