Abstract:
The objective of this work was to evaluate the performance of the operational simplified surface energy balance (SSEBop) model in the estimation of the actual evapotranspiration (ETa) of soybean and bean crops irrigated by a central pivot. The model estimates were obtained from digital images of the Landsat 7 and Landsat 8 satellites, and were compared with the ETa obtained by the Bowen ratio method. The model was evaluated by the refined agreement index (dr), root mean square error (RMSE), and mean bias error (MBE). The model’s performance in the estimation of the ETa was classified by the performance index (Pi). The relationship between the estimates of the model and the Bowen ratio method showed correlation (r=0.94) and agreement (dr=0.82), with a mean square error of 0.62 mm per day and a mean bias error of 0.04 mm per day. The estimate perfomance of the SSEBop model in comparison with the Bowen ratio method, was classified as optimal (Pi=0.77), proving the SSEBop usability and precision to estimate ETa for irrigated crops, such as soybean and bean.
Index terms:
Glycine max; Phaseolus vulgaris; Bowen ratio; remote sensing; water resources management
Resumo:
O objetivo deste trabalho foi avaliar o desempenho do modelo “operational simplified surface energy balance” (SSEBop) na estimativa da evapotranspiração real (ETa) das culturas de soja e feijão irrigadas por pivô central. As estimativas do modelo foram obtidas de imagens digitais dos satélites Landsat 7 e Landsat 8 e comparadas à ETa obtida pelo método da razão de Bowen. O modelo foi avaliado pelo índice de concordância refinado (dr), pela raiz do erro médio quadrático (RMSE) e pelo erro médio absoluto (MBE). O desempenho do modelo nas estimativas da evapotranspiração real foi classificado pelo índice de desempenho (Pi). A relação entre as estimativas do modelo e o método da razão de Bowen apresentou correlação (r=0,94) e concordância (dr=0,82), com erro médio quadrático de 0,62 mm por dia e erro médio absoluto de 0,04 mm por dia. O desempenho das estimativas do modelo SSEBop, em comparação ao método da razão de Bowen, foi classificado como ótimo (Pi=0,77), o que comprova a utilidade do SSEBop e a precisão de suas estimativas de evapotranspiração real para culturas irrigadas como soja e feijão.
Termos para indexação:
Glycine max; Phaseolus vulgaris; razão de Bowen; sensoriamento remoto; gerenciamento dos recursos hídricos
Introduction
The current scenario of water usage in the Cerrado region, in Brazil, and the upcoming conflicts for this resource require evaluation and improvement of tools that can assist in the water resource management at the basin scale. Among the water variables of interest for the management, the actual crop evapotranspiration (ETa) is one of the main components for water balance in agricultural ecosystems (Carvalho et al., 2015CARVALHO, D.F. de; ROCHA, H.S. da; BONOMO, R.; SOUZA, A.P. de. Estimativa da evapotranspiração de referência a partir de dados meteorológicos limitados. Pesquisa Agropecuária Brasileira, Brasília, v.50, p.1-11, 2015. DOI: https://doi.org/10.1590/S0100-204X2015000100001.
https://doi.org/10.1590/S0100-204X201500...
), and a key parameter in studies regarding environmental assessment and management of basins (Raziei & Pereira, 2013RAZIEI, T.; PEREIRA, L.S. Estimation of ETo with Hargreaves-Samani and FAO-PM temperature methods for a wide range of climates in Iran. Agricultural Water Management, v.121, p.1-18, 2013. DOI: https://doi.org/10.1016/j.agwat.2012.12.019.
https://doi.org/10.1016/j.agwat.2012.12....
).
Through the last couple of decades, ETa estimates in large areas using remote sensing methods based on thermal infrared data have become increasingly available from a variety of satellite systems (Allen et al., 2011ALLEN, R.G.; PEREIRA, L.S.; HOWELL, T.A.; JENSEN, M.E. Evapotranspiration information reporting: I. Factors governing measurement accuracy. Agricultural Water Management, v.98, p.899-920, 2011. DOI: https://doi.org/10.1016/j.agwat.2010.12.015.
https://doi.org/10.1016/j.agwat.2010.12....
; Cammalleri et al., 2014aCAMMALLERI, C.; ANDERSON, M.C.; GAO, F.; HAIN, C.R.; KUSTAS, W.P. Mapping daily evapotranspiration at field scales over rainfed and irrigated agricultural areas using remote sensing data fusion. Agricultural and Forest Meteorology, v.186, p.1-11, 2014a. DOI: http://doi.org/10.1016/j.agrformet.2013.11.001.
https://doi.org/10.1016/j.agrformet.2013...
). Although ETa cannot be measured directly by orbital sensors, it can be estimated based on surface radiation using semi-empirical remote sensing algorithms (Gebremichael et al., 2010GEBREMICHAEL, M.; WANG, J.; SAMMIS, T.W. Dependence of remote sensing evapotranspiration algorithm on spatial resolution. Atmospheric Research, v.96, p.489-495, 2010. DOI: https://doi.org/10.1016/j.atmosres.2009.12.003.
https://doi.org/10.1016/j.atmosres.2009....
).
The main advantages of using this kind of methodology consist in the obtention of information regarding ETa, without the need of soil or crop data, which allows of a wide spatial and temporal coverage in the desired scale at a relatively low cost (Bastiaanssen et al., 2005BASTIAANSSEN, W.G.M.; NOORDMAN, E.J.M.; PELGRUM, H.; DAVIDS, G.; THORESON, B.P.; ALLEN, R.G. SEBAL model with remotely sensed data to improve water-resources management under actual field conditions. Journal of Irrigation and Drainage Engineering, v.131, p.85-93, 2005. DOI: https://doi.org/10.1061/(ASCE)0733-9437(2005)131:1(85).
https://doi.org/10.1061/(ASCE)0733-9437(...
). The technical literature on the matter presents several models that may be used for this purpose, such as the most consolidated one, but with a higher level of complexity, which are the surface energy balance algorithm for Land - Sebal (Bastiaanssen et al., 1998) and the mapping evapotranspiration at high-resolution with internalized calibration - Metric (Allen et al., 2007ALLEN, R.G.; TASUMI, M.; TREZZA, R. Satellite-based energy balance for mapping evapotranspiration with internalized calibration (METRIC) - Model. Journal of Irrigation and Drainage Engineering, v.133, p.380-394, 2007. DOI: https://doi.org/10.1061/(ASCE)0733-9437(2007)133:4(380).
https://doi.org/10.1061/(ASCE)0733-9437(...
). These models seek the complete solution to the surface energy balance.
Among the most recent models, the operational simplified surface energy balance - SSEBop (Senay et al., 2013SENAY, G.B.; BOHMS, S.; SINGH, R.K.; GOWDA, P.H.; VELPURI, N.M.; ALEMU, H.; VERDIN, J.P. Operational evapotranspiration mapping using remote sensing and weather datasets: a new parameterization for the SSEB approach. Journal of the American Water Resources Association, v.49, p.577-591, 2013. DOI: https://doi.org/10.1111/jawr.12057.
https://doi.org/10.1111/jawr.12057...
) - presents itself as a promising option, mostly for its simplicity and ease of operation to obtain evapotranspiration from orbital images. The model estimates the ETa from the local reference evapotranspiration (ETo), and of the evapotranspiration fraction, calculated from the land surface temperature (LST) obtained by remote sensing and by predefined contour conditions to the minimum and maximum latent heat flux. Unlike the Metric and Sebal models, the SSEBop parametrization assure the elimination of subjectivity in the selection of the contour conditions to the latent heat flux (Singh & Senay, 2016SINGH, R.K.; SENAY, G.B. Comparison of four different energy balance models for estimating evapotranspiration in the Midwestern United States. Water, v.8, p.1-19, 2016. DOI: https://doi.org/10.3390/w8010009.
https://doi.org/10.3390/w8010009...
).
In addition to the ETo and the LST, the estimate of the ETa by the SSEBop model requires only the air temperature at the time of the satellite overpass. Besides, the model is based on the scientific knowledge that the surface energy balance process is driven mainly by the available net radiation (Senay et al., 2013SENAY, G.B.; BOHMS, S.; SINGH, R.K.; GOWDA, P.H.; VELPURI, N.M.; ALEMU, H.; VERDIN, J.P. Operational evapotranspiration mapping using remote sensing and weather datasets: a new parameterization for the SSEB approach. Journal of the American Water Resources Association, v.49, p.577-591, 2013. DOI: https://doi.org/10.1111/jawr.12057.
https://doi.org/10.1111/jawr.12057...
). Despite its simplifications, the SSEBop maintains the approximations of models like Sebal and Metric, and has already showed satisfactory estimates in some regions of the United States.
Singh et al. (2014)SINGH, R.K.; SENAY, G.B.; VELPURI, N.M.; BOHMS, S.; SCOTT, R.L.; VERDIN, J.P. Actual evapotranspiration (water use) assessment of the Colorado River Basin at the Landsat resolution using the operational simplified surface energy balance model. Remote Sensing, v.6, p.233-256, 2014. DOI: https://doi.org/10.3390/rs6010233.
https://doi.org/10.3390/rs6010233...
evaluated the performance of the SSEBop model in estimating the annual ETa in the Colorado River basin, and observed a great agreement with the ETa obtained by the eddy covariance technique, showing 10%mean error. In a similar study in the same basin, Senay et al. (2016)SENAY, G.B.; FRIEDRICHS, M.; SINGH, R.K.; VELPURI, N.M. Evaluating Landsat 8 evapotranspiration for water use mapping in the Colorado River basin. Remote Sensing of Environment, v.185, p.171-185, 2016. DOI: https://doi.org/10.1016/j.rse.2015.12.043.
https://doi.org/10.1016/j.rse.2015.12.04...
verified mean errors from 13 to 22% in satellite crossing dates. In Nebraska, Singh & Senay (2016)SENAY, G.B.; FRIEDRICHS, M.; SINGH, R.K.; VELPURI, N.M. Evaluating Landsat 8 evapotranspiration for water use mapping in the Colorado River basin. Remote Sensing of Environment, v.185, p.171-185, 2016. DOI: https://doi.org/10.1016/j.rse.2015.12.043.
https://doi.org/10.1016/j.rse.2015.12.04...
observed a relative error of 7.1% between the estimates of the SSEBop model and the ETa obtained by the eddy covariance technique in a soybean cultivation irrigated by a central pivot.
Considering the need to evaluate the model in different regions from which it was developed, the objective of this work was to evaluate the performance of SSEBop model in estimating the actual evapotranspiration (ETa) of soybean and bean crops irrigated by a central pivot.
Materials and Methods
Soybean and bean crops were conducted in two areas irrigated by two central pivots, in the Rio Preto Basin, in the eastern of the Distrito Federal and in the state of Goiás, Brazil (Figure 1). The irrigated area A (Figure 1 A) had a central pivot capable of irrigating 51.2 ha, located at 16°12'22"S and 47°27'37"W at 990 m altitude. The irrigated area B (Figure 1 B) had a central pivot capable of irrigating 90.6 ha, and it was located at 15°54'31"S and 47°25'12"W, at 940 m altitude. According to the Köppen-Geiger´s climate classification, the region shows an Aw climate, defined as tropical savanna climate, with 1,400 mm average annual precipitation (Alvares et al., 2013bALVARES, C.A.; STAPE, J.L.; SENTELHAS, P.C.; GONÇALVES, J.L. de M.; SPAROVEK, G. Köppen’s climate classification map for Brazil. Meteorologische Zeitschrift, v.22, p.711-728, 2013b. DOI: https://doi.org/10.1127/0941-2948/2013/0507.
https://doi.org/10.1127/0941-2948/2013/0...
).

Location of the Rio Preto Basin, and positioning of the micrometeorological stations inside the irrigated areas cultivated with soybean and bean crops.
Soybean was sown on November 29, 2014 and harvested on March 15, 2015, in the irrigated area A, and sown on October 26, 2015 and harvested on February 12, 2016, in the irrigated area B. Bean was sown on April 30, 2015 and harvested on August 10, 2015, in irrigated area B. The data necessary to the Bowen ratio method were obtained by micrometeorological stations (Campbell Scientific CR3000, Logan, Utah) installed inside the irrigated areas of the pivots. The stations were equipped with sensors 083 HFP01 (Campbell Scientific Inc., Utah, USA), for measurements of relative humidity and air temperature, wind speed Met One 014A (Wind Speed Sensor), radiation balance (CNR4 Net Radiometer), and soil heat flux (HFP01 Soil Heat Flux Plate), and rain gauges (TB4 Rain Gage). The relative humidity, air temperature, and wind speed sensors were installed 1.0 and 2.0 m high from the soil surface, corresponding to the levels 1 and 2, respectively.
The Bowen ratio (β) (Bowen, 1926BOWEN, I.S. The ratio of heat losses by conduction and by evaporation from any water surface. Physical Review, v.27, p.779-787, 1926. DOI: https://doi.org/10.1103/PhysRev.27.779.
https://doi.org/10.1103/PhysRev.27.779...
; Irmak et al., 2014IRMAK, S.; SKAGGS, K.E.; CHATTERJEE, S. A review of the Bowen ratio surface energy balance method for quantifying evapotranspiration and other energy fluxes. Transactions of the ASABE, v.57, p.1657-1674, 2014. DOI: https://doi.org/10.13031/trans.57.10686.
https://doi.org/10.13031/trans.57.10686...
) establishes the relationship between the sensible and latent heat fluxes of a surface, and was obtained by the equation
in which: γ is the psychometric coefficient, considered as 0.060 kPa °C-1 for the average altitude of the region; ΔT is the air temperature difference between two levels (°C); Δe is the actual water vapor pressure difference between two levels (kPa).
In order to avoid inconsistent results of the β ratio, data rejection criteria were adopted according to Perez et al. (1999)PEREZ, P.J.; CASTELLVI, F.; IBAÑEZ, M.; ROSELL, J.I. Assessment of reliability of Bowen ratio method for partitioning fluxes. Agricultural and Forest Meteorology, v.97, p.141-150, 1999. DOI: https://doi.org/10.1016/S0168-1923(99)00080-5.
https://doi.org/10.1016/S0168-1923(99)00...
, which eliminate gradients smaller than the resolution of the sensors, and the values of β approaching -1. The latent heat flux was calculated by the equation
in which: LE is the latent heat flux (W m-2); Rn is the net radiation (W m-2); and G is the soil heat flux (W m-2).
The daily ETa was obtained by accumulating the hourly ETa, calculated by the equation
in which: ETa is the actual evapotranspiration (mm per hour); λ is the latent heat of water vaporization (≈ 2,441,000 J kg-1); and 3600 is the time in seconds relative to one hour period.
The SSEBop model was implemented in the ModelBuilder tool of the ArcGIS software version 10.4.1 (ESRI, 2016ENVIRONMENTAL SYSTEMS RESEARCH INSTITUTE. Software: ArcGIS 10.4.1 for Desktop. Redlands, 2016.) and executed in digital images related to the cultivation periods of soybean and bean crops. The images were obtained from the United States Geological Survey (USGS) correspondent to the path/row 221/71. Due to the constant presence of clouds, only scenes from the Landsat 7 satellite could be used in the processing of the SSEBop model for soybean crops. Two images were obtained for the irrigated area A (January 16, 2015 and February 1, 2015), and three images were obtained for the irrigated area B (December 2, 2015; December 18, 2015; and February 4, 2016). For the cultivation period of bean, four images were obtained from the Landsat 7 satellite (May 24, 2015; June 9, 2015; July 11, 2015; and July 27, 2015), and two images from the Landsat 8 satellite (July 19, 2015 and August 4, 2015). In order to overcome the Scan Line corrector (SLC) problem in the Landsat 7 images obtained since 2003, a correction algorithm (Fix Landsat 7 Scan Line Errors) was applied to correct the image errors.
The data required to calculate the energy balance under clear sky conditions and the Penman-Monteith FAO56 reference evapotranspiration (Allen et al., 1998ALLEN, R.G.; PEREIRA, L.S.; RAES, D.; SMITH, M. Crop evapotranspiration: guidelines for computing crop water requirements. Rome: FAO, 1998. 300p. (FAO. Irrigation and Drainage Paper, n.56).) to the irrigated area A were obtained from the Luziânia meteorological station (INMET), located 50 km from the study area. For the irrigated area B, the metereological data were obtained from a station of the research center Embrapa Cerrados, located 45 km from the study area.
As recommended by Senay et al. (2013)SENAY, G.B.; BOHMS, S.; SINGH, R.K.; GOWDA, P.H.; VELPURI, N.M.; ALEMU, H.; VERDIN, J.P. Operational evapotranspiration mapping using remote sensing and weather datasets: a new parameterization for the SSEB approach. Journal of the American Water Resources Association, v.49, p.577-591, 2013. DOI: https://doi.org/10.1111/jawr.12057.
https://doi.org/10.1111/jawr.12057...
, the air temperature at the time of satellite overpass was replaced by the maximum daily air temperature due to the absence of time data. The SSEBop model relates the maximum daily air temperature with the land surface temperature (LST) through a correction coefficient “c”, obtained for each pixel in the image in which the normalized difference vegetation index (NDVI) is higher than 0.80, which are conditions that guarantee the vegetation areas in full development. The NDVI was obtained by the equation
in which: ρNIR is the reflectance of the infrared spectral band; and ρRED is the reflectance of the red spectral band.
The LST in Kelvin was obtained, as recommended by Allen et al. (2007)ALLEN, R.G.; TASUMI, M.; TREZZA, R. Satellite-based energy balance for mapping evapotranspiration with internalized calibration (METRIC) - Model. Journal of Irrigation and Drainage Engineering, v.133, p.380-394, 2007. DOI: https://doi.org/10.1061/(ASCE)0733-9437(2007)133:4(380).
https://doi.org/10.1061/(ASCE)0733-9437(...
, by the equation
in which: K1 is the calibration constant 1 for the thermal band (666.09 and 774.88 for Landsat 7 and Landsat 8 satellites, respectively); K2 is the calibration constant 2 for the thermal band (1,282.71 and 1,321.08 for Landsat 7 and Landsat 8 satellites, respectively); Rc is the corrected thermal radiance from the surface, using spectral radiance of the thermal band (W m-2 sr-1 μm-1); ε is the land surface emissivity (dimensionless).
Rc is calculated according to the procedure suggested by Allen et al. (2007)ALLEN, R.G.; TASUMI, M.; TREZZA, R. Satellite-based energy balance for mapping evapotranspiration with internalized calibration (METRIC) - Model. Journal of Irrigation and Drainage Engineering, v.133, p.380-394, 2007. DOI: https://doi.org/10.1061/(ASCE)0733-9437(2007)133:4(380).
https://doi.org/10.1061/(ASCE)0733-9437(...
. The land surface emissivity was determined from the NVDI according to procedure suggested by Sobrino et al. (2004)SOBRINO, J.A.; JIMÉNEZ-MUÑOZ, J.C.; PAOLINI, L. Land surface temperature retrieval from LANDSAT TM 5. Remote Sensing of Environment, v.90, p.434-440, 2004. DOI: https://doi.org/10.1016/j.rse.2004.02.003.
https://doi.org/10.1016/j.rse.2004.02.00...
. The correction coefficient was obtained for each pixel of the image by the equation in which: Tscold is the LST in pixels in which NDVI > 0.80; Ta is the maximum daily air temperature, in Kelvin, obtained by the reference stations at the date of the satellite overpass.
The correction factor to each image (c) was obtained by the average of the cpixel values. The cold pixel temperature (Tc) in Kelvin was obtained by the equation Tc = c ? Ta.
The hot pixel temperature (Th) was obtained by the equation Th = Tc + dT, in which: dT is the temperature difference between the surface and the adjacent atmosphere (K), promoting the sensible heat flux.
The SSEBop model assumes equilibrium condition in the atmosphere, and the temperature difference (dT) is obtained considering the energy balance principles under clear sky conditions (Allen at al., 1998ALLEN, R.G.; PEREIRA, L.S.; RAES, D.; SMITH, M. Crop evapotranspiration: guidelines for computing crop water requirements. Rome: FAO, 1998. 300p. (FAO. Irrigation and Drainage Paper, n.56).) and maximum sensible heat flux (Bastiaanssen et al., 1998BASTIAANSSEN, W.G.M.; MENENTI, M.; FEDDES, R.A.; HOLTSLAG, A.A.M. A remote sensing surface energy balance algorithm for land (SEBAL). 1. Formulation. Journal of Hydrology, v.212-213, p.198-212, 1998. DOI: https://doi.org/10.1016/S0022-1694(98)00253-4.
https://doi.org/10.1016/S0022-1694(98)00...
; Allen et al., 2007ALLEN, R.G.; TASUMI, M.; TREZZA, R. Satellite-based energy balance for mapping evapotranspiration with internalized calibration (METRIC) - Model. Journal of Irrigation and Drainage Engineering, v.133, p.380-394, 2007. DOI: https://doi.org/10.1061/(ASCE)0733-9437(2007)133:4(380).
https://doi.org/10.1061/(ASCE)0733-9437(...
), calculated according to the equation:
in which: Rn is the clear sky net radiation (W m-2); ρa is the air density (kg m-3); Cp is the specific heat of the air at constant pressure (1,013 J kg-1 K-1); and ra is the aerodynamic resistance to heat transport, assumed as 110 s m-1, as recommended by Senay et al. (2013)SENAY, G.B.; BOHMS, S.; SINGH, R.K.; GOWDA, P.H.; VELPURI, N.M.; ALEMU, H.; VERDIN, J.P. Operational evapotranspiration mapping using remote sensing and weather datasets: a new parameterization for the SSEB approach. Journal of the American Water Resources Association, v.49, p.577-591, 2013. DOI: https://doi.org/10.1111/jawr.12057.
https://doi.org/10.1111/jawr.12057...
.
The evapotranspiration fraction and the actual evapotranspiration were calculated respectively by the following equations in which: ETf is the evapotranspiration fraction (dimensionless); ETo is the reference evapotranspiration (mm per day); k is a coefficient that scales the reference evapotranspiration into the level of a maximum ETa, adopted as 1.2 as recommended by Senay et al. (2013)SENAY, G.B.; BOHMS, S.; SINGH, R.K.; GOWDA, P.H.; VELPURI, N.M.; ALEMU, H.; VERDIN, J.P. Operational evapotranspiration mapping using remote sensing and weather datasets: a new parameterization for the SSEB approach. Journal of the American Water Resources Association, v.49, p.577-591, 2013. DOI: https://doi.org/10.1111/jawr.12057.
https://doi.org/10.1111/jawr.12057...
.
The evapotranspiration fraction is relatively constant throughout the day of the satellite overpass, so it can be used to calculate the actual evapotranspiration on the daily scale (Cammalleri et al., 2014bCAMMALLERI, C.; ANDERSON, M.C.; KUSTAS, W.P. Upscaling of evapotranspiration fluxes from instantaneous to daytime scales for thermal remote sensing applications. Hydrology and Earth System Sciences, v.18, p.1885-1894, 2014b. DOI: https://doi.org/10.5194/hess-18-1885-2014.
https://doi.org/10.5194/hess-18-1885-201...
; Chávez et al., 2008CHÁVEZ, J.L.; NEALE, C.M.U.; PRUEGER, J.H.; KUSTAS, W.P. Daily evapotranspiration estimates from extrapolating instantaneous airborne remote sensing ET values. Irrigation Science, v.27, p.67-81, 2008. DOI: https://doi.org/10.1007/s00271-008-0122-3.
https://doi.org/10.1007/s00271-008-0122-...
).
In order to evaluate the performance of the SSEBop model, the estimated ETa (ETa-SSEBop) was compared to the ETa obtained by the Bowen ratio method (ETa-BR) which is considered as a reference. The evaluation of the model was performed using the following indicators: refined agreement index (dr) (Willmott et al., 2012WILLMOTT, C.J.; ROBESON, S.M.; MATSUURA, K. A refined index of model performance. International Journal of Climatology, v.32, p.2088-2094, 2012. DOI: https://doi.org/10.1002/joc.2419.
https://doi.org/10.1002/joc.2419...
); root mean square error (RMSE); mean bias error (MBE); and performance index (Pi) of the model (Alvares et al., 2013aALVARES, C.A.; STAPE, J.L.; SENTELHAS, P.C.; GONÇALVES, J.L. de M. Modeling monthly mean air temperature for Brazil. Theoretical and Applied Climatology, v.113, p.407-427, 2013a. DOI: https://doi.org/10.1007/s00704-012-0796-6.
https://doi.org/10.1007/s00704-012-0796-...
).
The dr index ranges from -1 to 1, and represents the agreement between the ETa-SSEBop and ETa-BR. The RMSE provides information regarding the performance of the model in a short term, and indicates the actual value of the errors. The lower the value obtained for RMSE, the better the performance of the model. The MBE represents the deviation of the means, and provides information regarding the performance of the model in a long term, with negative values indicating underestimates and vice versa. The lower the absolute value of MBE, the better the performance of the model. The Pi index is obtained by the product of the Pearson correlation coefficient (r) and the dr index, and it is classified from very bad to optimal, according to its value. The criteria for interpreting the Pi index is: Pi ≥ 0.75, optimum performance; 0.6 ≤ Pi < 0.75, very good performance; 0.45 ≤ Pi < 0.6, good performance; 0.3 ≤ Pi < 0.45, tolerable performance; 0.15 ≤ Pi < 0.3, poor performance; 0 ≤ Pi < 0.15, bad performance; and Pi < 0, very bad performance.
Results and discussion
The average values of dT obtained for bean and soybean growing seasons were 14.2 and 26 K, respectively. The range of dT variation depends on location, but at the peak of the summer season this difference must remain between 20 and 25 K. In the United States, Senay et al. (2013)SENAY, G.B.; BOHMS, S.; SINGH, R.K.; GOWDA, P.H.; VELPURI, N.M.; ALEMU, H.; VERDIN, J.P. Operational evapotranspiration mapping using remote sensing and weather datasets: a new parameterization for the SSEB approach. Journal of the American Water Resources Association, v.49, p.577-591, 2013. DOI: https://doi.org/10.1111/jawr.12057.
https://doi.org/10.1111/jawr.12057...
observed that most of the vegetated regions show dT values in narrow ranges between 20 and 25 K, decreasing in the winter months due to reduced net radiation. Because it is a study carried out in the Brazilian Central Plateau, the average dT values for soybean were expected to be a little higher due to the high temperatures observed in this region. The lowest value of dT for the bean crop season is justified because the study was carried out during the winter season.
The “c” coefficient showed an average value of 0.983 for the growing periods, confirming its stability during the crop development (Table 1). In a similar study in Texas, Senay et al. (2014)SENAY, G.B.; GOWDA, P.H.; BOHMS, S.; HOWELL, T.A.; FRIEDRICHS, M.; MAREK, T.H.; VERDIN, J.P. Evaluating the SSEBop approach for evapotranspiration mapping with Landsat data using lysimetric observations in the semi-arid Texas High Plains. Hydrology and Earth Systems Sciences, v.11, p.723-756, 2014. DOI: https://doi.org/10.5194/hessd-11-723-2014.
https://doi.org/10.5194/hessd-11-723-201...
found a similar value in an application of the SSEBop model in digital images from the Landsat satellite. The correction coefficient allows of a conversion of maximum daily air temperature in temperature into maximum latent heat flux condition (Tc), eliminating the need of selection of cold pixels of the image.
The LST calculated by the SSEBop model indicated that the coldest points are located in the most humid pixels and with the most developed vegetation. This means that the higher the leaf area index, the lower the LST obtained by the model. Although the average temperature calculated by the model showed 300 K for both crops, temperature variations within the irrigated area were observed due to possible differences of humidity due to irrigation events. In the state of Texas, Senay et al. (2014)SENAY, G.B.; GOWDA, P.H.; BOHMS, S.; HOWELL, T.A.; FRIEDRICHS, M.; MAREK, T.H.; VERDIN, J.P. Evaluating the SSEBop approach for evapotranspiration mapping with Landsat data using lysimetric observations in the semi-arid Texas High Plains. Hydrology and Earth Systems Sciences, v.11, p.723-756, 2014. DOI: https://doi.org/10.5194/hessd-11-723-2014.
https://doi.org/10.5194/hessd-11-723-201...
evaluated the SSEBop model and observed temperatures of 302 K in irrigated areas, a value close to the one found in the present study. The images of the initial period of the bean cultivation (May 24, 2015; June 9, 2015; and July 11, 2015) showed gradually lower average temperatures (299.7, 298.1 and 295.6 K, respectively) as a consequence of vegetation development and the increase of the crop leaf index. However, in the middle-final period of development (July 19, 2015; July 27, 2015; and August 4, 2015), the inverse process occurred, and the average temperature increased (295.7, 298.0, and 302.8 K, respectively) as the crop approximated the senescence stage.
In the images of soybean cultivation in the irrigated area A (Figures 2 A and B), the difference of LST due to already irrigated and nonirrigated areas on the pivot, at the time of the satellite overpass on February 1, 2015, contributed to a higher spatial variance (Std=0.76) of ETa-SSEBop inside the irrigated area. However, the estimate of ETa-SSEBop showed a lower spatial variance (Std=0.47) for the image of January 16, 2015, inside the irrigated area. In the soybean cultivation in the irrigated area B (Figures 2 I, J, and K), the estimated ETa-SSEBop in the image of December 2, 2015, showed a higher variation (Std=0.27) due to the incomplete coverage of the soil by the crop, since the date in question coincided with the initial stage of the vegetative development. In the image of December 18, 2015, the ETa-SSEBop showed higher estimated values in relation to the previous image, justified by the higher value of ETo on the referred date, and by the beginning of the reproductive stage of the crop. On February 4, 2016 (Figure 2 K), the crop started its period of physiological maturation, and the ETa-SSEBop showed lower estimated values.

Spatial and temporal distribution of the ETa, estimated by the SSEBop model inside the irrigated areas, during the development of soybean and bean crops.
The patterns of ETa variation observed inside the irrigated areas have also been reported in the applications of the Sebal and Metric models. Silva et al. (2012)SILVA, B.B. da; BRAGA, A.C.; BRAGA, C.C.; OLIVEIRA, L.M.M. de; GALVÍNCIO, J.D.; MONTENEGRO, S.M.G.L. Evapotranspiração e estimativa da água consumida em perímetro irrigado do Semiárido brasileiro por sensoriamento remoto. Pesquisa Agropecuária Brasileira, v.47, p.1218-1226, 2012. DOI: https://doi.org/10.1590/S0100-204X2012000900006.
https://doi.org/10.1590/S0100-204X201200...
observed significant differences of the ETa inside the irrigated perimeter, when applying the Sebal model in the Brazilian Semiarid region. In an application of the Metric model in the same region, Folhes et al. (2009)FOLHES, M.T.; RENNÓ, C.D.; SOARES, J.V. Remote sensing for irrigation water management in the semi-arid Northeast of Brazil. Agricultural Water Management, v.96, p.1398-1408, 2009. DOI: https://doi.org/10.1016/j.agwat.2009.04.021.
https://doi.org/10.1016/j.agwat.2009.04....
verified a standard deviation up to 2.5 mm per day, inside the central pivot irrigated areas, emphasizing the benefit of using high-spatial resolution remote sensing data for ETa analysis. Despite the simplification regarding models such as Sebal and Metric, the parameterization of the SSEBop model guarantees satisfactory ETa results in comparison to the conventional models, proving to be a viable tool that is easy to apply.
As the same as the LST, the average ETa-SSEBop estimated inside the irrigated area with bean also showed a gradual increase in the vegetative development stage, with 2.55, 3.81, and 4.22 mm per day, respectively on May 24, June 9, and July 11, 2015. In the initial stage of crop development, the vegetal cover was incomplete and the actual evapotranspiration occurs at lower rates, justifying the lower estimated values of the ETa-SSEBop observed in the images from the initial period. As expected, the highest values of the ETa-SSEBop estimates were observed at dates corresponding to the full vegetal and reproductive development of the crop (July 11 and July 19, 2015), with averages of 4.22 and 4.02 mm per day, repectively. In the middle-final stage of plant development, the ETa decreased as it senescence approached, showing values of 3.81 and 3.66 mm per day, respectively on July 27 and August 4, 2015, when the crop was in the field for over 90 days.
The ETa behavior during the bean crop development stage (Figure 3) evidences its direct relationship with the NDVI, and reinforces that the principle of adopting areas with NDVI greater than 0.80 assure the areas with higher latent heat flux, and consequently higher ETa. In Southern Australia, Nouri et al. (2014)NOURI, H.; BEECHAM, S.; ANDERSON, S.; NAGLER, P. High spatial resolution worldview-2 imagery for mapping NDVI and its relationship to temporal urban landscape evapotranspiration factors. Remote Sensing, v.6, p.580-602, 2014. DOI: https://doi.org/10.3390/rs6010580.
https://doi.org/10.3390/rs6010580...
also observed a direct relationship between NDVI and ETa, when the authors found that the index vegetation obtained using high-resolution imagery and ground-based validation approaches could provide an effective predictive tool for determining ETa rates.

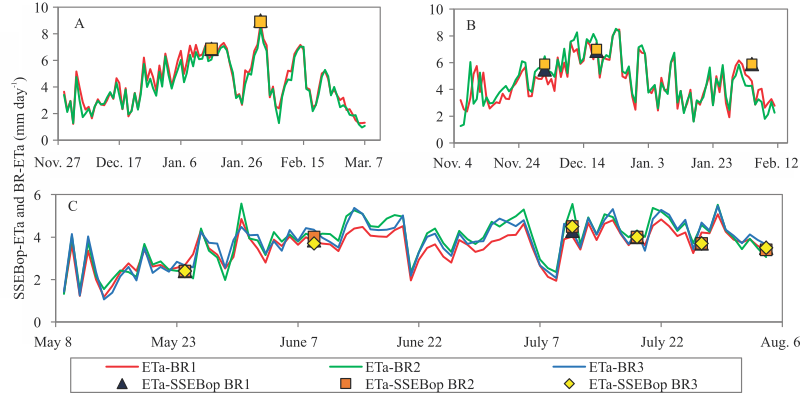
ETa obtained by the Bowen ratio method, and ETa estimated by the SSEBop model in image acquisition dates during the cultivation periods of soybean and bean crops.
The comparison between the values of ETa-SSEBop and ETa-BR in the pixels corresponding to the micrometeorological stations, in soybean irrigated areas, showed relative errors from 1.9 to 28.0% and 5.2 to 37.9%, respectively, to the BR1 and BR2 (Table 2). In the soybean cultivation of the irrigated area A, the highest estimated values of ETa by the SSEBop model were observed in the image from February 1, 2015, for both stations, mainly due to the elevated ETo (Table 1) at the date in question. As the ETa is obtained as a fraction of the reference evapotranspiration, its values are extremely influenced by these input parameters. Assessing the uncertainties of SSEBop model inputs and parameters, in several places of the USA, Chen et al.(2016)CHEN, M.; SENAY, G.B.; SINGH, R.K.; VERDIN, J.P. Uncertainty analysis of the Operational Simplified Surface Energy Balance (SSEBop) model at multiple flux tower sites. Journal of Hydrology, v.536, p.384-399, 2016. DOI: https://doi.org/10.1016/j.jhydrol.2016.02.026.
https://doi.org/10.1016/j.jhydrol.2016.0...
found that ETo may be responsible for up to 19% of errors in ETa estimates, proving that these data have an important impact on modeled output ETa.
Daily ETa-BR obtained from the micrometeorological data of each station, and ETa-SSEBop estimated by the model in the correspondent pixels, at each date of image acquisitions during the soybean and bean periods of cultivation.
In the image of July 27, the highest-percentage relative errors between the ETa estimated by the SSEBop model and that obtained by the Bowen ratio method were observed in the pixels referring to the stations BR1, BR2, and BR3. The best estimates (lower-percentage relative errors) of the ETa-SSEBop in relation to the ETa-BR were observed on August 4, 2015, in the pixels of the stations BR1 and BR3 (1.40 and 4.20%, respectively), and on June 9, 2015, in the pixels of the station BR2, which showed 0.30% percentage relative error. The highest-relative errors between the ETa-SSEBop and the ETa-BR, in the area cultivated with bean, showed an underestimate of over 20%. In the state of Texas, Senay et al. (2014)SENAY, G.B.; GOWDA, P.H.; BOHMS, S.; HOWELL, T.A.; FRIEDRICHS, M.; MAREK, T.H.; VERDIN, J.P. Evaluating the SSEBop approach for evapotranspiration mapping with Landsat data using lysimetric observations in the semi-arid Texas High Plains. Hydrology and Earth Systems Sciences, v.11, p.723-756, 2014. DOI: https://doi.org/10.5194/hessd-11-723-2014.
https://doi.org/10.5194/hessd-11-723-201...
evaluated the performance of the SSEBop model compared to weighing lysimeter data, and registered underestimates of 8 and 14%, in irrigated and nonirrigated areas, respectively. Despite some differences observed between ETa-SSEBop and ETa-RB, the model estimates are adequate for irrigated crops under different climate conditions from where the model was developed.
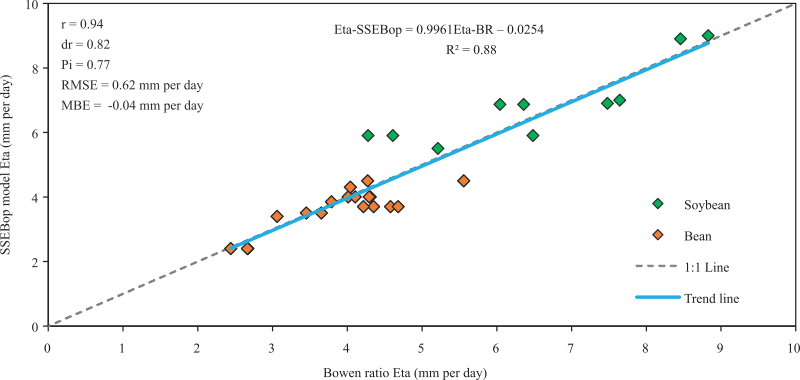
There was a positive relationship between SSEBop model and the ETa obtained by the Bowen ratio method (Figure 4). The Pearson correlation coefficient of 0.94 highlights the excellent correlation between the estimates of the SSEBop model and the Bowen ratio method, indicating that the model simulated the ETa properly. The trend line and the angular coefficient showed variations of the same magnitude between the estimates of the model and the Bowen ratio method. The correlation values obtained by the present study are similar to those obtained by Senay et al. (2014)SENAY, G.B.; GOWDA, P.H.; BOHMS, S.; HOWELL, T.A.; FRIEDRICHS, M.; MAREK, T.H.; VERDIN, J.P. Evaluating the SSEBop approach for evapotranspiration mapping with Landsat data using lysimetric observations in the semi-arid Texas High Plains. Hydrology and Earth Systems Sciences, v.11, p.723-756, 2014. DOI: https://doi.org/10.5194/hessd-11-723-2014.
https://doi.org/10.5194/hessd-11-723-201...
in the state of Texas, when the authors observed 0.93 to 0.98 for different periods of aggregation between the ETa estimated by the SSEBop model and that obtained by the weighing lysimeter. However, Singh et al (2014)SINGH, R.K.; SENAY, G.B.; VELPURI, N.M.; BOHMS, S.; SCOTT, R.L.; VERDIN, J.P. Actual evapotranspiration (water use) assessment of the Colorado River Basin at the Landsat resolution using the operational simplified surface energy balance model. Remote Sensing, v.6, p.233-256, 2014. DOI: https://doi.org/10.3390/rs6010233.
https://doi.org/10.3390/rs6010233...
reported a lower correlation (r=0.88 and R²=0.76) between the ETa estimated by the SSEBop model and that obtained by the eddy covariance method, in a study about different vegetal covers in the Colorado River basin.

Comparison between the ETa-SSEBop and the ETa-BR, highlighting the correlation (r) and agreement (dr) coefficients, and the statistical indexes RMSE and MBE.
Although the Pearson correlation coefficient showed an excellent linear relationship between the estimates of the SSEBop and Bowen ratio method, it does not contemplate the agreement between the methods, justifying the application of the Willmott’s dr index to the model estimates. The obtained dr index (dr=0.82) indicates a good agreement for the SSEBop model estimates with the Bowen ratio method, making it possible to infer that there was good agreement between the ETa-SSEBop and ETa-BR.
The statistical indicator RMSE reported a mean error of 0.62 mm per day in the SSEBop model estimates, highlighting the variations between the ETa-SSEBop and the ETa-BR at the daily scale. Evaluating the SSEBop model in comparison to the eddy covariance method in the Colorado River Basin, Senay et al. (2016)SENAY, G.B.; FRIEDRICHS, M.; SINGH, R.K.; VELPURI, N.M. Evaluating Landsat 8 evapotranspiration for water use mapping in the Colorado River basin. Remote Sensing of Environment, v.185, p.171-185, 2016. DOI: https://doi.org/10.1016/j.rse.2015.12.043.
https://doi.org/10.1016/j.rse.2015.12.04...
reported RMSE from 0.48 to 0.60 mm per day (13 to 22%), also at the daily scale. The MBE index indicated a very small underestimation (0.04 mm per day) of the ETa estimated by the SSEBop model, in relation to the ETa obtained by the Bowen ratio method. Applying the SSEBop model to images referring to a central-pivot-irrigated soybean, in Nebraska, Singh & Senay (2016)SINGH, R.K.; SENAY, G.B. Comparison of four different energy balance models for estimating evapotranspiration in the Midwestern United States. Water, v.8, p.1-19, 2016. DOI: https://doi.org/10.3390/w8010009.
https://doi.org/10.3390/w8010009...
reported higher errors in the SSEBop model estimates, when the MBE index of -0.22 mm per day showed 6.2% of underestimation, in addition to 7.1% relative error, and 0.88 mm per day RMSE, in comparison to the eddy covariance method.
The best indexes showed by the SSEBop model application to then Brazilian savanna climate conditions allows of the inference that the model is a good tool to estimate soybean and bean actual evapotranspiration. The atmospheric stability condition assumed in the simplification of the model ensures good estimates of ETa by the application of simpler procedures. Despite the mean square error pointed out by the RMSE index, the SSEBop model showed optimum performance in the ETa estimates according to the performance index (Pi=0.77), confirming its usefulness to estimate the actual evapotranspiration of irrigated crops, as soybean and bean.
Conclusion
The SSEBop model shows optimum performance to estimate soybean and bean crops actual evapotranspiration.
References
- ALLEN, R.G.; PEREIRA, L.S.; HOWELL, T.A.; JENSEN, M.E. Evapotranspiration information reporting: I. Factors governing measurement accuracy. Agricultural Water Management, v.98, p.899-920, 2011. DOI: https://doi.org/10.1016/j.agwat.2010.12.015.
» https://doi.org/10.1016/j.agwat.2010.12.015 - ALLEN, R.G.; PEREIRA, L.S.; RAES, D.; SMITH, M. Crop evapotranspiration: guidelines for computing crop water requirements. Rome: FAO, 1998. 300p. (FAO. Irrigation and Drainage Paper, n.56).
- ALLEN, R.G.; TASUMI, M.; TREZZA, R. Satellite-based energy balance for mapping evapotranspiration with internalized calibration (METRIC) - Model. Journal of Irrigation and Drainage Engineering, v.133, p.380-394, 2007. DOI: https://doi.org/10.1061/(ASCE)0733-9437(2007)133:4(380).
» https://doi.org/10.1061/(ASCE)0733-9437(2007)133:4(380) - ALVARES, C.A.; STAPE, J.L.; SENTELHAS, P.C.; GONÇALVES, J.L. de M. Modeling monthly mean air temperature for Brazil. Theoretical and Applied Climatology, v.113, p.407-427, 2013a. DOI: https://doi.org/10.1007/s00704-012-0796-6.
» https://doi.org/10.1007/s00704-012-0796-6 - ALVARES, C.A.; STAPE, J.L.; SENTELHAS, P.C.; GONÇALVES, J.L. de M.; SPAROVEK, G. Köppen’s climate classification map for Brazil. Meteorologische Zeitschrift, v.22, p.711-728, 2013b. DOI: https://doi.org/10.1127/0941-2948/2013/0507.
» https://doi.org/10.1127/0941-2948/2013/0507 - BASTIAANSSEN, W.G.M.; MENENTI, M.; FEDDES, R.A.; HOLTSLAG, A.A.M. A remote sensing surface energy balance algorithm for land (SEBAL). 1. Formulation. Journal of Hydrology, v.212-213, p.198-212, 1998. DOI: https://doi.org/10.1016/S0022-1694(98)00253-4.
» https://doi.org/10.1016/S0022-1694(98)00253-4 - BASTIAANSSEN, W.G.M.; NOORDMAN, E.J.M.; PELGRUM, H.; DAVIDS, G.; THORESON, B.P.; ALLEN, R.G. SEBAL model with remotely sensed data to improve water-resources management under actual field conditions. Journal of Irrigation and Drainage Engineering, v.131, p.85-93, 2005. DOI: https://doi.org/10.1061/(ASCE)0733-9437(2005)131:1(85).
» https://doi.org/10.1061/(ASCE)0733-9437(2005)131:1(85) - BOWEN, I.S. The ratio of heat losses by conduction and by evaporation from any water surface. Physical Review, v.27, p.779-787, 1926. DOI: https://doi.org/10.1103/PhysRev.27.779.
» https://doi.org/10.1103/PhysRev.27.779 - CAMMALLERI, C.; ANDERSON, M.C.; GAO, F.; HAIN, C.R.; KUSTAS, W.P. Mapping daily evapotranspiration at field scales over rainfed and irrigated agricultural areas using remote sensing data fusion. Agricultural and Forest Meteorology, v.186, p.1-11, 2014a. DOI: http://doi.org/10.1016/j.agrformet.2013.11.001.
» https://doi.org/10.1016/j.agrformet.2013.11.001 - CAMMALLERI, C.; ANDERSON, M.C.; KUSTAS, W.P. Upscaling of evapotranspiration fluxes from instantaneous to daytime scales for thermal remote sensing applications. Hydrology and Earth System Sciences, v.18, p.1885-1894, 2014b. DOI: https://doi.org/10.5194/hess-18-1885-2014.
» https://doi.org/10.5194/hess-18-1885-2014 - CARVALHO, D.F. de; ROCHA, H.S. da; BONOMO, R.; SOUZA, A.P. de. Estimativa da evapotranspiração de referência a partir de dados meteorológicos limitados. Pesquisa Agropecuária Brasileira, Brasília, v.50, p.1-11, 2015. DOI: https://doi.org/10.1590/S0100-204X2015000100001.
» https://doi.org/10.1590/S0100-204X2015000100001 - CHÁVEZ, J.L.; NEALE, C.M.U.; PRUEGER, J.H.; KUSTAS, W.P. Daily evapotranspiration estimates from extrapolating instantaneous airborne remote sensing ET values. Irrigation Science, v.27, p.67-81, 2008. DOI: https://doi.org/10.1007/s00271-008-0122-3.
» https://doi.org/10.1007/s00271-008-0122-3 - CHEN, M.; SENAY, G.B.; SINGH, R.K.; VERDIN, J.P. Uncertainty analysis of the Operational Simplified Surface Energy Balance (SSEBop) model at multiple flux tower sites. Journal of Hydrology, v.536, p.384-399, 2016. DOI: https://doi.org/10.1016/j.jhydrol.2016.02.026.
» https://doi.org/10.1016/j.jhydrol.2016.02.026 - ENVIRONMENTAL SYSTEMS RESEARCH INSTITUTE. Software: ArcGIS 10.4.1 for Desktop. Redlands, 2016.
- FOLHES, M.T.; RENNÓ, C.D.; SOARES, J.V. Remote sensing for irrigation water management in the semi-arid Northeast of Brazil. Agricultural Water Management, v.96, p.1398-1408, 2009. DOI: https://doi.org/10.1016/j.agwat.2009.04.021.
» https://doi.org/10.1016/j.agwat.2009.04.021 - GEBREMICHAEL, M.; WANG, J.; SAMMIS, T.W. Dependence of remote sensing evapotranspiration algorithm on spatial resolution. Atmospheric Research, v.96, p.489-495, 2010. DOI: https://doi.org/10.1016/j.atmosres.2009.12.003.
» https://doi.org/10.1016/j.atmosres.2009.12.003 - IRMAK, S.; SKAGGS, K.E.; CHATTERJEE, S. A review of the Bowen ratio surface energy balance method for quantifying evapotranspiration and other energy fluxes. Transactions of the ASABE, v.57, p.1657-1674, 2014. DOI: https://doi.org/10.13031/trans.57.10686.
» https://doi.org/10.13031/trans.57.10686 - NOURI, H.; BEECHAM, S.; ANDERSON, S.; NAGLER, P. High spatial resolution worldview-2 imagery for mapping NDVI and its relationship to temporal urban landscape evapotranspiration factors. Remote Sensing, v.6, p.580-602, 2014. DOI: https://doi.org/10.3390/rs6010580.
» https://doi.org/10.3390/rs6010580 - PEREZ, P.J.; CASTELLVI, F.; IBAÑEZ, M.; ROSELL, J.I. Assessment of reliability of Bowen ratio method for partitioning fluxes. Agricultural and Forest Meteorology, v.97, p.141-150, 1999. DOI: https://doi.org/10.1016/S0168-1923(99)00080-5.
» https://doi.org/10.1016/S0168-1923(99)00080-5 - RAZIEI, T.; PEREIRA, L.S. Estimation of ETo with Hargreaves-Samani and FAO-PM temperature methods for a wide range of climates in Iran. Agricultural Water Management, v.121, p.1-18, 2013. DOI: https://doi.org/10.1016/j.agwat.2012.12.019.
» https://doi.org/10.1016/j.agwat.2012.12.019 - SENAY, G.B.; BOHMS, S.; SINGH, R.K.; GOWDA, P.H.; VELPURI, N.M.; ALEMU, H.; VERDIN, J.P. Operational evapotranspiration mapping using remote sensing and weather datasets: a new parameterization for the SSEB approach. Journal of the American Water Resources Association, v.49, p.577-591, 2013. DOI: https://doi.org/10.1111/jawr.12057.
» https://doi.org/10.1111/jawr.12057 - SENAY, G.B.; FRIEDRICHS, M.; SINGH, R.K.; VELPURI, N.M. Evaluating Landsat 8 evapotranspiration for water use mapping in the Colorado River basin. Remote Sensing of Environment, v.185, p.171-185, 2016. DOI: https://doi.org/10.1016/j.rse.2015.12.043.
» https://doi.org/10.1016/j.rse.2015.12.043 - SENAY, G.B.; GOWDA, P.H.; BOHMS, S.; HOWELL, T.A.; FRIEDRICHS, M.; MAREK, T.H.; VERDIN, J.P. Evaluating the SSEBop approach for evapotranspiration mapping with Landsat data using lysimetric observations in the semi-arid Texas High Plains. Hydrology and Earth Systems Sciences, v.11, p.723-756, 2014. DOI: https://doi.org/10.5194/hessd-11-723-2014.
» https://doi.org/10.5194/hessd-11-723-2014 - SILVA, B.B. da; BRAGA, A.C.; BRAGA, C.C.; OLIVEIRA, L.M.M. de; GALVÍNCIO, J.D.; MONTENEGRO, S.M.G.L. Evapotranspiração e estimativa da água consumida em perímetro irrigado do Semiárido brasileiro por sensoriamento remoto. Pesquisa Agropecuária Brasileira, v.47, p.1218-1226, 2012. DOI: https://doi.org/10.1590/S0100-204X2012000900006.
» https://doi.org/10.1590/S0100-204X2012000900006 - SINGH, R.K.; SENAY, G.B. Comparison of four different energy balance models for estimating evapotranspiration in the Midwestern United States. Water, v.8, p.1-19, 2016. DOI: https://doi.org/10.3390/w8010009.
» https://doi.org/10.3390/w8010009 - SINGH, R.K.; SENAY, G.B.; VELPURI, N.M.; BOHMS, S.; SCOTT, R.L.; VERDIN, J.P. Actual evapotranspiration (water use) assessment of the Colorado River Basin at the Landsat resolution using the operational simplified surface energy balance model. Remote Sensing, v.6, p.233-256, 2014. DOI: https://doi.org/10.3390/rs6010233.
» https://doi.org/10.3390/rs6010233 - SOBRINO, J.A.; JIMÉNEZ-MUÑOZ, J.C.; PAOLINI, L. Land surface temperature retrieval from LANDSAT TM 5. Remote Sensing of Environment, v.90, p.434-440, 2004. DOI: https://doi.org/10.1016/j.rse.2004.02.003.
» https://doi.org/10.1016/j.rse.2004.02.003 - WILLMOTT, C.J.; ROBESON, S.M.; MATSUURA, K. A refined index of model performance. International Journal of Climatology, v.32, p.2088-2094, 2012. DOI: https://doi.org/10.1002/joc.2419.
» https://doi.org/10.1002/joc.2419
Publication Dates
-
Publication in this collection
27 June 2019 -
Date of issue
2019
History
-
Received
26 Apr 2018 -
Accepted
23 Nov 2018