ABSTRACT
One of the major bottlenecks in the postharvest commercialization of coconut fruits is the black rot disease, caused by the fungus Ceratocystis paradoxa. This disease has been neglected in the main production areas or associated with other coconut diseases. To date, there are no standardized methods for assessing the intensity of such a problem. In this sense, the aim of our study was to prepare and validate a diagrammatic scale to evaluate the disease severity in coconut fruits. We also tested the scale applicability comparing distinct C. paradoxa isolates on inoculated fruits. For such quantification, the fruit longitudinal sectioning was necessary, allowing the visualization of internal symptoms. The proposed scale showed good repeatability and high reproducibility, with absolute errors around 8%, while the coefficient of determination presented an average of 91% with the aid of the scale and of 59% without the scale. In addition, symptom analyses showed that the outer necrosis does not match the internal damage. Therefore, we suggest in this study that the severity estimate of this disease be obtained by using the presented scale.
Keywords
Epidemiology; Pathometry; Disease severity
RESUMO
Um dos principais problemas na comercialização de frutos de coco em pós-colheita tem sido a podridão negra, causada pelo fungo Ceratocystis paradoxa. Esta doença tem sido negligenciada nas principais áreas produtoras ou associadas à outras doenças da cultura. Até o presente momento, não existem métodos padronizados para a avaliação da intensidade de tal problema. Neste sentido, o objetivo do nosso estudo foi preparar e validar uma escala diagramática para avaliar a severidade da doença em frutos de coco. Com isso, foi possível testar a aplicabilidade da escala comparando diferentes isolados de C. paradoxa em frutos inoculados. Para esta quantificação, o seccionamento longitudinal do fruto foi necessário, permitindo a visualização interna dos sintomas. Dessa forma, a escala proposta apresentou boa repetibilidade e alta reprodutibilidade, com erros absolutos em torno de 8% e coeficientes de determinação com médias de 91% com o auxílio da escala e de 59% sem a escala. Além disso, as análises sintomáticas mostraram que uma necrose exterior não corresponde ao dano interno. Por isso, indica-se neste trabalho, a estimativa da severidade desta doença através da escala apresentada.
Palavras-chave
Epidemiologia; Patometria; Severidade de doença
In Brazil, coconut palm (Cocos nucifera L.) crop has been affected by stem bleeding disease, caused by the fungus Ceratocystis paradoxa (Dade) C. Moreau, which is also known by plant pathologists as its common anamorph (imperfect state) Thielaviopsis paradoxa (De Seyn) Hölh. Considering coconut fruit production, which is destined to fresh fruit commercialization and exportation for coconut water consumption, that fungal species was recently identified causing fruit rot or fruit black rot (1515 Pinho, D.B.; Dutra, D.C.; Pereira, O.L. Notes on Ceratocystis paradoxa causing internal post-harvest rot disease on immature coconut in Brazil. Tropical Plant Pathology, Brasília, DF, v.38, p.152–157, 2013. DOI: 10.1590/S1982-56762013000200010
https://doi.org/10.1590/S1982-5676201300...
). Diseases caused by this fungus, leading to postharvest losses, have also affected other fruit crops such as peach palm (1010 Garcia, A.; Souza, V.F. As doenças de pupunheira (Bactris gasipaes) na Amazônia e medidas de controle. Porto-Velho: EMBRAPA-CPAF, 1998. v.4, 13p.), cocoa (1414 Magalhães, D.M.A.; Luz, E.D.M.N.; Lopes, U.V.; Silva, S.D.V.M.; Damaceno V.O.; Niella, A.R.R. A new method for early detection of Ceratocystis spp. on various hosts. Agrotrópica, Ilhéus, v.27, p.209–214, 2015.), date palm (1919 Suleman, P.; Al-Musallam, A.; Menezes, C.A. The effect of solute potential and water stress on black scorch caused by Chalara paradoxa and Chalara radicicola on date palms. Plant Disease, St. Paul v.85, p.80–83, 2001. DOI: 10.1094/PDIS.2001.85.1.80
https://doi.org/10.1094/PDIS.2001.85.1.8...
), pineapple (33 Brito, N.M.; Neves, C.M.L.; Ribeiro, V.V. Alternativas de controle de Chalara paradoxa na pós-colheita de abacaxi. Revista Caatinga, Mossoró, v.24, p.52–58, 2011.) and banana (22 Alvindia, D.G.; Natsuaki K.T. Evaluation of fungal epiphytes isolated from banana fruit surfaces for biocontrol of banana crown rot disease. Crop Protection, London, v.27, p.1200–1207, 2008. DOI: 10.1016/j.cropro.2008.02.007
https://doi.org/10.1016/j.cropro.2008.02...
). This species was isolated from the sap of infected coconut trees (1212 Lopes, P.G.N.; Locatelli, T.; Siqueira, J.A.M.; Dias, V.M. Detecção de Ceratocystis paradoxa em seiva de coqueiros. In: Congresso Brasileiro de Fitopatologia, 45., 2012, Manaus. Anais. Manaus, 2012. p.288.). Etiology and epidemiology of this disease have not been studied accordingly to define economically reasonable control strategies. Symptoms in the fruits could vary according to the phenological stage, the environmental conditions and the diversity of the pathogen population since virulence in fruits is little known (15)
Ceratocystis paradoxa incidence and damage to the Brazilian coconut crop have been apparently neglected until recently. Although it has often been the first cause of the disease in this country (2525 Warwick, D.R.N.; Ferreira, J.M.S.; Passos, E.E.M. Ocorrência de resinose do estipe do coqueiro em Sergipe provocada por Chalara paradoxa. Fitopatologia Brasileira, Brasília, DF, v.29, p.171, 2004., 2626 Warwick, D.R.N.; Passos, E.E.M. Outbreak of stem bleeding in coconuts caused by Thielaviopsis paradoxa in Sergipe, Brazil. Tropical Plant Pathology, Brasília, DF, v.34, p.175–177, 2009. DOI: 10.1590/S1982-56762009000300007
https://doi.org/10.1590/S1982-5676200900...
), Alves & Lourd (11 Alves, M.L.B.; Lourd, M. Podridão negra de frutos de coco causada por Ceratocystis paradoxa em Manaus AM. Fitopatologia Brasileira, Manaus, v.10, p.233, 1985.) reported this fungus causing immature fruit drop and affecting coconut production. In the last century, disease outbreaks were reported in Rio de Janeiro State, causing black rot and stem bleeding, which became the first official record of this pathogenic association (1717 Rossetti, V. “Crostas pretas” das folhas e “podridão basal” dos frutos do coqueiro. O Biológico, São Paulo, v.21, p.54, 1955., 66 Cardoso, R.M.G. Coqueiro com doenças diversas. O Biológico, São Paulo, v.30, p.239, 1964.).
Lack of information about its pathogenesis has led to variations in the fungus latent period, stipe, distribution and colonization of other parts of the infected plants, making difficult to establish effective measures to prevent and control the disease, especially when the fungus focuses on inflorescence, infructescence and fruit in the postharvest. In the latter case, C. paradoxa develops and infects, causing black rot, often confused with stem-end rot in fruits, which has as etiologic agent the fungus Lasiodiplodia theobromae (Pat.) Griffon and Maubl, another important pathogen of coconut palm (99 Freire, M.G.M.; Souza, C.L.M.; Portal, T.P.; Machado, R.M.A.; Santos, P.H.D.; Dias, V.M. Effect of castor bean oil on post harvest fungal pathogen of coconut: Lasiodiplodia theobromae. Journal of Plant Physiology & Pathology, Los Angeles, v.1, p.1-7, 2013. DOI: 10.4172/2329-955X.1000108
https://doi.org/10.4172/2329-955X.100010...
). The two diseases are similar in early stages of symptom development in harvested fruits, making difficult to reach the correct diagnosis which, in this case, could be obtained based on indirect isolation or presence of signs of the pathogen. Black rot intensity varies according to the environmental conditions and the presence of a latent fungus; internal rot can also be observed, even in green coconuts, making their commercialization unfeasible and changing the taste of their water (2222 Viana, F.M.P.; Freire, F.C.O.; Barguil, B.M.; Alves, R.E.; Santos, A.A.; Cardoso, J.E.; Vidal, J.C. Post-harvest basal rot of coconut fruits in the State of Ceara, Brazil. Fitopatologia Brasileira, Brasília, DF, v.7, p.545, 2002., 1515 Pinho, D.B.; Dutra, D.C.; Pereira, O.L. Notes on Ceratocystis paradoxa causing internal post-harvest rot disease on immature coconut in Brazil. Tropical Plant Pathology, Brasília, DF, v.38, p.152–157, 2013. DOI: 10.1590/S1982-56762013000200010
https://doi.org/10.1590/S1982-5676201300...
).
Estimate of black rot intensity in fruits, when performed, has been exclusively for the incidence, by assessing or using descriptive scales of scores (2020 Tzeng, S.J.; Sun, E.J. Fruit basal rot of coconut caused by Ceratocystis paradoxa. Plant Pathology Bulletin, Taichung, v.18, p.67–74, 2009.), impairing the precise quantification of the injured area or volume. On the other hand, severity evaluation allows the quantification of the lesionedarea, and the estimates could be used to statistically compare treatments, e.g., virulence of fungal isolates. To date, there is no standard method to evaluate the disease in postharvest coconut fruits. Thereby, in this study we propose to develop and validate a diagrammatic scale for black rot severity assessment in postharvest coconut fruits, supporting studies of variability among different isolates of Ceratocystis paradoxa in this crop.
MATERIAL AND METHODS
Fungal culture
Ceratocystis paradoxa isolates were obtained from the Mycology Collection of UENF Plant Disease Clinics; they were isolated from coconut stipe, infected rachis and fruits with postharvest symptoms of black rot. Cultures were kept on Petri dishes containing potato-dextrose agar (PDA) and stored in a freezer at -18 °C.
Coconut fruit inoculation assay
Fruits were harvested from pesticide-free orchards, without disease symptoms or pest injuries. They were surface-disinfested with sodium hypochlorite (0.3%) for 5 minutes and rinsed with water. After air-drying, tissue blocks of 10mm diameter and 10mm depth were removed from the basal portion of each fruit (bracts were not removed) using a cork borer to cause injuries. An assay was set up with 120 fruits that were randomly inoculated with mycelial plugs (0.4mm diameter) obtained from cultures grown for 7 days and taken from the colony marginal growth zone, reversely placed on the fruit inoculation site. Control fruits were treated only with PDA disks without the fungus. All fruits were maintained for 12 days at 28 °C.
Disease progress assessment and diagrammatic scale design
During the incubation period, approximately ten fruits were opened at 2-day intervals. For this procedure, coconut water was extracted with a manual punch and, to standardize the region for the disease severity evaluation, fruits were longitudinally sectioned, so that the coconut central axis was exposed.
Before oxidation of internal tissues, only the lesioned area was painted with black ink to facilitate the visualization of the caused symptoms. Thereafter, we photographed each half of the fruit with a digital camera Canon® Ti5 to obtain a full, flat mesocarp image, comparing the extension of the healthy area to that of the lesioned area.
The flat areas (%), full and lesioned, were determined by using Quant® software (2121 Vale, F.X.R.; Fernandes Filho E.; Liberato J.R. Quant-Quantificação de doenças. Versão 1.0.1. Viçosa: Christchurch assessment, 2001.), based on the Weber-Fechner law of visual acuity (1111 Horsfall, J.G.; Cowling, E.B. Pathometry: the measurement of plant disease. In: Horsfall, J.G.; Cowling, E.B. (Ed.). Plant Disease: an advanced treatise how disease develops in populations. New York: Academic Press, 1978, cap.6, p.119-136.), as well as the form, distribution and frequency of injuries to develop the diagrammatic scale.
The selected pictures were grouped, creating a disease gradient that allowed distinction of the selected percentage levels among evaluators. We selected 60 pictures of lesioned fruits with different internal postharvest rot severity levels, as reported by Celoto & Papa (77 Celoto, M.I.B.; Papa, M.E.S. Elaboração e validação de escala diagramática para quantificação da mancha alvo em folhas de acerola. Tropical Plant Pathology, Brasília, v.35, n., p.258-262, 2010. DOI: 10.1590/S1982-56762010000400010
https://doi.org/10.1590/S1982-5676201000...
), according to the grouping performed above, which was obtained in PowerPoint software (MS Office 2013®). A random sequence of the 60 slides was presented to 12 raters, on three consecutive occasions, at 7-day intervals. In the first presentation, raters estimated the severity in each picture without the aid of the proposed diagrammatic scale. In the next two times, the same raters used the provided scale as an aid to estimate values; the last evaluation was to verify reproducibility.
Accuracy and precision were determined for data from each rater using simple linear regression obtained from the actual severity (independent variable) and the visually estimated severity (dependent variable) found by each rater. To validate the use of the proposed scale, the same procedure was adopted, comparing the estimated performance of the two evaluations, without and with the use of the scale. The reproducibility and the consistency of the used scale were evaluated by comparing the second and the third evaluations made with the aid of the proposed scale. The precision of estimates was obtained based on the determination coefficient (R2) and absolute error variance (differences between actual and estimated values). Accuracy was assessed based on regression parameters “a” and “b” of the equation Ŷ = a + bY, where Ŷ is the raters’ visual estimates and Y is the real values of the lesioned fruit area quantified by digital images on Quant program. Coefficients a and b are the intercept and linear angular inclination, respectively. The coefficients a and b were compared with values 0 and 1 at “t” test (p <0.05), without and with the used scale, respectively, as recommended by Campbell & Madden (55 Campbell, C.L.; Madden, L.V. Introduction to plant disease epidemiology. New York: J. Wiley, 1990. 532p.).
Comparison of Ceratocystis paradoxa isolates for aggressiveness to coconut fruits
Once the diagrammatic scale was designed and validated, coconut fruits were inoculated with six C. paradoxa isolates (Table 1). Isolates constituted the treatments and non-inoculated fruits, the control. Coconuts were arranged completely at random, with three replicates, totaling 21 half fruits. The used experimental unit was the fruit half, evaluating the two parts of the fruit.
Ceratocystis paradoxa isolates from different sources used for inoculation in coconut fruits to evaluate the aggressiveness with the diagrammatic scale.
The test continued for 8 days under the same incubation conditions, as described above for the inoculation period. After the incubation period, the fruit was longitudinally cut and directly evaluated using the proposed diagrammatic scale.
The mean percentage of damaged areas was evaluated according to analysis of variance, and significant averages for treatments were compared based on Scott- Knott test, at 5 % probability, using the “ExpDes” package (88 Ferreira, E.B.; Cavalcanti, P.P.; Nogueira, D.A. ExpDes: an R package for ANOVA and experimental designs. Applied Mathematics, London, v.5, p.2952–2958, 2014.) in R software (1616 R Development Core Team. .: a language and environment for statistical computing. Vienna: R Found. Stat. Comput., 2015.).
RESULTS AND DISCUSSION
The diagrammatic scale proposed in our study has eight severity levels: 0.3, 2, 5, 9, 15, 25, 40, and 70% (Figure 1). Variations could be distinguished in the progress of fruit black rot over eight days after C. paradoxa inoculation.
Diagrammatic scale proposed for the evaluation of coconut black rot severity, caused by Ceratocystis paradoxa. Values are the percentage (%) of internal fruit area with disease symptoms.
In assessments without using the diagrammatic scale, for 16.6% raters, intercept values (a) were significantly different from zero (p = 0.05), and there was a tendency to underestimate the severity, indicating the presence of constant negative deviations to 58% of disease severity levels (Table 2 ).
Intercept value (a), linear angular coefficient (b) and determination coefficient (R2) of linear regression equations that relate visual estimates of coconut black rot severity in fruits (Ceratocystis paradoxa), obtained by raters with and without the aid of the diagrammatic scale.
The linear angular coefficient (b), for 58% raters, was significantly different from 1 without the use of the diagrammatic scale, compared to its use in the first evaluation (Table 2). In the third assessment, for 80% raters, the linear angular coefficient was significantly different from 1 (p = 0.05), indicating that the use of the scale improved the accuracy of visual estimates.
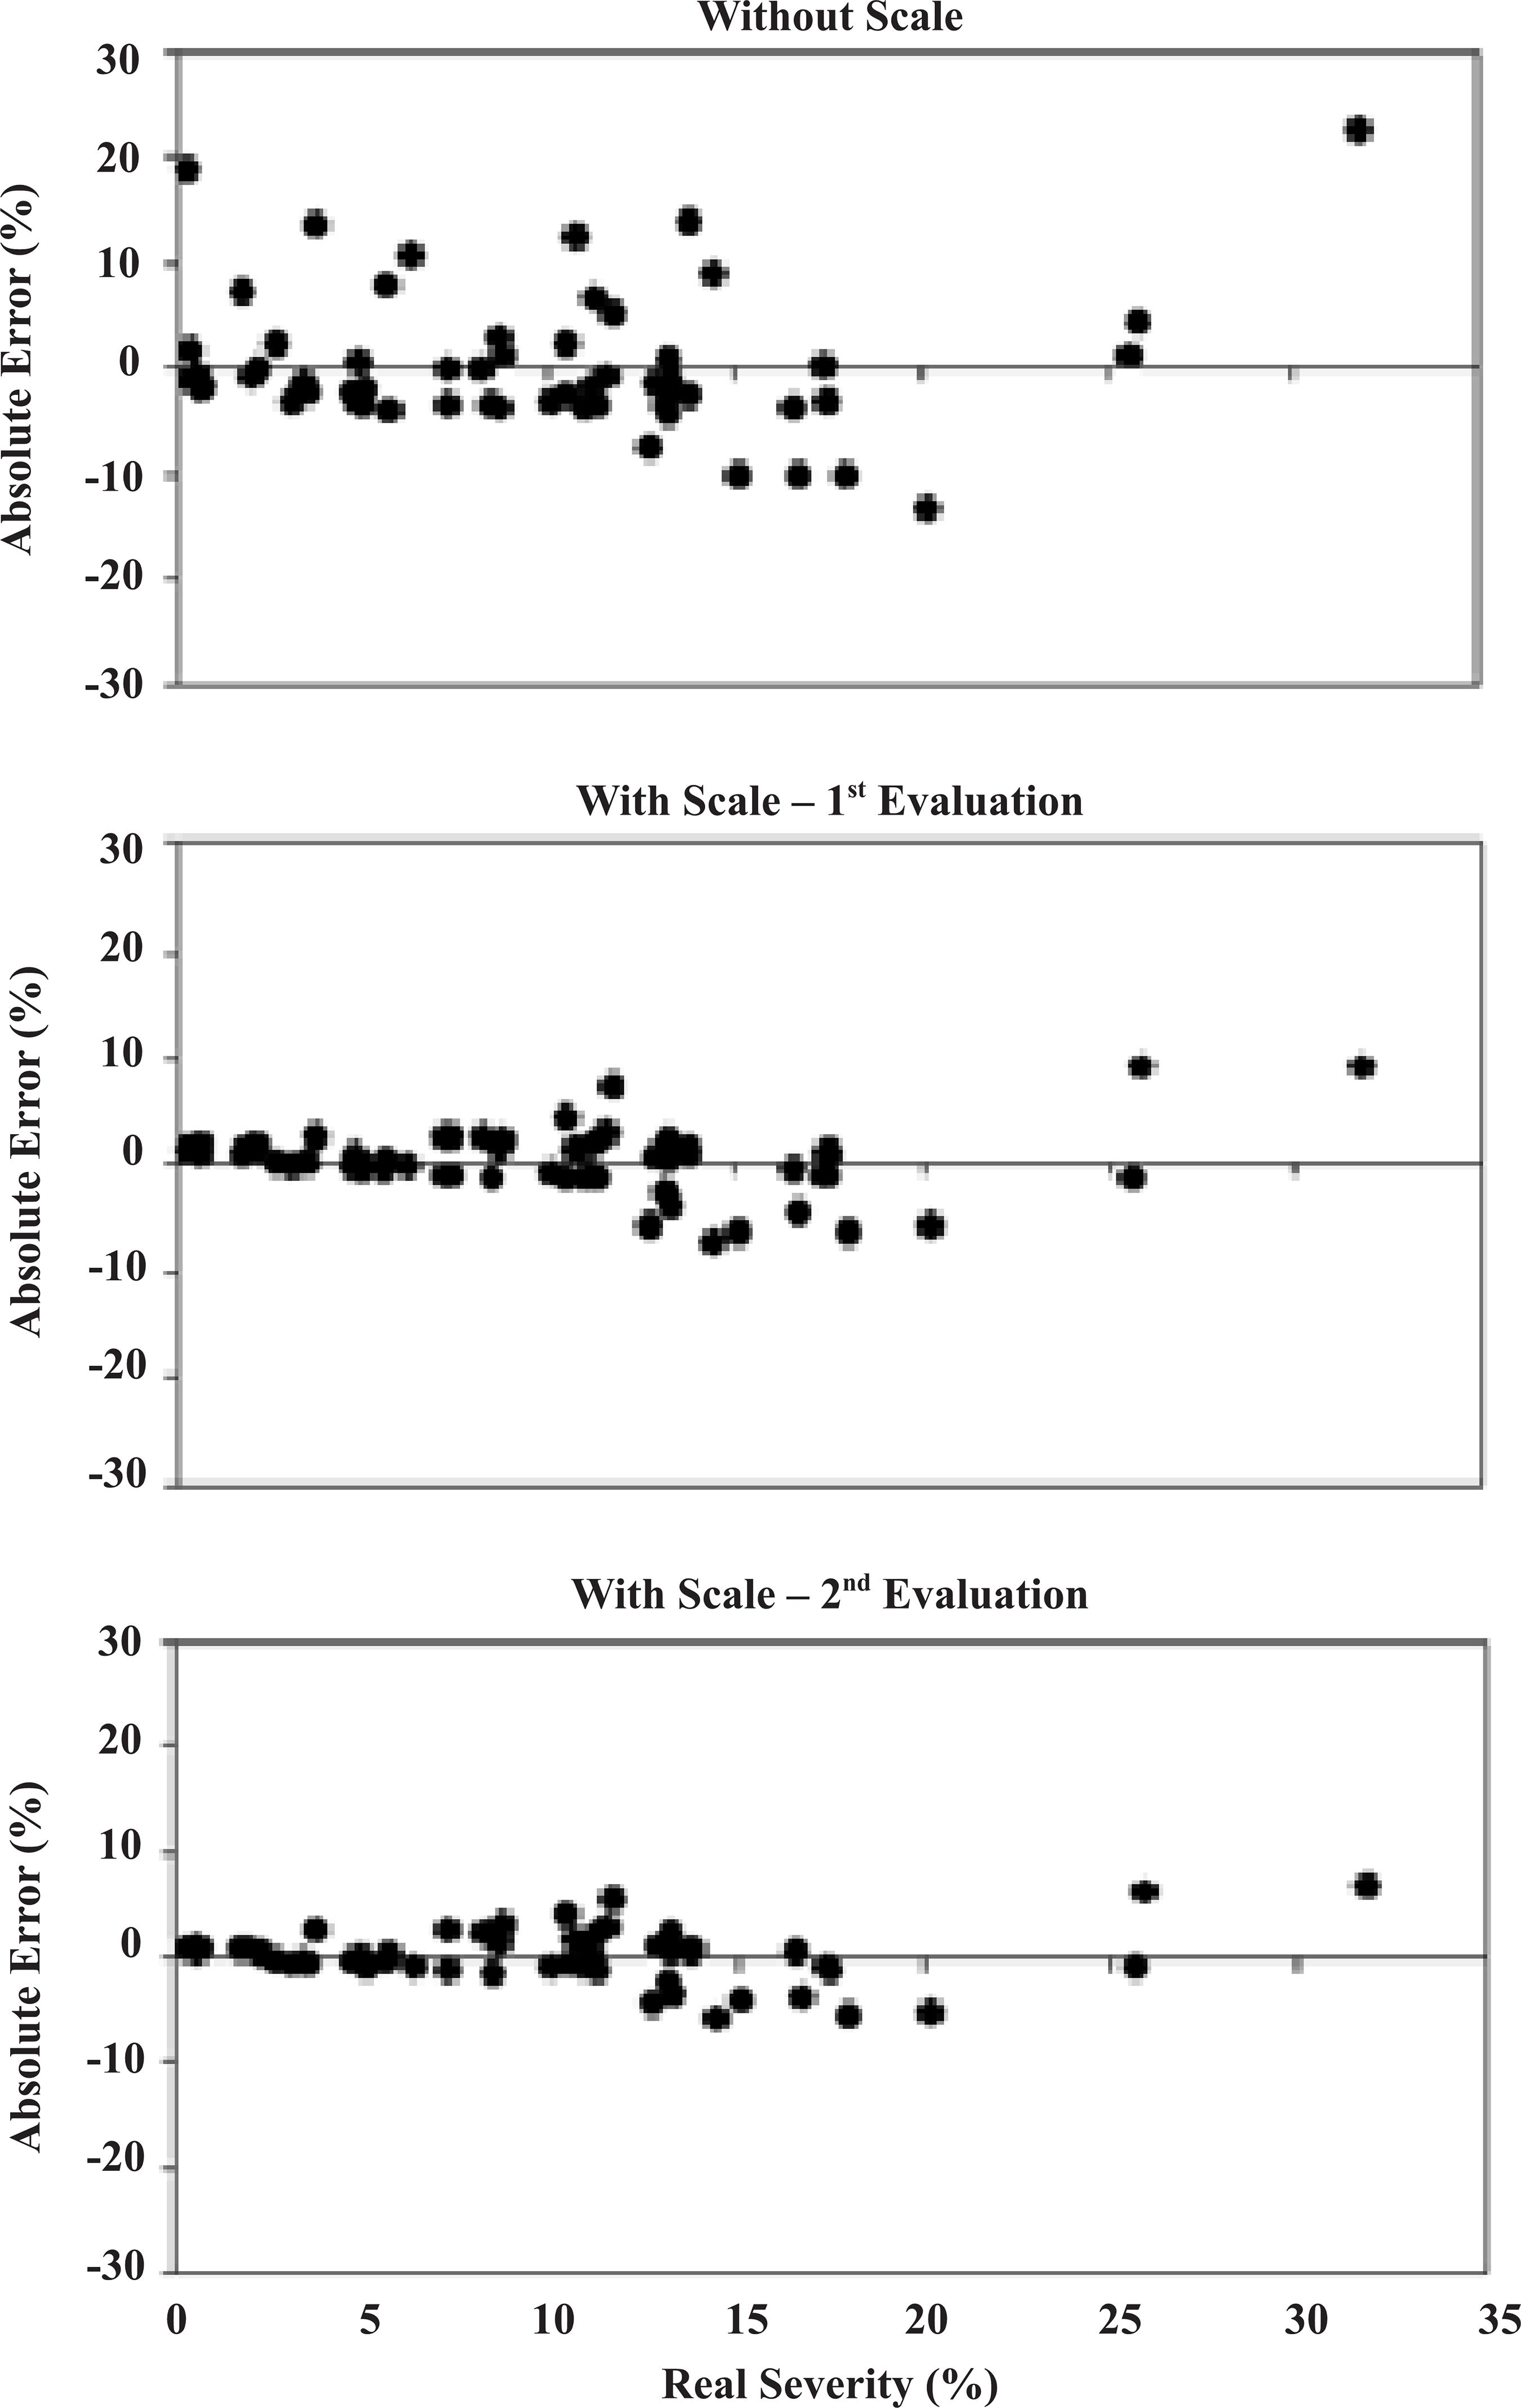
Residual distribution by raters without the use of the scale showed greater error deviations, higher than 10% (Figure 2). However, with the diagrammatic scale, the maximum error was 10%, most concentrated in the 5-8% range.
Means of residual distribution (estimated severity - real severity) of black rot (Ceratocystis paradoxa) estimates in postharvest coconut fruits, assessed with and without the diagrammatic scale in three evaluations.
In the practical disease assessment, the consistency of the proposed scale could be verified, allowing visual distinction between the different inoculated isolates (Figure 3) when fruits were longitudinally sectioned and calculation of the mean percentage (Figure 4).
Coconuts inoculated with six different Ceratocystis paradoxa isolates, showing external (superior pictures) and internal symptoms (inferior pictures) of postharvest black rot after eight days of incubation
Severity means of Ceratocystis paradoxa isolates inoculated in coconut fruits evaluated with the diagrammatic scale. Means with the same capital letters do not differ based on the Scott-Knott test (p> 0.05).
The diagrams shown in Figure 1 represent the internal injury in halved fruits, which generally affects the fruit content, but as external lesions are always minor than the inner injury, actual internal fungal colonization is difficult to know (Figure 1).
The scale showed good repeatability and high reproducibility among evaluations by different raters (Table 2). In other words, the scale is adequate to assess postharvest black rot caused by C. paradoxa in coconut fruits, since it improved the damaged area estimates by making them closer to the actual severity values, approaching and leveling the estimates of the best raters to the estimates of other less accurate raters, and standardizing the results of evaluations.
When the scale was used, the intercept values obtained by 16.6% raters significantly differed from zero (p = 0.05), tending towards severity underestimation. This indicated constant negative deviations in 58% of the disease severity levels (Table 2). Thus, accuracy in the evaluations performed without the scale may have been induced by the characteristic type of injury in the fruits and by the way images were presented (halved fruits and color contrast between healthy and necrotic area), leading the rater to provide severity estimates close to real values.
Using the scale, in the second and third evaluations, intercept values tended to be equal to zero (p = 0.05). Most deviations were negative, indicating a tendency towards severity underestimation. These results are similar to those found in diagrammatic scale validation studies involving other pathosystems, such as fruit and leaf diseases of papaya (1818 Santos, P.H.D.; Vivas, M.; Silveira, S.F.; Silva, J.M.; Terra, C.E.P.S. Elaboração e validação de escala diagramática para avaliação da severidade de oídio em folhas de mamoeiro. Summa Phytopathologica, Botucatu, v.37, p.215–217, 2011. DOI: 10.1590/S0100-54052011000400011
https://doi.org/10.1590/S0100-5405201100...
, 2424 Vivas, M.; Terra, C.E.P.S.; Silveira, S.F.; Fontes, R.V.; Pereira, M.G. Escala diagramática para avaliação da severidade da pinta-preta em frutos de mamoeiro. Summa Phytopathologica, Botucatu, v.36, p.161-163, 2010. DOI: 10.1590/S0100-54052010000200010
https://doi.org/10.1590/S0100-5405201000...
) and brown eye spot in red and yellow coffee cherries (1313 Maciel, M.P.; Paula, P.V.A.A.; Pozza, E.A. Diagrammatic scales for assessing brown eye spot (Cercospora coffeicola) in red and yellow coffee cherries. Journal of Phytopathology, Malden, v. 164, n.10, p.1–10, 2016. DOI: 10.1111/jph.12499
https://doi.org/10.1111/jph.12499...
).
Accuracy of visual severity estimates without the diagrammatic scale indicated average R2 values of 0.59, within the range from 0.20 to 0.79, and amplitude around 0.59. Using the scale, raters showed averages of 0.79, ranging from 0.73 to 0.83 (amplitude 0.10). In the third evaluation, R2 average was 0.82 and ranged from 0.75 to 0.86 with amplitude lower than 0.11.
Without using the scale, raters showed higher error deviations, above 10% (Figure 2). However, using the diagrammatic scale, the maximum error was 10%, most concentrated in the range of 5 - 8%. Thus, precision of the visual estimates increased with the aid of the scale. Such an increase indicates an approximation between raters showing the least accurate results and those showing more accurately results, considering that the proposed scale aims to establish a standard of quantitative evaluations for this pathosystem.
Accuracy increased when the scale was used to evaluate black rot in coconut fruits (Figure 2), which is similar to results reported for other diseases (44 Buffara, C.R.S.; Angelotti, F.; Vieira, R.A. Elaboration and validation of a diagrammatic scale to assess downy mildew severity in grapevine. Ciência Rural, Santa Maria, v.44, p.1384–1391, 2014., 2323 Vieira, R.A.; Mesquini, R.M.; Silva, C.N.; Hata, F.T.; Tessmann, D.J.; Scapim, C.A. A new diagrammatic scale for the assessment of northern corn leaf blight. Crop Protection, London, v.56, p.55–57, 2014. DOI: 10.1016/j.cropro.2011.04.018
https://doi.org/10.1016/j.cropro.2011.04...
, 2424 Vivas, M.; Terra, C.E.P.S.; Silveira, S.F.; Fontes, R.V.; Pereira, M.G. Escala diagramática para avaliação da severidade da pinta-preta em frutos de mamoeiro. Summa Phytopathologica, Botucatu, v.36, p.161-163, 2010. DOI: 10.1590/S0100-54052010000200010
https://doi.org/10.1590/S0100-5405201000...
).
In general, reproducibility was good for raters according to the linear regression data analysis for the third and second evaluations, both using the scale, R2 values were higher than 0.84 and the average was 0.91 (Table 2).
Severity estimated with the aid of the diagrammatic scale was more accurate and precise for most raters. Moreover, the scale provided good repeatability and high reproducibility between the evaluations in general, especially for raters who were not subjected to any type of training (evaluation with simultaneous display of real and estimated results), which could have further improved accuracy (Table 2).
All tested isolates led to tissue necrosis in coconut fruits, causing typical symptoms of the disease, like stalk base darkening, bract detachment, endosperm region disruption with liquid extravasation of albumen and internal tissue black rot (Figure 3).
The scale practical use after validation was efficient to distinguish aggressiveness between different inoculated C. paradoxa isolates, clearly indicating that the outer necrosis (Figure 3, upper images) does not match the internal damage (Figure 3, bottom pictures) for the corresponding fruit. Therefore, in this study the disease intensity is suggested to be estimated based on the internal severity through longitudinal fruit section.
The period between inoculation and evaluation was eight days for the disease development since, in this case, the fruit complete colonization was not necessary for not interfering with the distinction between isolates at fruit opening time.
There were significant differences between lesions according to ‘F” test (Figure 4), indicating some diversity in aggressiveness among isolates from different plant parts, host species and geographic origin.
CP 32 was the most aggressive isolate, and its damaged area was more than 60% greater than that of CP 03, less aggressive. This indicates variation between isolates of the same fungus and demonstrates the scale efficiency in distinguishing them. Two other intermediate groups were formed, CP 19 and CP 01; CP 04 and CP 07. Control treatment did not show symptoms (Figure 4).
The uniformity and speed in black rot severity evaluation using the diagrammatic scale was confirmed with fruits inoculated with different isolates. Moreover, a threshold for necrosis advance could be detected, i.e. up to 25.7% fungal colonization severity extends to the basal third of the mesocarp, a more fibrous region of the fruit. Disease intensity greater than this makes the solid albumen start to degrade, a symptomatic characteristic that is not possible to detect externally.
We conclude that the diagrammatic scale for black rot evaluation in coconut fruits is effective considering the disease severity assessment. Evaluation of the damaged area could distinguish between different C. paradoxa isolates as to aggressiveness in infected fruits, indicating that external symptoms are not correlated with the internal damage, varying from pathogen isolates from coconut to those from other inoculum sources.
REFERENCES
-
1Alves, M.L.B.; Lourd, M. Podridão negra de frutos de coco causada por Ceratocystis paradoxa em Manaus AM. Fitopatologia Brasileira, Manaus, v.10, p.233, 1985.
-
2Alvindia, D.G.; Natsuaki K.T. Evaluation of fungal epiphytes isolated from banana fruit surfaces for biocontrol of banana crown rot disease. Crop Protection, London, v.27, p.1200–1207, 2008. DOI: 10.1016/j.cropro.2008.02.007
» https://doi.org/10.1016/j.cropro.2008.02.007 -
3Brito, N.M.; Neves, C.M.L.; Ribeiro, V.V. Alternativas de controle de Chalara paradoxa na pós-colheita de abacaxi. Revista Caatinga, Mossoró, v.24, p.52–58, 2011.
-
4Buffara, C.R.S.; Angelotti, F.; Vieira, R.A. Elaboration and validation of a diagrammatic scale to assess downy mildew severity in grapevine. Ciência Rural, Santa Maria, v.44, p.1384–1391, 2014.
-
5Campbell, C.L.; Madden, L.V. Introduction to plant disease epidemiology New York: J. Wiley, 1990. 532p.
-
6Cardoso, R.M.G. Coqueiro com doenças diversas. O Biológico, São Paulo, v.30, p.239, 1964.
-
7Celoto, M.I.B.; Papa, M.E.S. Elaboração e validação de escala diagramática para quantificação da mancha alvo em folhas de acerola. Tropical Plant Pathology, Brasília, v.35, n., p.258-262, 2010. DOI: 10.1590/S1982-56762010000400010
» https://doi.org/10.1590/S1982-56762010000400010 -
8Ferreira, E.B.; Cavalcanti, P.P.; Nogueira, D.A. ExpDes: an R package for ANOVA and experimental designs. Applied Mathematics, London, v.5, p.2952–2958, 2014.
-
9Freire, M.G.M.; Souza, C.L.M.; Portal, T.P.; Machado, R.M.A.; Santos, P.H.D.; Dias, V.M. Effect of castor bean oil on post harvest fungal pathogen of coconut: Lasiodiplodia theobromae Journal of Plant Physiology & Pathology, Los Angeles, v.1, p.1-7, 2013. DOI: 10.4172/2329-955X.1000108
» https://doi.org/10.4172/2329-955X.1000108 -
10Garcia, A.; Souza, V.F. As doenças de pupunheira (Bactris gasipaes) na Amazônia e medidas de controle Porto-Velho: EMBRAPA-CPAF, 1998. v.4, 13p.
-
11Horsfall, J.G.; Cowling, E.B. Pathometry: the measurement of plant disease. In: Horsfall, J.G.; Cowling, E.B. (Ed.). Plant Disease: an advanced treatise how disease develops in populations. New York: Academic Press, 1978, cap.6, p.119-136.
-
12Lopes, P.G.N.; Locatelli, T.; Siqueira, J.A.M.; Dias, V.M. Detecção de Ceratocystis paradoxa em seiva de coqueiros. In: Congresso Brasileiro de Fitopatologia, 45., 2012, Manaus. Anais Manaus, 2012. p.288.
-
13Maciel, M.P.; Paula, P.V.A.A.; Pozza, E.A. Diagrammatic scales for assessing brown eye spot (Cercospora coffeicola) in red and yellow coffee cherries. Journal of Phytopathology, Malden, v. 164, n.10, p.1–10, 2016. DOI: 10.1111/jph.12499
» https://doi.org/10.1111/jph.12499 -
14Magalhães, D.M.A.; Luz, E.D.M.N.; Lopes, U.V.; Silva, S.D.V.M.; Damaceno V.O.; Niella, A.R.R. A new method for early detection of Ceratocystis spp. on various hosts. Agrotrópica, Ilhéus, v.27, p.209–214, 2015.
-
15Pinho, D.B.; Dutra, D.C.; Pereira, O.L. Notes on Ceratocystis paradoxa causing internal post-harvest rot disease on immature coconut in Brazil. Tropical Plant Pathology, Brasília, DF, v.38, p.152–157, 2013. DOI: 10.1590/S1982-56762013000200010
» https://doi.org/10.1590/S1982-56762013000200010 -
16R Development Core Team. .: a language and environment for statistical computing. Vienna: R Found. Stat. Comput., 2015.
-
17Rossetti, V. “Crostas pretas” das folhas e “podridão basal” dos frutos do coqueiro. O Biológico, São Paulo, v.21, p.54, 1955.
-
18Santos, P.H.D.; Vivas, M.; Silveira, S.F.; Silva, J.M.; Terra, C.E.P.S. Elaboração e validação de escala diagramática para avaliação da severidade de oídio em folhas de mamoeiro. Summa Phytopathologica, Botucatu, v.37, p.215–217, 2011. DOI: 10.1590/S0100-54052011000400011
» https://doi.org/10.1590/S0100-54052011000400011 -
19Suleman, P.; Al-Musallam, A.; Menezes, C.A. The effect of solute potential and water stress on black scorch caused by Chalara paradoxa and Chalara radicicola on date palms. Plant Disease, St. Paul v.85, p.80–83, 2001. DOI: 10.1094/PDIS.2001.85.1.80
» https://doi.org/10.1094/PDIS.2001.85.1.80 -
20Tzeng, S.J.; Sun, E.J. Fruit basal rot of coconut caused by Ceratocystis paradoxa Plant Pathology Bulletin, Taichung, v.18, p.67–74, 2009.
-
21Vale, F.X.R.; Fernandes Filho E.; Liberato J.R. Quant-Quantificação de doenças. Versão 1.0.1. Viçosa: Christchurch assessment, 2001.
-
22Viana, F.M.P.; Freire, F.C.O.; Barguil, B.M.; Alves, R.E.; Santos, A.A.; Cardoso, J.E.; Vidal, J.C. Post-harvest basal rot of coconut fruits in the State of Ceara, Brazil. Fitopatologia Brasileira, Brasília, DF, v.7, p.545, 2002.
-
23Vieira, R.A.; Mesquini, R.M.; Silva, C.N.; Hata, F.T.; Tessmann, D.J.; Scapim, C.A. A new diagrammatic scale for the assessment of northern corn leaf blight. Crop Protection, London, v.56, p.55–57, 2014. DOI: 10.1016/j.cropro.2011.04.018
» https://doi.org/10.1016/j.cropro.2011.04.018 -
24Vivas, M.; Terra, C.E.P.S.; Silveira, S.F.; Fontes, R.V.; Pereira, M.G. Escala diagramática para avaliação da severidade da pinta-preta em frutos de mamoeiro. Summa Phytopathologica, Botucatu, v.36, p.161-163, 2010. DOI: 10.1590/S0100-54052010000200010
» https://doi.org/10.1590/S0100-54052010000200010 -
25Warwick, D.R.N.; Ferreira, J.M.S.; Passos, E.E.M. Ocorrência de resinose do estipe do coqueiro em Sergipe provocada por Chalara paradoxa Fitopatologia Brasileira, Brasília, DF, v.29, p.171, 2004.
-
26Warwick, D.R.N.; Passos, E.E.M. Outbreak of stem bleeding in coconuts caused by Thielaviopsis paradoxa in Sergipe, Brazil. Tropical Plant Pathology, Brasília, DF, v.34, p.175–177, 2009. DOI: 10.1590/S1982-56762009000300007
» https://doi.org/10.1590/S1982-56762009000300007
Publication Dates
-
Publication in this collection
Oct-Dec 2017
History
-
Received
19 Oct 2016 -
Accepted
02 May 2017