ABSTRACT
Laser sensor applications associated with LiDAR (Light Detection and Ranging) technology on platforms allow the evaluation of crop and forest biomass in a non-invasive way. This study presents the development of a measurement system based on LiDAR technology aimed at the proposed assessment of the height of sugarcane plants during the pre-harvest period. A laser sensor, a GNSS (Global Navigation Satellite System) receiver, and an inertial unit compose the measurement system. The equipment was integrated with a computer for data acquisition and installed on an agricultural tractor platform. The GNSS receiver with a real-time kinematic signal was synchronized to the laser sensor to obtain the point cloud and to the inertial unit to evaluate the intensity of the vibration from platform oscillation. Data acquisition was carried about 10 days before sugarcane harvest. The developed steps of acquisition and data processing enabled the generation of point clouds with a density of about 2,000 points m−2 and the extraction of metrics related to the height of sugarcane plants. The influence of vibration in the dataset was more significant in one of the experimental fields due the high-amplitude spectral power observed.
KEYWORDS
canopy geometry; instrumentation; laser sensor; remote sensing
INTRODUCTION
Agricultural practices related to precision agriculture (PA) generally require a higher sampling range of variables and greater precision in the execution of tasks than are required by traditional agriculture. PA, as an agricultural production management system aimed at optimizing production through variability management and its associated factors, has demanded sensing and communication technologies to allow the improvement of its costs and operational efficiency (Molin et al., 2015Molin JP, Colaço AF, Amaral LR do (2015) Agricultura de precisão. Piracicaba, Oficina de Textos, 224 p.).
Brazil is the largest sugarcane producer and exporter of its derivative products. The current cultivated area of sugarcane in the country is 9.05 million hectares with an average yield estimated at 72.70 t ha−1 for the 2018/19 season. Sugar production is estimated at over 35.48 million tons, and ethanol production is estimated at 28.16 billion liters (CONAB, 2018CONAB - Companhia Nacional de Abastecimento (2018) Safra brasileira de cana-de-açúcar. CONAB. Available: https://www.conab.gov.br/info-agro/safras/cana. Accessed: Aug 17, 2018.
https://www.conab.gov.br/info-agro/safra...
). The Brazilian adoption of PA is still restricted to the employment of autonomous steering systems in sugarcane harvesters (Silva et al., 2011Silva CB, Moraes MAFD, Molin JP (2011) Adoption and use of precision agriculture technologies in the sugarcane industry of São Paulo state, Brazil. Precision Agriculture 12(1):67-81. DOI: https://doi.org/10.1007/s11119-009-9155-8.
https://doi.org/10.1007/s11119-009-9155-...
).
The dimension and complexity of the production of sugarcane requires the development and application of remote sensing technologies related to agricultural management, such as planting techniques, cultivation, and harvesting, which must be georeferenced and economically viable. Among the remote sensing techniques, active optical sensors involve a form of prediction of sugarcane biomass and nitrogen rates at variable rates during the development stage (Amaral & Molin, 2011Amaral LR do, Molin JP (2011) Sensor óptico no auxílio à recomendação de adubação nitrogenada em cana-de-açúcar. Pesquisa Agropecuária Brasileira 46(12):1633-1642. DOI: https://doi.org/10.1590/S0100-204X2011001200008
https://doi.org/10.1590/S0100-204X201100...
; Portz et al., 2012Portz G, Molin JP, Jasper J (2012) Active crop sensor to detect variability of nitrogen supply and biomass on sugarcane fields. Precision Agriculture 13(1):33-44. DOI: https://doi.org/10.1007/s11119-011-9243-4
https://doi.org/10.1007/s11119-011-9243-...
).
The applications of unmanned aerial vehicles (UAVs) with embedded digital cameras and GNSS (Global Navigation Satellite System) receivers have contributed to monitoring agricultural crops in real time (Diaz-Varela et al., 2015). Souza et al. (2017Souza CHW de, Lamparelli RAC, Rocha JV, Magalhães PSG (2017) Height estimation of sugarcane using an unmanned aerial system (UAS) based on structure from motion (SfM) point clouds. International Journal of Remote Sensing 38(8):2218-2230. DOI: https://doi.org/10.1080/01431161.2017.1285082
https://doi.org/10.1080/01431161.2017.12...
) used an UAV with an embedded digital camera to generate point clouds regarding sugarcane vegetation. However, their main limitation is the high cost associated with electronic devices of lower weight. Additionally, there is a higher signal saturation trend for such sensors in advanced production conditions of grassland crops (Povh et al., 2008Povh FP, Molin JP, Gimenez LM, Pauletti V, Molin R, Salvi JV (2008) Comportamento do NDVI obtido por sensor ótico ativo em cereais. Pesquisa Agropecuária Brasileira 43(8):1075-1083. DOI: https://doi.org/Z10.1590/S0100-204X2008000800018
https://doi.org/Z10.1590/S0100-204X20080...
).
Scanning devices have been investigated for measuring geometrical parameters, which are associated with variations in its potential yield, and biophysical processes affecting the development of the plants (Mulla, 2013Mulla DJ (2013) Twenty-five years of remote sensing in precision agriculture: key advances and remaining knowledge gaps. Biosystems Engineering 114(4):358-371. DOI: https://doi.org/10.1016/j.biosystemseng.2012.08.009
https://doi.org/10.1016/j.biosystemseng....
; Rosell & Sanz, 2012Rosell JR, Sanz R (2012) A review of methods and applications of the geometric characterization of tree crops in agricultural activities. Computers and Electronics in Agriculture 81:124-141. DOI: https://doi.org/10.1016/j.compag.2011.09.007
https://doi.org/10.1016/j.compag.2011.09...
). Currently, the electronic devices used for this purpose are ultrasonic, laser, and radar sensors. Portz et al. (2012Portz G, Molin JP, Jasper J (2012) Active crop sensor to detect variability of nitrogen supply and biomass on sugarcane fields. Precision Agriculture 13(1):33-44. DOI: https://doi.org/10.1007/s11119-011-9243-4
https://doi.org/10.1007/s11119-011-9243-...
) found that the height of sugarcane stems identified by ultrasonic sensors during their development stage is associated with the biomass content, but the operating performance of this type of sensor limits its use at large scale.
To overcome such challenges, some studies focused the use of scanning systems based on LiDAR (Light Detection and Ranging) technology for the characterization of perennial crops due its ability to detect spatial variability of the crop with high resolution and repeatability (Arnó et al., 2013Arnó J, Escolà A, Vallès JM, Llorens J, Sanz R, Masip J, Palacín J, Rosell-Polo JR (2013) Leaf area index estimation in vineyards using a ground-based LiDAR scanner. Precision Agriculture 14(3):290-306. DOI: https://doi.org/10.1007/s11119-012-9295-0
https://doi.org/10.1007/s11119-012-9295-...
). The first prototypes of the terrestrial platforms with this type of embedded technology are reported in Precision Horticulture to identify the spatial variability of orchard yield (Escolà et al., 2016Escolà A, Martínez-Casasnovas JA, Rufat J, Arnó J, Arbonés A, Sebé F, Pascual M, Gregorio E, Rosell-Polo, JR (2016) Mobile terrestrial laser scanner applications in precision fruticulture/horticulture and tools to extract information from canopy point clouds. Precision Agriculture 18(1):111-132. DOI: https://doi.org/10.1007/s11119-016-9474-5
https://doi.org/10.1007/s11119-016-9474-...
).
Laser sensors are embedded in terrestrial or aerial platforms to estimate crop and forest biomass (Andújar et al., 2016Andújar D, Escolà A, Rosell-Polo JR, Sanz R, Rueda-Ayala V, Fernández-Quintanilla C, Ribeiro A, Dorado J (2016) A LiDAR-based system to assess poplar biomass. Gesunde Pflanzen 68(3):155-162. DOI: https://doi.org/10.1007/s10343-016-0369-1
https://doi.org/10.1007/s10343-016-0369-...
; Li et al., 2014Li W, Niu Z, Gao S, Huang N, Chen H (2014) Correlating the horizontal and vertical distribution of lidar point clouds with components of biomass in a picea crassifolia forest. Forests 5(8):1910-1930. DOI: https://doi.org/10.3390/f5081910
https://doi.org/10.3390/f5081910...
; Silva et al., 2016Silva CA, Klauberg C, Hudak AT, Vierling LA, Liesenberg V, Carvalho SPCE, Rodriguez, LCE (2016) A principal component approach for predicting the stem volume in Eucalyptus plantations in Brazil using airborne LiDAR data. Forestry 89(4):422-433. DOI: https://doi.org/10.1093/forestry/cpw016
https://doi.org/10.1093/forestry/cpw016...
), to generate three-dimensional (3D) models in citriculture (Colaço et al., 2017Colaço AF, Trevisan RG, Molin JP, Rosell-Polo JR, Escolà A (2017) A method to obtain orange crop geometry information using a mobile terrestrial laser scanner and 3D dodeling. Remote Sensing 9(8) :1-21. DOI: https://doi.org/10.3390/rs9080763
https://doi.org/10.3390/rs9080763...
), to measure fluids derived from spraying (Gregorio et al., 2016Gregorio E, Torrent X, Martí SP, Solanelles F, Sanz R, Rocadenbosch F, Masip J, Ribes-Dasi M, Rosell-Polo JR (2016) Measurement of spray drift with a specifically designed LIDAR system. Sensors 16(4):499. DOI:https://doi.org/10.3390/s16040499
https://doi.org/10.3390/s16040499...
), and to detect obstacles using autonomous vehicles (Bayar et al., 2016Bayar G, Bergerman M, Konukseven EI, Koku AB (2016) Improving the trajectory tracking performance of autonomous orchard vehicles using wheel slip compensation. Biosystems Engineering 146:149-164. DOI: https://doi.org/10.1016/j.biosystemseng.2015.12.019
https://doi.org/10.1016/j.biosystemseng....
), among others. This device emits pulses in the form of light beams to determine the distance between the sensor and the target object. The main result provided by LiDAR is the point cloud, which, after processing, allows the construction of a 3D model of the target object. The measurement systems based on laser sensors infer the geometric characteristics of the plants with sufficient accuracy to guide several agronomic practices (Mendez et al., 2012Mendez V, Catalán H, Rossel JR, Arnó J, Sanz R, Tarquis A (2012) SIMLIDAR - Simulation of LIDAR performance in artificially simulated orchards. Biosystems Engineering 111(1):72-82. DOI: https://doi.org/10.1016/j.biosystemseng.2011.10.010
https://doi.org/10.1016/j.biosystemseng....
).
The objective of this study was to develop a measurement system to acquire and process LiDAR data in order to obtain heights of sugarcane plants in a canopy in the pre-harvest period. The paper elucidates the components used to elaborate the measurement system based on LiDAR and its processes to acquire and process field data.
MATERIAL AND METHODS
Measurement system
The measurement system consists of a laser sensor, GNSS receivers, and an inertial unit to georeference the canopy data from sugarcane plants and to quantify the influence of the vibration on the performance of LiDAR under field conditions. A laser sensor, SICK© model LMS200, with two-dimensional (2D) scanning was used, with no need of direct contact with the target object. A single-pulse beam (905 nm) was emitted in the 2D plane with a scanning angle set to 180.0° (181 measuring angles), angular resolution of 1.0°, scanning range of 8.0 m, and frequency of 75 Hz. The return time of the light beam (time of flight) to the device determines the distance between the target object and the sensor instantly.
A pair of GNSS receivers, TOPCON© model GR3, were used with real-time kinematic differential correction and L1/L2 signals, with an accuracy of 0.01 m, set to a frequency of 10 Hz in combination with other sensors for georeferencing measurements (Feng & Wang, 2008Feng Y, Wang J (2008) GPS RTK performance characteristics and analysis. Journal of Global Positioning Systems 7(1):1-8.). The synchronization established between the GNSS receiver and the laser sensor allowed the registration of the position for each point reached by the emitted light beam (Del-Moral-Martinez et al., 2015Del-Moral-Martinez I, Arnó J, Escolà A, Sanz R, Masip-Vilalta J, Company-Messa J, Rosell-Polo JR (2015) Georeferenced scanning system to estimate the leaf wall area in tree crops. Sensors 15(4):8382-8405. DOI:https://doi.org/10.3390/s150408382
https://doi.org/10.3390/s150408382...
).
A static orientation sensor, SBG Systems© model IG-500N, was aligned with the laser sensor and the GNSS receiver to quantify the influence of mechanical vibration and oscillation in the dataset under field conditions. The data collection rate was set to 66 Hz, and the raw data corresponded to Euler angles with a resolution of 0.05°.
Data acquisition and processing
The equipment was installed at 5.0 m above the ground on a metallic support structure mounted on an agricultural tractor traveling at a constant speed of 1.0 m s−1. To ensure the stability of the equipment during the data acquisition, a structure was rigidly coupled to the side of the tractor. Figure 1 illustrates the mounting of the sensors on the tractor coupled to the metal structure.
Figure 2 illustrates the assignment configuration of the measurement system, where the x and y axes represent, respectively, the direction of movement of the agricultural tractor and the direction of scanning by the laser sensor. The coordinate z is calculated from the measured angle (α) indicated by the measurement system and the distance from the sensor to the ground (H). From these settings, multiple readings of the canopy plants are recorded while the tractor is moving, so each reading represents a longitudinal section of the canopy plants in the travel direction.
Measurement system configuration. Adapted from Selbeck et al. (2010Selbeck J, Dworak V, Ehlert D (2010) Testing a vehicle-based scanning LiDAR sensor for crop detection. Canadian Journal Remote Sensing 36(1):24-35. DOI: https://doi.org/10.5589/m10-022
https://doi.org/10.5589/m10-022... )
The distance values provided by the laser sensor are in the form of polar coordinates, which are converted into cartesian coordinates (XYZ) by the equations:
Where,
ij is the position of the points hit by the laser beam;
X is the Cartesian coordinate on the x axis of the point ij (m);
dij is the distance between the laser sensor and the target (m);
αij is the measurement angle from the laser sensor (°);
Y is the cartesian coordinate on the y axis of the point ij (m);
yij is the direction of scanning by the laser sensor;
Z is the cartesian coordinate on the z axis of the point ij (m), and
H is the height of the laser sensor in relation to the ground (m).
The data acquisition of the laser sensor was synchronized with the GNSS receiver through a connection to a toughbook PANASONIC© model CF-19. For transferring laser sensor data to the computer, a RS-422 communication protocol with a baud rate set to 500 kbps was used. The data transfer from the GNSS receiver used the protocol NEMA 0183 at a baud rate of 115200 (RS-232). The logic program of data acquisition was developed in Java language in Processing 2.2.1 software (Fry & Reas, 2014Fry B, Reas C (2014) Processing Library for Visual Arts and Design. Available: https://processing.org/handbook/. Acessed: Aug 17, 2018.
https://processing.org/handbook/...
), where it is necessary to indicate the serial communication port (COM) in which the devices are connected, and the data transmission rate set for each device.
The LiDAR data obtained by the measurement system were stored in text format containing the georeference (latitude, longitude and elevation) and the distance between the laser sensor and the canopy plants at each measurement angle. The post-processing of the dataset was developed in RStudio 1.0.136 software (R Core Team, 2015R Core Team (2015) The R project for statistical computing. Available: https://www.r-project.org/. Accessed: Aug 17, 2018.
https://www.r-project.org/...
), indicating the height of the laser sensor (H) in relation to the ground. Figure 3 shows the flowchart related to the processing of laser sensor and GNSS receiver data.
Due to the different frequencies of the equipment during data acquisition, the dataset from the measurement system was interpolated by the inverse distance squared method, as proposed in the literature for LiDAR applications (Anderson et al., 2005Anderson ES, Thompson JA, Austin RE (2005) LIDAR density and linear interpolator effects on elevation estimates. International Journal of Remote Sensing 26(18):3889-3900. DOI: https://doi.org/10.1080/01431160500181671
https://doi.org/10.1080/0143116050018167...
). The result of data processing is a single file in text format indicating the distance to the target (vegetation height) and its geographic coordinates. From this file, it is possible to generate a point cloud, where each point hit by the light beam has its coordinates allocated in the same reference coordinate system: Universal Transverse Mercator (UTM). The point cloud was analyzed by CloudCompare 2.8 software to identify the sugarcane crop and ground level, and manual data filtering was required after processing due to the differing points on the boundaries and the overlapping data in experimental fields. From the point cloud, the average vegetation height () was calculated in the post-processing step according to the equation:
Where,
is the average vegetation height (m);
zi is the cartesian coordinate on the z axis at the point i (m), and
n is the number of points obtained from the post-processing step.
The coefficient of variation (CV) was calculated to verify the spatial variability of the heights indicated by the laser sensor according to the equation:
Where,
CV is the coefficient of variation (%);
σ is the standard deviation (m), and
is the average vegetation height (m).
Influence of the platform vibration for the LiDAR dataset
The static orientation sensor was connected via USB protocol to the laptop with the software sbgCenter installed for the data acquisition. The selected displacements were the transversal (roll), lateral (pitch), and longitudinal (yaw). The acceleration on the z axis was set to 115200 bps.
The data generated by the static orientation sensor were processed by a programming routine developed in Matlab 9.1 software using vertical acceleration components such as the sum of the raw data () and the gravitational acceleration (9.8 m s−2). In order to quantify the influence of the acceleration in the vertical component in the measurement system, the spectral power density was calculated on the basis of the Discrete Fourier Transform according to the equation:
Where,
Sa is the spectral power density (dB);
fi is the ith discrete frequency spectrum (Hz);
Fs is the frequency at which the signal is sampled (Hz);
N is the number of sampling points in a time interval, and
is the ith vertical acceleration component (m s−2).
The acceleration amplitudes in the vertical component (Az) were analyzed in the time domain through the root mean square (RMS) calculation according to the equation:
Where,
AzRMS is the RMS value referring to the vertical acceleration component (m s−2), and
is the ith acceleration in the vertical direction (m s−2).
Experimental fields of sugarcane
Tests of the measurement system were conducted in two experimental fields of sugarcane composed of plots separated by rows. The rows allowed the tractor traffic with sensors coupled to the structure to move between the plots. In the first year of study, one of the fields (field I — 0.76 ha) was used to carry out the step of methodology development. In the second year, two experimental fields (field II — 0.56 ha) were used for data acquisition about 10 days before the sugarcane harvest in order to evaluate the proposed method.
RESULTS AND DISCUSSION
Point cloud generation
The first results (Figure 4) refer to the methodology development step to generate the point cloud after the filtering of the measurement system data in experimental field I. The corresponding histogram (Figure 4b) allows to verify the distribution of the vegetation height and its frequency, relative to the ground level in the dataset. Each point allocated to the point cloud refers to a point hit by the light laser beam emitted by the sensor in the conditions of the sugarcane canopy plants with the geographic coordinates allocated in the UTM reference system.
The total number of post-processed points allocated to the point cloud was 27 million for the first stage of this study using field I, representing a density of 3,515 points m−2 This shows the capacity achieved by the laser sensor settings proposed in this study. About 16.30% of the total points impacted by the laser sensor refer to the soil for the experimental conditions identified in this field.
For the second stage of study, Table 1 shows the descriptive statistics of post-processed data related to the two experimental fields of sugarcane. The post-processed data were obtained by filtering the raw data to eliminate the outliers and the overlap caused by the dimensions of the plots.
It should be noted that the minimum heights of the point clouds fitted to fields I and II are 0.16 and 0.24 m, respectively, where the minimum height refers to the distance between the GNSS receiver and the laser sensor coupled to the support, so the minimum distance (ground level) in the point cloud does not correspond to 0 m. One of the characteristics of the laser sensors is the high data acquisition capability: as shown in results, the density of allocated points is about 2,000 points m−2. In continuous and extensive fields, this approach should be reviewed using raster surface layers and pixels of a minimum size.
The descriptive statistics of post-processed data from the measurement system indicate a CV of 25.0 to 45.0%. In this case, the high CV value refers to the number of points hit and recorded by the laser sensor, regardless of whether the target object matches the soil or the plants. It was observed that during the pre-harvest period, the leaves and cane tops interfere with the identification of the stems by the measurement system. Thus, it is understood that the approach should include the estimation of the height and stem density, so it might also be possible to estimate the sugarcane yield. The future analysis procedure must evaluate the correlation between the canopy vegetation tops and the sugarcane yield effectively.
The top of the plants detected by the laser sensor, characterized by leaves with vertical arrangement, is the highest layer of the point cloud, visualized as an irregular surface. The aim is to find the relationship between this surface and the stalk height and then relate it to the yield. The vigor and shape of the leaves on the top of the plant are dependent on some factors, such as genetic variety, the time of the year associated with water stress, and others, which can characterize a source of error in the expected model. This result corroborates the investigations by Dworak et al. (2011Dworak V, Selbeck J, Ehlert D (2011) Ranging sensors for vehicle-based measurement of crop stand and orchard parameters: a review. Transactions of the ASABE 54(4):1497-1510. DOI: https://doi.org/10.13031/2013.39013
https://doi.org/10.13031/2013.39013...
) and Sanz-Cortiella et al. (2011Sanz-Cortiella R, Llorens-Calveras J, Rosell-Polo JR, Gregorio-Lopez E, Palacin-Roca J (2011) Characterisation of the LMS200 laser beam under the influence of blockage surfaces: Influence on 3D scanning of tree orchards. Sensors 11(3):2751-2772. DOI: https://doi.org/10.3390/s110302751
https://doi.org/10.3390/s110302751...
), indicating that the laser sensor performance is associated with the format of the target object, such as its regularity, and the geometry of the light beam emitted by the laser sensor.
Figure 5 illustrates the point cloud related to the experimental field I during the second stage of the study, where a more dispersed behavior of the plant size was found in relation to the conditions of the field in the previous year (Figure 4). The plant gaps allocated at the top right of Figure 5a are due to the plant falling over.
Few points (7.91%) of the light beam hit the ground (z < 0.50 m), with most of the data in the distribution showing a vegetation height ranging from 2.80 to 3.50 m. Under these conditions, the top points, identified as the maximum height of vegetation, should provide some information related to the estimation of sugarcane yield. The point cloud generated from the dataset related to the experimental field II is shown in Figure 6, showing the detection of the lack of plants and plants falling over as interference in the performance of the laser sensor.
In both periods of assessments in the field, the distribution of sugarcane plants near each other, as well as the overlap of typical leaves in the pre-harvest conditions, made it difficult to detect the size of the sugarcane plants. The detection of the soil represented 10.84% of sampled points, and therefore there was a low density of sample points that allowed the elaboration, for example, of digital terrain models and, from this approach, the best estimation of plant height, such as an inference to obtain the height of the sugarcane stalks from just one layer of data.
Lodged plants in the experimental fields disturbed the vegetation structure and therefore the capacity of the laser sensor to identify the distribution of plants. However, such condition should be considered for commercial production fields in the yield estimation. Such information is also useful for the harvesting manager, which can result in operational limitations for mechanized harvesting systems.
During the data acquisition in the field, it was observed that the continuous incidence of sunlight on the laser sensor stops its data collection by serial communication. Ehlert et al. (2006Ehlert D, Horn HJ, Adamek R (2006) Potential of laser distance sensors for measuring crop parameters. Journal of Applied Sciences 6(4):898-904. DOI: https://doi.org/10.3923/jas.2006.898.904
https://doi.org/10.3923/jas.2006.898.904...
) reported the same effect when using laser sensors in a controlled environment and in field conditions. A possible solution to this problem would be to use the sensor during periods of lower light intensity or to provide a protective structure for the sensor to reflect the sunlight away.
Quantification of the influence of vibration in the dataset
The descriptive statistics for the data obtained from the static orientation sensor for fields I and II are shown in Table 2.
The oscillation measurements (roll, pitch, and yaw) showed a higher standard deviation (up to 59.71°) due to the sensitivity of the sensor, which allowed it to acquire data above and below the reference axis (0°). The acceleration in the z axis showed 3.99 and 4.84 m s−2 values for fields I and II, respectively, values which are considered common in the literature (David et al., 2016David SA, Sousa RV de, Valentim CA, Tabile RA, Machado JAT (2016) Fractional PID controller in an active image stabilization system for mitigating vibration effects in agricultural tractors. Computers and Electronics in Agriculture 131:1-9. DOI:https://doi.org/10.1016/j.compag.2016.11.001
https://doi.org/10.1016/j.compag.2016.11...
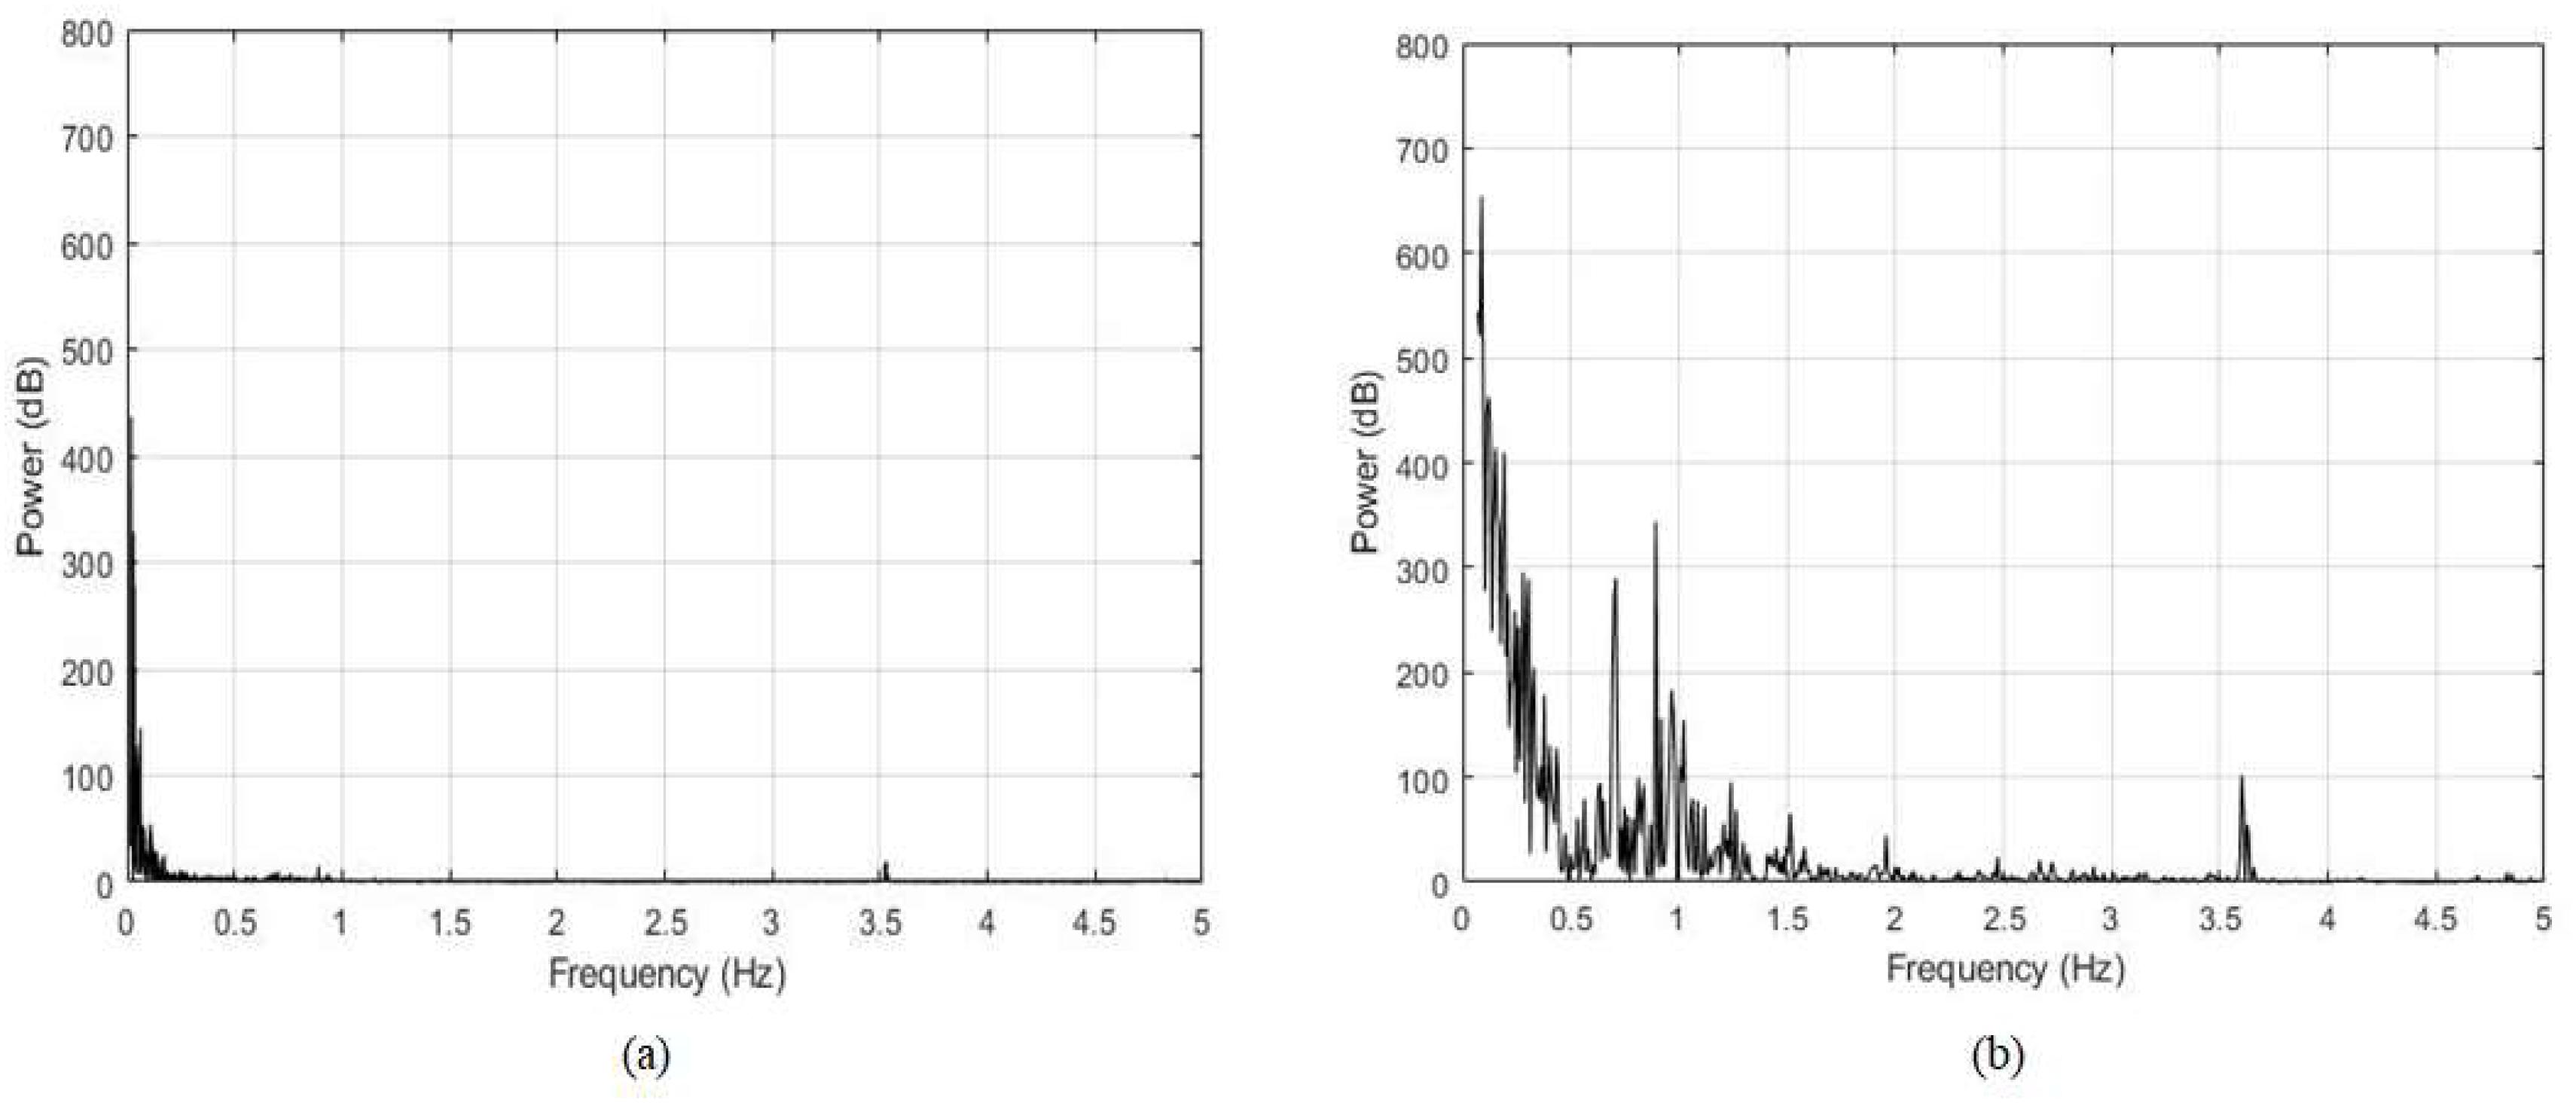
). The spectral power density showed a greater RMS in field I (225.24 dB). Figure 7 illustrates the power spectral density calculated in accordance with the acceleration component in the vertical axes () and its signal sampling frequencies obtained in fields I and II.
The spectral power density is divided into two analyses. The first involves the frequencies lower than 1.0 Hz with average amplitudes of 174.58 dB (field I) and 144.61 dB (field II) caused by the transfer of mechanical vibration to the measurement system. The second corresponds to frequencies of around 4.0 Hz, which are associated with the engine vibration of the tractor used in this study (Cunha et al., 2009Cunha JPAR da, Duarte MAV, Rodrigues JC (2009) Avaliação dos níveis de vibração e ruído emitidos por um trator agrícola em preparo de solo. Pesquisa Agropecuária Tropical 39(4):348-355.). There is a peak power amplitude of around 4.0 Hz in both cases, indicating the effect of the engine vibration on the sensor support structure. The high-amplitude power observed in field I (142.80 dB) suggests a need to implement stabilization filters that can be applied to the data during the postprocessing step (David et al., 2016David SA, Sousa RV de, Valentim CA, Tabile RA, Machado JAT (2016) Fractional PID controller in an active image stabilization system for mitigating vibration effects in agricultural tractors. Computers and Electronics in Agriculture 131:1-9. DOI:https://doi.org/10.1016/j.compag.2016.11.001
https://doi.org/10.1016/j.compag.2016.11...
). As it is unlikely that vehicle traffic would be used in sugarcane fields in preharvest conditions, LiDAR technology must be viable on other platforms, so that the analysis can be applied to new scenarios.
CONCLUSIONS
The proposed measurement system showed capability for the detection of sugarcane plants in the preharvest period, unlike other optical remote sensing techniques, which suffer from signal saturation. The procedures developed for acquisition and processing of LiDAR data using a terrestrial platform enabled the detection of the distribution of sugarcane plants. Depending on some field conditions, a stabilization filter should be installed in order to improve data collection. Furthermore, it is necessary to develop procedures that will enable the estimation of stalk height from the vegetation height.
ACKNOWLEDGEMENTS
We are grateful to CAPES (Coordination for the Improvement of Higher Education Personnel) for the scholarship, this study was financed in part by the Coordenação de Aperfeiçoamento de Pessoal de Nível Superior - Brasil (CAPES) - Finance Code 001, and to APTA (Agency Paulista Agribusiness Technology) for experimental fields.
REFERENCES
- Amaral LR do, Molin JP (2011) Sensor óptico no auxílio à recomendação de adubação nitrogenada em cana-de-açúcar. Pesquisa Agropecuária Brasileira 46(12):1633-1642. DOI: https://doi.org/10.1590/S0100-204X2011001200008
» https://doi.org/10.1590/S0100-204X2011001200008 - Anderson ES, Thompson JA, Austin RE (2005) LIDAR density and linear interpolator effects on elevation estimates. International Journal of Remote Sensing 26(18):3889-3900. DOI: https://doi.org/10.1080/01431160500181671
» https://doi.org/10.1080/01431160500181671 - Andújar D, Escolà A, Rosell-Polo JR, Sanz R, Rueda-Ayala V, Fernández-Quintanilla C, Ribeiro A, Dorado J (2016) A LiDAR-based system to assess poplar biomass. Gesunde Pflanzen 68(3):155-162. DOI: https://doi.org/10.1007/s10343-016-0369-1
» https://doi.org/10.1007/s10343-016-0369-1 - Arnó J, Escolà A, Vallès JM, Llorens J, Sanz R, Masip J, Palacín J, Rosell-Polo JR (2013) Leaf area index estimation in vineyards using a ground-based LiDAR scanner. Precision Agriculture 14(3):290-306. DOI: https://doi.org/10.1007/s11119-012-9295-0
» https://doi.org/10.1007/s11119-012-9295-0 - Bayar G, Bergerman M, Konukseven EI, Koku AB (2016) Improving the trajectory tracking performance of autonomous orchard vehicles using wheel slip compensation. Biosystems Engineering 146:149-164. DOI: https://doi.org/10.1016/j.biosystemseng.2015.12.019
» https://doi.org/10.1016/j.biosystemseng.2015.12.019 - CONAB - Companhia Nacional de Abastecimento (2018) Safra brasileira de cana-de-açúcar. CONAB. Available: https://www.conab.gov.br/info-agro/safras/cana Accessed: Aug 17, 2018.
» https://www.conab.gov.br/info-agro/safras/cana - Colaço AF, Trevisan RG, Molin JP, Rosell-Polo JR, Escolà A (2017) A method to obtain orange crop geometry information using a mobile terrestrial laser scanner and 3D dodeling. Remote Sensing 9(8) :1-21. DOI: https://doi.org/10.3390/rs9080763
» https://doi.org/10.3390/rs9080763 - Cunha JPAR da, Duarte MAV, Rodrigues JC (2009) Avaliação dos níveis de vibração e ruído emitidos por um trator agrícola em preparo de solo. Pesquisa Agropecuária Tropical 39(4):348-355.
- David SA, Sousa RV de, Valentim CA, Tabile RA, Machado JAT (2016) Fractional PID controller in an active image stabilization system for mitigating vibration effects in agricultural tractors. Computers and Electronics in Agriculture 131:1-9. DOI:https://doi.org/10.1016/j.compag.2016.11.001
» https://doi.org/10.1016/j.compag.2016.11.001 - Del-Moral-Martinez I, Arnó J, Escolà A, Sanz R, Masip-Vilalta J, Company-Messa J, Rosell-Polo JR (2015) Georeferenced scanning system to estimate the leaf wall area in tree crops. Sensors 15(4):8382-8405. DOI:https://doi.org/10.3390/s150408382
» https://doi.org/10.3390/s150408382 - Díaz-Varela RA, Rosa R de la, León L, Zarco-Tejada PJ (2015) High-Resolution Airborne UAV Imagery to assess olive tree crown parameters using 3D photo reconstruction: Application in breeding trials. Remote Sensing 7(4):4213-4232. DOI: https://doi.org/10.3390/rs70404213
» https://doi.org/10.3390/rs70404213 - Dworak V, Selbeck J, Ehlert D (2011) Ranging sensors for vehicle-based measurement of crop stand and orchard parameters: a review. Transactions of the ASABE 54(4):1497-1510. DOI: https://doi.org/10.13031/2013.39013
» https://doi.org/10.13031/2013.39013 - Ehlert D, Horn HJ, Adamek R (2006) Potential of laser distance sensors for measuring crop parameters. Journal of Applied Sciences 6(4):898-904. DOI: https://doi.org/10.3923/jas.2006.898.904
» https://doi.org/10.3923/jas.2006.898.904 - Escolà A, Martínez-Casasnovas JA, Rufat J, Arnó J, Arbonés A, Sebé F, Pascual M, Gregorio E, Rosell-Polo, JR (2016) Mobile terrestrial laser scanner applications in precision fruticulture/horticulture and tools to extract information from canopy point clouds. Precision Agriculture 18(1):111-132. DOI: https://doi.org/10.1007/s11119-016-9474-5
» https://doi.org/10.1007/s11119-016-9474-5 - Feng Y, Wang J (2008) GPS RTK performance characteristics and analysis. Journal of Global Positioning Systems 7(1):1-8.
- Fry B, Reas C (2014) Processing Library for Visual Arts and Design. Available: https://processing.org/handbook/ Acessed: Aug 17, 2018.
» https://processing.org/handbook/ - Gregorio E, Torrent X, Martí SP, Solanelles F, Sanz R, Rocadenbosch F, Masip J, Ribes-Dasi M, Rosell-Polo JR (2016) Measurement of spray drift with a specifically designed LIDAR system. Sensors 16(4):499. DOI:https://doi.org/10.3390/s16040499
» https://doi.org/10.3390/s16040499 - Li W, Niu Z, Gao S, Huang N, Chen H (2014) Correlating the horizontal and vertical distribution of lidar point clouds with components of biomass in a picea crassifolia forest. Forests 5(8):1910-1930. DOI: https://doi.org/10.3390/f5081910
» https://doi.org/10.3390/f5081910 - Mendez V, Catalán H, Rossel JR, Arnó J, Sanz R, Tarquis A (2012) SIMLIDAR - Simulation of LIDAR performance in artificially simulated orchards. Biosystems Engineering 111(1):72-82. DOI: https://doi.org/10.1016/j.biosystemseng.2011.10.010
» https://doi.org/10.1016/j.biosystemseng.2011.10.010 - Molin JP, Colaço AF, Amaral LR do (2015) Agricultura de precisão. Piracicaba, Oficina de Textos, 224 p.
- Mulla DJ (2013) Twenty-five years of remote sensing in precision agriculture: key advances and remaining knowledge gaps. Biosystems Engineering 114(4):358-371. DOI: https://doi.org/10.1016/j.biosystemseng.2012.08.009
» https://doi.org/10.1016/j.biosystemseng.2012.08.009 - Portz G, Molin JP, Jasper J (2012) Active crop sensor to detect variability of nitrogen supply and biomass on sugarcane fields. Precision Agriculture 13(1):33-44. DOI: https://doi.org/10.1007/s11119-011-9243-4
» https://doi.org/10.1007/s11119-011-9243-4 - Povh FP, Molin JP, Gimenez LM, Pauletti V, Molin R, Salvi JV (2008) Comportamento do NDVI obtido por sensor ótico ativo em cereais. Pesquisa Agropecuária Brasileira 43(8):1075-1083. DOI: https://doi.org/Z10.1590/S0100-204X2008000800018
» https://doi.org/Z10.1590/S0100-204X2008000800018 - R Core Team (2015) The R project for statistical computing. Available: https://www.r-project.org/ Accessed: Aug 17, 2018.
» https://www.r-project.org/ - Rosell JR, Sanz R (2012) A review of methods and applications of the geometric characterization of tree crops in agricultural activities. Computers and Electronics in Agriculture 81:124-141. DOI: https://doi.org/10.1016/j.compag.2011.09.007
» https://doi.org/10.1016/j.compag.2011.09.007 - Sanz-Cortiella R, Llorens-Calveras J, Rosell-Polo JR, Gregorio-Lopez E, Palacin-Roca J (2011) Characterisation of the LMS200 laser beam under the influence of blockage surfaces: Influence on 3D scanning of tree orchards. Sensors 11(3):2751-2772. DOI: https://doi.org/10.3390/s110302751
» https://doi.org/10.3390/s110302751 - Selbeck J, Dworak V, Ehlert D (2010) Testing a vehicle-based scanning LiDAR sensor for crop detection. Canadian Journal Remote Sensing 36(1):24-35. DOI: https://doi.org/10.5589/m10-022
» https://doi.org/10.5589/m10-022 - Silva CB, Moraes MAFD, Molin JP (2011) Adoption and use of precision agriculture technologies in the sugarcane industry of São Paulo state, Brazil. Precision Agriculture 12(1):67-81. DOI: https://doi.org/10.1007/s11119-009-9155-8
» https://doi.org/10.1007/s11119-009-9155-8 - Silva CA, Klauberg C, Hudak AT, Vierling LA, Liesenberg V, Carvalho SPCE, Rodriguez, LCE (2016) A principal component approach for predicting the stem volume in Eucalyptus plantations in Brazil using airborne LiDAR data. Forestry 89(4):422-433. DOI: https://doi.org/10.1093/forestry/cpw016
» https://doi.org/10.1093/forestry/cpw016 - Souza CHW de, Lamparelli RAC, Rocha JV, Magalhães PSG (2017) Height estimation of sugarcane using an unmanned aerial system (UAS) based on structure from motion (SfM) point clouds. International Journal of Remote Sensing 38(8):2218-2230. DOI: https://doi.org/10.1080/01431161.2017.1285082
» https://doi.org/10.1080/01431161.2017.1285082
Publication Dates
-
Publication in this collection
25 Apr 2019 -
Date of issue
Mar-Apr 2019
History
-
Received
09 Feb 2018 -
Accepted
13 Feb 2019