ABSTRACT:
Rabies affects several domestic species, causing significant economic losses due to the death of animals in characteristic areas of the southern region of Rio Grande do Sul. In this context, this work aimed to study the epidemiology of rabies outbreaks observed in cattle from January 2008 to December 2017, through its space and time distribution in the southern region of Rio Grande do Sul. We performed an observational and ecological retrospective through the analysis of data recorded in necropsy protocols performed in cattle at the “Laboratório Regional de Diagnóstico” of the “Universidade Federal de Pelotas” (LRD-UFPel). A descriptive data analysis aimed at evaluating the distribution of cases over time. The statistical analysis was performed with Gretl statistical software 1.9.12 (GNU Regression, Econometric, and Time-series Library). To the existence of stationarity was verified with the Dickey-Fuller test, considering a value of p<0.05. From January 2008 to December 2017, 1418 bovine diagnostic materials were received at the LRD-UFPel, and 160 outbreaks of rabies were confirmed in 160 farms located in the 24 municipalities of the LRD-UFPel area of influence. We observed 591 cattle out of a total of 25,886 infected with the virus. We conclude that rabies does not exhibit seasonality in the study region, with a tendency to decrease in frequency in the next years. The disease has an epidemic characteristic in most of the analyzed months (2012-2014), remaining endemic in the remaining period (2011, 2015 and 2016) with sporadic episodes of epidemics in these years. We also observed that as the incidence of the disease increased in the animals and in the properties, there was a geographical spread of the virus for the majority (54.16%) of the municipalities in the area of influence of the LRD-UFPel.
INDEX TERMS:
Epidemiology; rabies; cattle; southern Brazil; descriptive analysis; mortality; epidemics
RESUMO:
A raiva afeta várias espécies domésticas, causando perdas econômicas significativas pela morte de animais em áreas bem características da região Sul do Rio Grande do Sul. Neste contexto, o objetivo deste trabalho foi estudar a epidemiologia dos surtos de raiva observados em bovinos de janeiro de 2008 a dezembro de 2017, por meio de sua distribuição no espaço e no tempo na região sul do Rio Grande do Sul. Foi realizado um estudo observacional e ecológico retrospectivo, por meio da análise de dados registrados nos protocolos de necropsias realizadas em bovinos no Laboratório Regional de Diagnóstico da Universidade Federal de Pelotas (LRD-UFPel). Foi feita análise descritiva dos dados para avaliar a distribuição dos casos ao longo do tempo. Para a análise temporal foi utilizado o software estatístico Gretl 1.9.12 (GNU Regression, Econometricand Time-series Library). Para verificar a existência da estacionariedade utilizou-se o teste de Dickey-Fuller aumentado, considerando um valor de p<0,05. No período de janeiro de 2008 a dezembro de 2017, foram recebidos no LRD-UFPel 1418 materiais de bovinos para diagnóstico, sendo confirmados 160 surtos de raiva em 160 propriedades situadas nos 24 municípios da área de influência do LRD-UFPel. O número de animais infectados pelo vírus foi de 591 bovinos de um total de 25.886. O presente estudo permitiu concluir que a raiva não tem sazonalidade na região do estudo, tendo tendência de queda na frequência nos próximos anos. A doença tem característica epidêmica na maioria dos meses analisados (2012-2014), mantendo-se endêmica no período restante (2011, 2015 e 2016) com episódios esporádicos de epidemias nestes anos. Observou-se ainda, que na medida em que aumentou a incidência da doença nos animais e nas propriedades, houve disseminação geográfica do vírus para a maioria (54,16%) dos municípios da área de influência do LRD-UFPel.
TERMOS DE INDEXAÇÃO:
Epidemiologia; raiva; bovinos; Sul do Brasil; análise descritiva; séries temporais; mortalidade; epidemia
Introduction
Rabies is a neurological condition caused by a virus of the genus Lyssavirus. Affecting humans and almost all domestic and wild mammals that act as reservoirs of the disease, including the hematophagous bat Desmodus rotundus, the main transmitter of the disease to cattle, its evolution is invariably fatal. The disease is endemic in many parts of the world and a significant zoonosis with global mortality estimated around 40,000-100,000 humans per year (Fernandes & Riet-Correa 2007Fernandes C.G. & Riet-Correa F. 2007. Raiva, p.184-198. In: Riet-Correa F., Schild A.L., Lemos R.A.A. & Borges J.R.J. (Eds), Doenças de Ruminantes e Eqüídeos. Vol.1. Pallotti, Santa Maria.).
In South America, rabies in herbivorous populations appear in cyclical outbreaks, occurring approximately every seven years (Hudson et al. 1996Hudson L.C., Weinstock D., Jordan T. & Bold-Fletcher N.O. 1996. Clinical features of experimentally induced rabies in cattle and sheep. J. Vet. Med. B 43(2):85-95. <http://dx.doi.org/10.1111/j.1439-0450.1996.tb00292.x> <PMid:8693846>
https://doi.org/10.1111/j.1439-0450.1996...
). The enzootic stability of rabies in the state of Rio Grande do Sul is due to favorable climatic conditions, the presence of natural and artificial shelter for the bat, which allows the rabies virus to subsist in nature, and the distribution of bovine populations throughout the entire territory. Although canine rabies has been successfully controlled in the state, the bovine condition is still endemic in some regions. The National Program for Rabies Control in Herbivores (Programa Nacional de Controle da Raiva dos Herbívoros - PNCRH) was created in Brazil with the aim of reducing the disease prevalence in the domestic herbivore population (Brasil 2017Brasil. Ministério da Agricultura, Pecuária e Abastecimento 2017. Controle da Raiva dos Herbívoros e Encefalopatia Espongiforme Bovina (EEB). Available at <Available at http://www.agricultura.gov.br/assuntos/sanidade-animal-e-vegetal/saude-animal/programas-de-saude-animal/prog-nacional-de-controle-da-raiva-dos-herbivoros-e-outras-encefalopatias
> Accessed on Jun. 24, 2018.
http://www.agricultura.gov.br/assuntos/s...
).
According to data published by the Regional Diagnosis Laboratory at “Universidade Federal de Pelotas” (LRD-UFPel) from 1978 to 2015, 6,228 samples from cattle were received; among them, 206 were diagnosed with rabies, 3.3% of the total of bovine diagnostics in the laboratory (Schild et al. 2017Schild A.L., Marques L.S., Coelho A.C.B., Echenique J.Z., Lemos B.S., Estima-Silva P. & Oliveira P.A. 2017. Principais diagnósticos realizados em ruminantes e equinos no Laboratório Regional de Diagnóstico entre 1978-2016. Bol. Lab. Reg. Diagn. 39:48-51.). The 24 municipalities covered by LRD-UFPel are located in six of the 34 micro-regions of Rio Grande do Sul, which holds approximately 20% of the state’s cattle with an effective livestock of approximately 2.8 million animals (Vergara 2017Vergara E.N. 2017. Seção de Gestão dos Processos e da Informação. Fiscal Estadual Agropecuário, IF 2372568, Secretaria Estadual da Agricultura Pecuária e Abastecimento (SEAPA/RS), Porto Alegre. (Comunicação Pessoal) < (Comunicação Pessoal) https://www.agricultura.rs.gov.br/secao-de-gestao-dos-processos-e-da-informacao-agropecuaria
> Accessed on Dez. 13, 2018.
https://www.agricultura.rs.gov.br/secao-...
), which demonstrates the importance of this study in Rio Grande do Sul.
Research on the spatial and time distribution of rabies conducted in the states of Minas Gerais, São Paulo, and Bahia shows the influence of factors such as climate, temperature, and rainfall on the occurrence of outbreaks of rabies in certain areas (municipalities), seasons (seasonality), and throughout the years (cyclicity) (Silva et al. 2001Silva J.A., Moreira E.C., Haddad J.P.A., Modena C.M. & Tubaldini M.A.S. 2001. Distribuição temporal e espacial da raiva bovina em Minas Gerais, 1976 a 1997. Arq. Bras. Med. Vet. Zootec. 53(3):263-272. <http://dx.doi.org/10.1590/S0102-09352001000300001>
https://doi.org/10.1590/S0102-0935200100...
, Menezes et al. 2008Menezes F.L., Silva J.A., Moreira E.C., Meneses J.N.C., Magalhães D.F., Barbosa A.D. & Oliveira C.S.F. 2008. Distribuição espaço-temporal da raiva bovina em Minas Gerais, 1998 a 2006. Arq. Bras. Med. Vet. Zootec. 60(3):566-573. <http://dx.doi.org/10.1590/S0102-09352008000300007>
https://doi.org/10.1590/S0102-0935200800...
, Gomes et al. 2011Gomes M.N., Monteiro A.M.V. & Escada M.I.S. 2011. Raiva bovina segundo os mosaicos de uso e cobertura da terra no estado de São Paulo entre 1992 e 2003. Arq. Bras. Med. Vet. Zootec. 63(2):287-295. <http://dx.doi.org/10.1590/S0102-09352011000200003>
https://doi.org/10.1590/S0102-0935201100...
, Teixeira et al. 2015Teixeira L.H.M., Tomaz L.A.G., Linhares G.F.C., Santos M.F.C. & Jayme V.S. 2015. Distribuição espaço-temporal dos diagnósticos laboratoriais da raiva animal. Ciênc. Anim. Bras. 16(1):144-157. <http://dx.doi.org/10.1590/1809-6891v16i131282>
https://doi.org/10.1590/1809-6891v16i131...
).
In this context, this work aimed to study the epidemiology of outbreaks of rabies observed in cattle from January 2008 to December 2017 by means of their time and spatial distribution in the state of Rio Grande do Sul, as well as to identify the distribution of multifold outbreaks of the disease in the region after successful control for a period of 12 years.
Materials and Methods
A retrospective study, carried out by collecting information on the occurrence of rabies in cattle in different municipalities of the state of Rio Grande do Sul from 2008 to 2017, by means of the analysis of data from records of bovine necropsies performed at LRD-UFPel.
The study region encompassed the LRD-UFPel area of influence (southern Rio Grande do Sul), consisting of 24 municipalities. These municipalities belong to six out of the 35 micro-regions of the state: 1 - the micro-region of Pelotas (municipalities of Arroio do Padre, Canguçu, Capão do Leão, Cerrito Alegre, Cristal, Morro Redondo, Pedro Osório, Pelotas, São Lourenço do Sul, and Turuçu); 2 - Campanha Meridional (Aceguá, Bagé, Dom Pedrito, Hulha Negra e Lavras do Sul); 3 - Campanha Central (São Gabriel e Santana do Livramento); 4 - Serras do Sudeste (Candiota, Encruzilhada do Sul, Pedras Altas, Pinheiro Machado, Caçapava do Sul, Piratini e Santana da Boa Vista); 5 - Jaguarão (Arroio Grande, Herval e Jaguarão); and 6 - Litoral Lagunar (Rio Grande e Santa Vitória do Palmar) (Fig.1).

Data processing and analysis. We collected epidemiological data of each outbreak or isolated case diagnosed at LRD/UFPel. The animals’ municipality of origin was recorded along with the month and year when the disease occurred. Additionally, information on the number of estates and infected animals, as well as the location of each estate as per the Global Positioning System (GPS) was also obtained.
Data were analyzed by means of spatio-temporal statistical methods. For such, the following indicators related to the disease morbidity were built: i - animal incidence rate (AIR) = positive animals/total of animals raised in the municipalities studied (x1000000); ii - incidence rate per estate (EIR) = positive estates/total of estates within the area covered by LRD/UFPel (x100000); iii - incidence rate among estates experiencing outbreaks (OEIR) = positive estates/estates experiencing outbreaks (x100); iv - incidence rate per municipality (MIR) = positive municipalities/total of municipalities within the area covered by LRD-UFPel (x100); v - rabies-specific mortality rate (RMR) = positive animals/animals dying from any bovine disease within the area covered by LRD-UFPel (x100). From this data, a bivariate descriptive statistical analysis was carried out using as dependent variable the incidence of rabies in the animals, the incidence in the estates, and in the municipalities experiencing cases of the disease, and as independent variable, the year, month, micro-region, and municipality.
Time series. Data were analyzed by means of an assessment of case distribution over time and a verification of changes in disease behavior over the years, especially with regard to morbidity and the sensibility of the system employed by the LRD-UFPel. The statistical software Gretl 1.9.12 (GNU Regression, Econometric and Time-series Library) was used for the temporal analyses. An analysis of the existence of trend and seasonality components was carried out by means of verification of the series and their correlograms. Following verification of the components, the series were differentiated and then statistically tested as to the existence of stationarity by means of augmented Dickey-Fuller tests (Dickey & Fuller 1979Dickey D. & Fuller W. 1979. Distribution of the estimators for autoregressive time series with a unit root. J. Am. Statist. Assoc. 74(366):427-431. <http://dx.doi.org/10.2307/2286348>
https://doi.org/10.2307/2286348...
), considering a value of p<0.05 (Baptista et al. 2016Baptista D.Q., Bruhn F.R.P., Rocha C.M.B.M., Torres F.C., Machado E.D., Sáfadi T. & Pereira S.M. 2016. Temporal series analyses in equine infectious anemia cases in the State of Rio de Janeiro, Brazil, 2007 to 2011. Pesq. Vet. Bras. 38(4):431-438., Morettin & Toloi 2006Morettin P.A. & Toloi C.M.C. 2006. Análise de Séries Temporais. 2ª ed. Edgard Blücher, São Paulo. 729p.). When stationarity was observed in the differenced series, the presence or absence of the trend and seasonality components in the monthly series considered was inferred. By calculating Ordinary Least Squares (OLS) models, we also estimated the statistically significant trend (p<0.05) and calculated the coefficient of determination (R2) in the time series of indicators over time.
With a view to characterizing the dynamics of occurrence of endemics and epidemics related to cattle morbidity by rabies in southern Rio Grande do Sul (RS), control diagrams were built based on the case distribution from 2011 to 2016 according to the methodology of geometric mean of the rates, more appropriate when an asymmetrical distribution of cases over the years is observed, according to Bortman (1999)Bortman M. 1999. Elaboración de corredores o canales endémicos mediante planillas de cálculo. Revta Panam. Salud Publ. 5(1):1-8. <http://dx.doi.org/10.1590/S1020-49891999000100001>
https://doi.org/10.1590/S1020-4989199900...
. The original data has been logarithmically transformed (Log10). The geometric means and confidence intervals at 95% (CI 95%) were calculated from the transformed values. The CIs were used as the lower endemic and epidemic thresholds and the endemic curve (Bortman 1999Bortman M. 1999. Elaboración de corredores o canales endémicos mediante planillas de cálculo. Revta Panam. Salud Publ. 5(1):1-8. <http://dx.doi.org/10.1590/S1020-49891999000100001>
https://doi.org/10.1590/S1020-4989199900...
).
Spatial analysis. The distribution of rabies cases across all of the municipalities was analyzed from thematic maps built with software ArcGis 10.2.1 for desktop. We used Shapefiles, the format of spatial data storage consisting in the position, shape, and attributes of geographical characteristics provided by IBGE (2018)IBGE 2018. Produção da Pecuária Municipal, 2014. Available at <Available at http://www.ibge.gov.br/home/estatistica/economia/ppm/2014/default.shtm
> Accessed on Nov. 18, 2018.
http://www.ibge.gov.br/home/estatistica/...
. The maps were projected per year based on overlapping cases of rabies in each area of the municipality.
We used the hot spot analysis tool to identify spatial groups from the identification of high (hot spots) and low values (cold spots) (Anselin 1995Anselin L. 1995. Local indicators of spatial association (LISA). Geogr. Anal. 27(2):93-115. <http://dx.doi.org/10.1111/j.1538-4632.1995.tb00338.x>
https://doi.org/10.1111/j.1538-4632.1995...
) of rabies incidence in cattle. According to Getis & Ord (1992)Getis A. & Ord J.K. 1992. The analysis of spatial association by use of distance statistics. Geogr. Anal. 24(3):189-206. <http://dx.doi.org/10.1111/j.1538-4632.1992.tb00261.x>
https://doi.org/10.1111/j.1538-4632.1992...
, the hot spot analysis calculates the concentration or the lack of concentration of the sum of values associated with the variables in a given data set. Assuming a normal distribution standard, when the probability associated to a z score is positively or negatively higher than a specific level of significance (p value), one obtains a positive or negative spatial association. Therefore, for positive z scores, the intensity of hot spot spatial grouping increases when the z score is higher. On the other hand, for negative z scores, the intensity of cold spot spatial grouping increases when the z score is lower.
Results
From January 2008 to December 2017, the LRD-UFPel received 1418 samples from cattle for diagnosis, including bodies, heads or encephalons, and other organs. During this period, 160 outbreaks of rabies were identified. They took place in 160 estates located in the 24 municipalities within the area of influence of the LRD-UFPel. A number of 591 cattle were infected with the virus out of a total of 25,886 animals raised in the estates infected.
From 2008 to 2011, the rabies virus affected cattle in only four out of the 24 municipalities, all of which belonging to the micro-region of Pelotas. However, from 2012 to 2014, the disease was diagnosed in 13 out of the 24 municipalities (54.16%) belonging to the micro-regions of Pelotas, Serra do Sudeste, Campanha Meridional, and Jaguarão. In 2015, micro-region Campanha Central also recorded cases of the disease. That year, seven municipalities were affected by outbreaks of rabies; in 2016, the number increased to eight and, in 2017, it went down to three.
The highest rabies incidence rate in cattle took place in Capão do Leão, state of RS, with 3.6 cases of infection/1,000,000 animals (Table 1). The highest incidence rate among the estates located in the 24 municipalities within the LRD-UFPel area of influence also took place in Capão do Leão, i.e. six out of 100 thousand cattle farms were infected with the rabies virus (Table 1).
The distribution of rabies in cattle shows 24 outbreaks from 2008 to 2011, which represents 15% of the outbreaks observed in the study period. From 2012 to 2014, 110 outbreaks were diagnosed, which represents 68.75% of the total. From 2015 to 2017, 26 outbreaks occurred, 16.25% of the total. The annual incidence rates of rabies cases observed in the LRD-UFPel area of influence are presented in Table 2.
According to the distribution of rabies over the year, we observe that the highest incidence rate on the animals and estates occurred in June, considering the total of estates in the 24 municipalities. The highest incidence rate among estates experiencing rabies outbreaks occurred from February to June. The highest incidence rate among the municipalities included in the study was observed in March. With regard to the rabies-specific mortality rate within the LRD-UFPel area of influence, the highest percentage was observed between March and April (Table 3).
The statistical analysis of the time series from 2013 to 2016 showed absence of seasonality (p>0.05) and presence of trend (p<0.05) for all of the indicators analyzed (Fig.2 and 3).

(A-B) Time series and equation of the animal rabies incidence rate trend line (x 1,000,000 animals) in the LRD-UFPel area of influence, Rio Grande do Sul, from 2013 to 2016. (A) Original series and (B) trend-free series. (C-D) Time series and equation of the estate rabies incidence rate trend line (x 100,000 animals) in the LRD-UFPel area of influence, Rio Grande do Sul, from 2013 to 2016. (C) Original and (D) trend-free series.

(A-B) Time series and equation of the municipality rabies incidence rate trend line (1 case per 100 animals) in the LRD-UFPel area of influence, Rio Grande do Sul, from 2013 to 2016. (A) Original series and (B) trend-free series. (A-B) Time series and equation of the rabies-specific mortality rate trend line (1 case per 100 animals) in the LRD-UFPel area of influence, Rio Grande do Sul, from 2013 to 2016. (C) Original and (D) trend-free series.
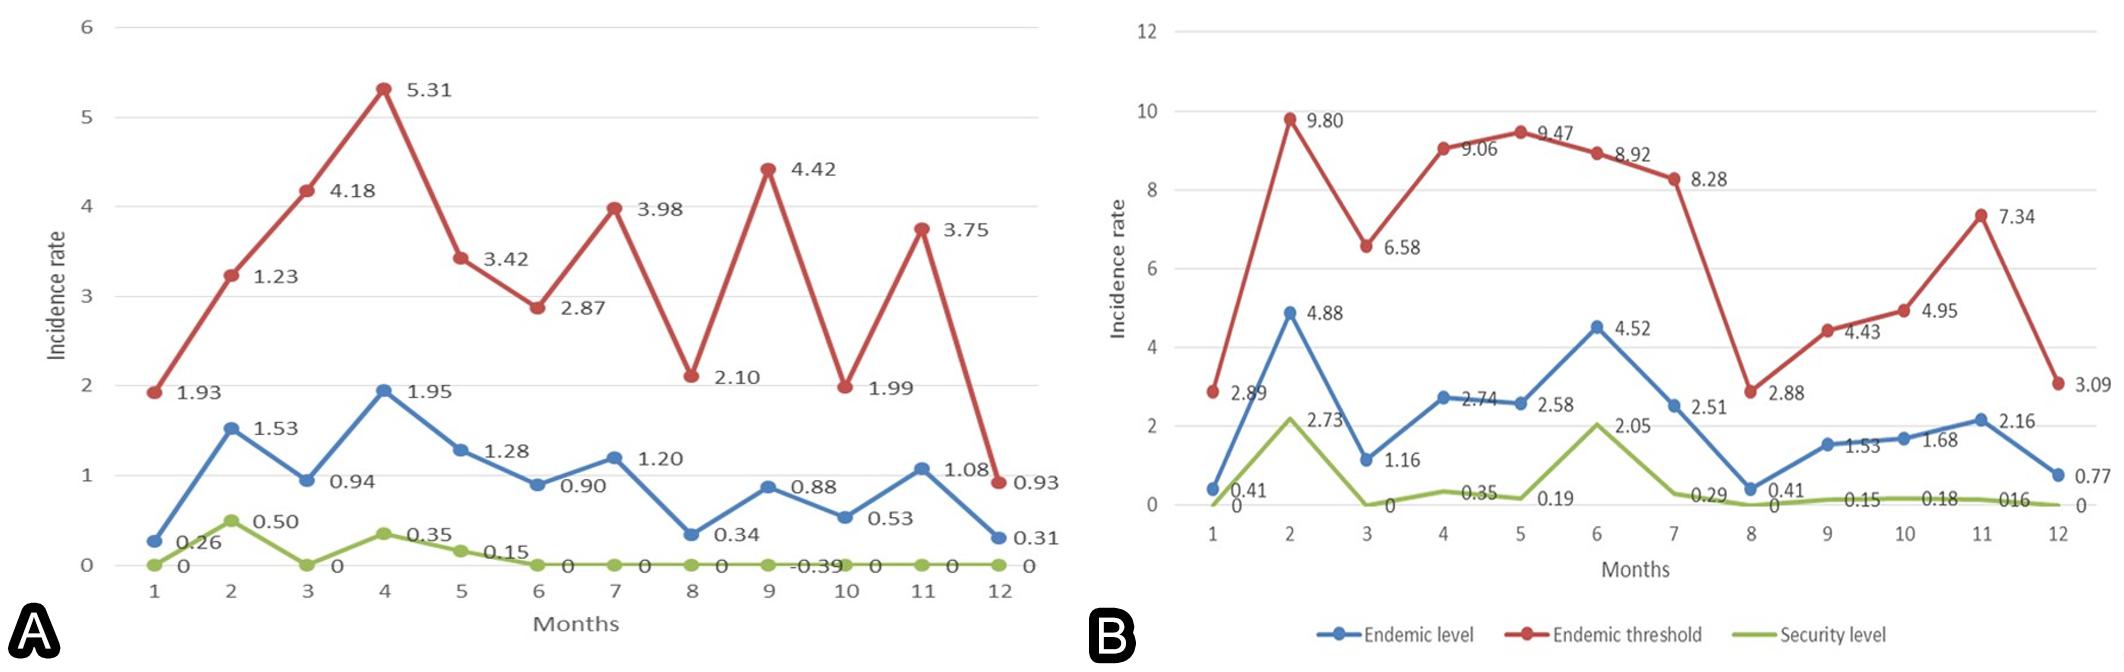
The endemic curves of the animal incidence rate and the incidence rate among estates in the study area from 2011 to 2016 are presented in Figure 4.

(A) Endemic curve of the animal rabies incidence rate (x1000000) in the LRD-UFPel area of influence, Rio Grande do Sul, from 2011 to 2016. x1,000,000 = number of positive animals/total of animals raised in the 24 municipalities. (B) Endemic curve of the incidence rate among estates (x100,000) in the LRD-UFPel area of influence, Rio Grande do Sul, from 2011 to 2016. x100,000 = number of positive estates/number of estates in the 24 municipalities.
The descriptive spatial analysis of the cases of rabies in cattle showed dissemination of the disease across the LRD-UFPel area of influence from 2011 to 2014. In 2011, cases were limited to the micro-region of Pelotas; in 2012, they spread to the micro-region of Serra do Sudeste and, in 2013 and 2014, to the micro-region of Jaguarão. From 2015, the number municipalities and micro-regions affected dropped. That year, although the disease spread to the southern rural micro-region, the number of cases compared to previous years increased only in the municipalities of São Lourenço and Bagé. In 2016, incidence of the disease increased only in Lavras do Sul and Capão do Leão and, in 2017, only in Turuçu (Fig.5).
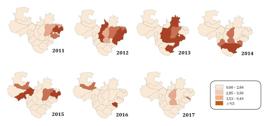
Incidence rate (cases x 1,000,000) of rabies in cattle in the municipalities of the southern region of the state of Rio Grande do Sul from 2011 to 2017.
The statistical hot spots analysis (p<0.05) showed that the cluster of rabies in the micro-region of Pelotas spread to the micro-region of Serra do Sudeste and Campanha Meridional from 2011 to 2014. From 2015 to 2017, the cluster size in these regions reduced (Fig.6).

Areas with clusters (hot spot analysis) of rabies cases in cattle in the municipalities of the southern region of the state of Rio Grande do Sul from 2011 to 2017. The hot spot analysis was conducted with software ArcGis 10.2.1. Areas in red indicate clusters with high values (hot spots).
Discussion
The temporal distribution of rabies in cattle surveyed in the 24 municipalities composing the study area showed variation in the number of municipalities with diagnosis of rabies from 2008 to 2017. This data shows that the virus spread to areas without prior record of the disease. This may have been due to a lack of measures against the bat populations that survive under favorable conditions and cross geographical barriers, favoring dissemination of the virus (Fernandes & Riet-Correa 2007Fernandes C.G. & Riet-Correa F. 2007. Raiva, p.184-198. In: Riet-Correa F., Schild A.L., Lemos R.A.A. & Borges J.R.J. (Eds), Doenças de Ruminantes e Eqüídeos. Vol.1. Pallotti, Santa Maria., Gomes et al. 2011Gomes M.N., Monteiro A.M.V. & Escada M.I.S. 2011. Raiva bovina segundo os mosaicos de uso e cobertura da terra no estado de São Paulo entre 1992 e 2003. Arq. Bras. Med. Vet. Zootec. 63(2):287-295. <http://dx.doi.org/10.1590/S0102-09352011000200003>
https://doi.org/10.1590/S0102-0935201100...
, Dognani et al. 2016Dognani R., Pierre E.J., Silva M.C.P., Patrício M.A.C., Costa S.C., Prado J.R. & Lisboa J.A.N. 2016. Epidemiologia descritiva da raiva dos herbívoros notificados no estado do Paraná entre 1977 e 2012. Pesq. Vet. Bras. 36(12):1145-1154. <http://dx.doi.org/10.1590/s0100-736x2016001200001>
https://doi.org/10.1590/s0100-736x201600...
) and a lack of systematic preventive vaccination of the cattle. From 2015, the number of municipalities experiencing outbreaks dropped again, which is probably due to the control measures undertaken in view of the outbreaks diagnosed in the previous years.
Rabies outbreaks occur in areas characteristic of the southern region of the state--on the one hand, the borders of lake Lagoa dos Patos, encompassing areas covered by native vegetation and large centenary fig trees (São Lourenço do Sul, Turuçu, Pelotas, and Cristal); on the other, mountain areas covered by native forest and stone hills with caves (Canguçu, Santana da Boa Vista, Morro Redondo, Arroio do Padre, Piratini, Pinheiro Machado e Herval). Both regions provide ideal shelters for bat colonies. In addition to shelter, in this region the colonies find food in abundance, especially in the cattle farms (Póvoas et al. 2012Póvoas D.R., Chaves N.P., Bezerra D.C., Almeida V.M. & Saraiva L.Q. 2012. Rabies in herbivorous in the state of Maranhão: a retrospective study. Revta Bras. Ciênc. Vet. 19(2):86-89.). In neighboring municipalities, such as Rio Grande and Arroio Grande, covered by flat, low, and swampy fields, cases of rabies are either inexistent or rare.
The distribution of rabies outbreaks in cattle varied over time. From 2012 to 2014, the incidence rate of the disease in cattle was higher than that found in the other years of the study period. From 2015 to 2017, the number of diagnoses dropped. These results suggest the cyclicity of rabies in this region, although this is not statistically proven. A study conducted in the state of Paraná over a period of 35 years suggests cyclicity of the disease every 18 years (Dognani et al. 2016Dognani R., Pierre E.J., Silva M.C.P., Patrício M.A.C., Costa S.C., Prado J.R. & Lisboa J.A.N. 2016. Epidemiologia descritiva da raiva dos herbívoros notificados no estado do Paraná entre 1977 e 2012. Pesq. Vet. Bras. 36(12):1145-1154. <http://dx.doi.org/10.1590/s0100-736x2016001200001>
https://doi.org/10.1590/s0100-736x201600...
). On the other hand, studies conducted in the states of Mato Grosso do Sul (Mori & Lemos 1998Mori A.E. & Lemos R.A.A. 1998. Raiva, p.47-58. In: Lemos R.A.A. (Ed.), Principais Enfermidades de Bovinos de Corte do Mato Grosso do Sul: reconhecimento e diagnóstico. Universidade Federal do Mato Grosso do Sul, Campo Grande, MS., Neves 2008Neves D.A. 2008. Sazonalidade e ciclicidade da raiva em herbívoros domésticos no estado do Mato Grosso do Sul, 1998 a 2006. Master Thesis, Faculdade de Medicina Veterinária e Zootecnia, Universidade Federal do Mato Grosso do Sul, Campo Grande, MS. 84p., Ribas et al. 2013Ribas N.L.K.S., Carvalho R.I., Santos A.C., Valençoela R.A., Gouveia A.F., Castro M.B., Mori A.E. & Lemos R.A.A. 2013. Doenças do sistema nervoso de bovinos no Mato Grosso do Sul: 1082 casos. Pesq. Vet. Bras. 33(10):1183-1194. <http://dx.doi.org/10.1590/S0100-736X2013001000003>
https://doi.org/10.1590/S0100-736X201300...
), São Paulo (Gomes et al. 2011Gomes M.N., Monteiro A.M.V. & Escada M.I.S. 2011. Raiva bovina segundo os mosaicos de uso e cobertura da terra no estado de São Paulo entre 1992 e 2003. Arq. Bras. Med. Vet. Zootec. 63(2):287-295. <http://dx.doi.org/10.1590/S0102-09352011000200003>
https://doi.org/10.1590/S0102-0935201100...
), and Paraíba (Galiza et al. 2010Galiza G.J.N., Silva M.L.C.R., Dantas A.F.M., Simões S.V.D. & Riet-Correa F. 2010. Doenças do sistema nervoso central de bovinos no semiárido nordestino. Pesq. Vet. Bras. 30(3):267-276. <http://dx.doi.org/10.1590/S0100-736X2010000300014>
https://doi.org/10.1590/S0100-736X201000...
) suggest a period of 5-7 years for cyclicity of rabies in cattle.
The number of cases among animals and in the estates and municipalities is expected to decrease, as a trend of decrease in all of the situations was observed over the study period (p<0.05). Menezes et al. (2008)Menezes F.L., Silva J.A., Moreira E.C., Meneses J.N.C., Magalhães D.F., Barbosa A.D. & Oliveira C.S.F. 2008. Distribuição espaço-temporal da raiva bovina em Minas Gerais, 1998 a 2006. Arq. Bras. Med. Vet. Zootec. 60(3):566-573. <http://dx.doi.org/10.1590/S0102-09352008000300007>
https://doi.org/10.1590/S0102-0935200800...
found similar results in a study conducted in Minas Gerais from 1998 to 2006. Another study carried out in Paraná from 1977 to 2012 observed the absence of trend and seasonality (Dognani et al. 2016Dognani R., Pierre E.J., Silva M.C.P., Patrício M.A.C., Costa S.C., Prado J.R. & Lisboa J.A.N. 2016. Epidemiologia descritiva da raiva dos herbívoros notificados no estado do Paraná entre 1977 e 2012. Pesq. Vet. Bras. 36(12):1145-1154. <http://dx.doi.org/10.1590/s0100-736x2016001200001>
https://doi.org/10.1590/s0100-736x201600...
). Additionally, although some works carried out in the state of RS have suggested that most cases of rabies occur between fall and winter (Marcolongo-Pereira et al. 2011Marcolongo-Pereira C., Sallis E.S.V., Grecco F.B., Raffi M.B., Mauro P.S. & Schild A.L. 2011. Raiva em bovinos na Região Sul do Rio Grande do Sul: epidemiologia e diagnóstico imuno-histoquímico. Pesq. Vet. Bras. 31(4):331-335. <http://dx.doi.org/10.1590/S0100-736X2011000400010>
https://doi.org/10.1590/S0100-736X201100...
) and spring and summer months (Rech et al. 2006Rech R.R., Rissi D.R., Pierezan F., Inkelmann M.A. & Barros C.S.L. 2006. Raiva em herbívoros: 27 casos. Endivet, Campo Grande, MS.), the disease does not present seasonality in the southern region of RS (p>0.05). The absence of seasonality was also observed in studies conducted in the Northeast region of Brazil (Lima et al. 2005Lima E.F., Riet-Correa F., Castro R.S., Gomes A.A.B. & Lima F.S. 2005. Sinais clínicos, distribuição das lesões no sistema nervoso central e epidemiologia da raiva em herbívoros na região Nordeste do Brasil. Pesq. Vet. Bras. 25(4):250-264. <http://dx.doi.org/10.1590/S0100-736X2005000400011>
https://doi.org/10.1590/S0100-736X200500...
) and in the state of São Paulo (Gomes et al. 2011Gomes M.N., Monteiro A.M.V. & Escada M.I.S. 2011. Raiva bovina segundo os mosaicos de uso e cobertura da terra no estado de São Paulo entre 1992 e 2003. Arq. Bras. Med. Vet. Zootec. 63(2):287-295. <http://dx.doi.org/10.1590/S0102-09352011000200003>
https://doi.org/10.1590/S0102-0935201100...
) and Mato Grosso do Sul (Mori & Lemos 1998Mori A.E. & Lemos R.A.A. 1998. Raiva, p.47-58. In: Lemos R.A.A. (Ed.), Principais Enfermidades de Bovinos de Corte do Mato Grosso do Sul: reconhecimento e diagnóstico. Universidade Federal do Mato Grosso do Sul, Campo Grande, MS.).
The disease has epidemic characteristics in most of the months analyzed from 2012 to 2014, remaining endemic over the other years (2011, 2015, and 2016) with eventual short periods of epidemics. Other works have shown that rabies is endemic in cattle, presenting variable incidence over the years, with a few epidemic periods throughout the years (Dognani et al. 2016Dognani R., Pierre E.J., Silva M.C.P., Patrício M.A.C., Costa S.C., Prado J.R. & Lisboa J.A.N. 2016. Epidemiologia descritiva da raiva dos herbívoros notificados no estado do Paraná entre 1977 e 2012. Pesq. Vet. Bras. 36(12):1145-1154. <http://dx.doi.org/10.1590/s0100-736x2016001200001>
https://doi.org/10.1590/s0100-736x201600...
), unlike the findings of this study. In addition, we observed that, as the disease incidence in animals and estates increased, the virus spread geographically to most of the municipalities (54.16%) in the LRD area of influence. Preventive and systematic vaccination of the cattle in these estates is recommended, since the strategy of fighting the bat is not efficient enough to reduce the risks. Furthermore, little is known about the sylvatic cycle of rabies transmitted by wild canids as a source of contamination in addition to bats acting as reservoirs of the virus.
During the study period, we observed not only the dissemination of the disease to unaffected neighboring municipalities, but also the permanence of the disease in previously affected areas. The dissemination of rabies may be related to the geographic expansion of the shelters housing hematophagous bats (Dognani et al. 2016Dognani R., Pierre E.J., Silva M.C.P., Patrício M.A.C., Costa S.C., Prado J.R. & Lisboa J.A.N. 2016. Epidemiologia descritiva da raiva dos herbívoros notificados no estado do Paraná entre 1977 e 2012. Pesq. Vet. Bras. 36(12):1145-1154. <http://dx.doi.org/10.1590/s0100-736x2016001200001>
https://doi.org/10.1590/s0100-736x201600...
). This study shows that the municipalities presenting cases of rabies have favorable environmental characteristics that provide shelter for the species.
The descriptive spatial and hot spots analyses showed expansion of the disease until 2014 and a period of decrease throughout the following years of the study. Studies on the spatio-temporal distribution of rabies in cattle carried out in the state of Minas Gerais from 1998 to 2016 also found this characteristic (Menezes et al. 2008Menezes F.L., Silva J.A., Moreira E.C., Meneses J.N.C., Magalhães D.F., Barbosa A.D. & Oliveira C.S.F. 2008. Distribuição espaço-temporal da raiva bovina em Minas Gerais, 1998 a 2006. Arq. Bras. Med. Vet. Zootec. 60(3):566-573. <http://dx.doi.org/10.1590/S0102-09352008000300007>
https://doi.org/10.1590/S0102-0935200800...
), as well as a study conducted in the state of Paraná from 1977 to 2012 (Dognani et al. 2016Dognani R., Pierre E.J., Silva M.C.P., Patrício M.A.C., Costa S.C., Prado J.R. & Lisboa J.A.N. 2016. Epidemiologia descritiva da raiva dos herbívoros notificados no estado do Paraná entre 1977 e 2012. Pesq. Vet. Bras. 36(12):1145-1154. <http://dx.doi.org/10.1590/s0100-736x2016001200001>
https://doi.org/10.1590/s0100-736x201600...
). The decrease in cases of rabies from 2015 may be related to a higher effectiveness of epidemiological surveillance aiming to fight the bat, as well as to the systematic vaccination of the cattle.
Conclusions
The findings of this study conclude that the incidence of rabies is not associated with seasonality in southern Rio Grande do Sul.
The frequency of cases in the following years seem to tend towards a decrease.
The disease has epidemic characteristics in most of the months analyzed from 2012 to 2014. In the other years (2011, 2015, and 2016), endemic events of epidemics are sporadic.
As the disease incidence in animals and estates increased, the virus spread geographically to most of the municipalities (54.16%) in the LRD area of influence. The spatial analysis showed that the disease spreads mainly due to the geographic proximity between municipalities and neighboring micro-regions.
References
- Anselin L. 1995. Local indicators of spatial association (LISA). Geogr. Anal. 27(2):93-115. <http://dx.doi.org/10.1111/j.1538-4632.1995.tb00338.x>
» https://doi.org/10.1111/j.1538-4632.1995.tb00338.x - Baptista D.Q., Bruhn F.R.P., Rocha C.M.B.M., Torres F.C., Machado E.D., Sáfadi T. & Pereira S.M. 2016. Temporal series analyses in equine infectious anemia cases in the State of Rio de Janeiro, Brazil, 2007 to 2011. Pesq. Vet. Bras. 38(4):431-438.
- Brasil. Ministério da Agricultura, Pecuária e Abastecimento 2017. Controle da Raiva dos Herbívoros e Encefalopatia Espongiforme Bovina (EEB). Available at <Available at http://www.agricultura.gov.br/assuntos/sanidade-animal-e-vegetal/saude-animal/programas-de-saude-animal/prog-nacional-de-controle-da-raiva-dos-herbivoros-e-outras-encefalopatias > Accessed on Jun. 24, 2018.
» http://www.agricultura.gov.br/assuntos/sanidade-animal-e-vegetal/saude-animal/programas-de-saude-animal/prog-nacional-de-controle-da-raiva-dos-herbivoros-e-outras-encefalopatias - Bortman M. 1999. Elaboración de corredores o canales endémicos mediante planillas de cálculo. Revta Panam. Salud Publ. 5(1):1-8. <http://dx.doi.org/10.1590/S1020-49891999000100001>
» https://doi.org/10.1590/S1020-49891999000100001 - Dickey D. & Fuller W. 1979. Distribution of the estimators for autoregressive time series with a unit root. J. Am. Statist. Assoc. 74(366):427-431. <http://dx.doi.org/10.2307/2286348>
» https://doi.org/10.2307/2286348 - Dognani R., Pierre E.J., Silva M.C.P., Patrício M.A.C., Costa S.C., Prado J.R. & Lisboa J.A.N. 2016. Epidemiologia descritiva da raiva dos herbívoros notificados no estado do Paraná entre 1977 e 2012. Pesq. Vet. Bras. 36(12):1145-1154. <http://dx.doi.org/10.1590/s0100-736x2016001200001>
» https://doi.org/10.1590/s0100-736x2016001200001 - Fernandes C.G. & Riet-Correa F. 2007. Raiva, p.184-198. In: Riet-Correa F., Schild A.L., Lemos R.A.A. & Borges J.R.J. (Eds), Doenças de Ruminantes e Eqüídeos. Vol.1. Pallotti, Santa Maria.
- Galiza G.J.N., Silva M.L.C.R., Dantas A.F.M., Simões S.V.D. & Riet-Correa F. 2010. Doenças do sistema nervoso central de bovinos no semiárido nordestino. Pesq. Vet. Bras. 30(3):267-276. <http://dx.doi.org/10.1590/S0100-736X2010000300014>
» https://doi.org/10.1590/S0100-736X2010000300014 - Getis A. & Ord J.K. 1992. The analysis of spatial association by use of distance statistics. Geogr. Anal. 24(3):189-206. <http://dx.doi.org/10.1111/j.1538-4632.1992.tb00261.x>
» https://doi.org/10.1111/j.1538-4632.1992.tb00261.x - Gomes M.N., Monteiro A.M.V. & Escada M.I.S. 2011. Raiva bovina segundo os mosaicos de uso e cobertura da terra no estado de São Paulo entre 1992 e 2003. Arq. Bras. Med. Vet. Zootec. 63(2):287-295. <http://dx.doi.org/10.1590/S0102-09352011000200003>
» https://doi.org/10.1590/S0102-09352011000200003 - Hudson L.C., Weinstock D., Jordan T. & Bold-Fletcher N.O. 1996. Clinical features of experimentally induced rabies in cattle and sheep. J. Vet. Med. B 43(2):85-95. <http://dx.doi.org/10.1111/j.1439-0450.1996.tb00292.x> <PMid:8693846>
» https://doi.org/10.1111/j.1439-0450.1996.tb00292.x - IBGE 2018. Produção da Pecuária Municipal, 2014. Available at <Available at http://www.ibge.gov.br/home/estatistica/economia/ppm/2014/default.shtm > Accessed on Nov. 18, 2018.
» http://www.ibge.gov.br/home/estatistica/economia/ppm/2014/default.shtm - Lima E.F., Riet-Correa F., Castro R.S., Gomes A.A.B. & Lima F.S. 2005. Sinais clínicos, distribuição das lesões no sistema nervoso central e epidemiologia da raiva em herbívoros na região Nordeste do Brasil. Pesq. Vet. Bras. 25(4):250-264. <http://dx.doi.org/10.1590/S0100-736X2005000400011>
» https://doi.org/10.1590/S0100-736X2005000400011 - Marcolongo-Pereira C., Sallis E.S.V., Grecco F.B., Raffi M.B., Mauro P.S. & Schild A.L. 2011. Raiva em bovinos na Região Sul do Rio Grande do Sul: epidemiologia e diagnóstico imuno-histoquímico. Pesq. Vet. Bras. 31(4):331-335. <http://dx.doi.org/10.1590/S0100-736X2011000400010>
» https://doi.org/10.1590/S0100-736X2011000400010 - Menezes F.L., Silva J.A., Moreira E.C., Meneses J.N.C., Magalhães D.F., Barbosa A.D. & Oliveira C.S.F. 2008. Distribuição espaço-temporal da raiva bovina em Minas Gerais, 1998 a 2006. Arq. Bras. Med. Vet. Zootec. 60(3):566-573. <http://dx.doi.org/10.1590/S0102-09352008000300007>
» https://doi.org/10.1590/S0102-09352008000300007 - Morettin P.A. & Toloi C.M.C. 2006. Análise de Séries Temporais. 2ª ed. Edgard Blücher, São Paulo. 729p.
- Mori A.E. & Lemos R.A.A. 1998. Raiva, p.47-58. In: Lemos R.A.A. (Ed.), Principais Enfermidades de Bovinos de Corte do Mato Grosso do Sul: reconhecimento e diagnóstico. Universidade Federal do Mato Grosso do Sul, Campo Grande, MS.
- Neves D.A. 2008. Sazonalidade e ciclicidade da raiva em herbívoros domésticos no estado do Mato Grosso do Sul, 1998 a 2006. Master Thesis, Faculdade de Medicina Veterinária e Zootecnia, Universidade Federal do Mato Grosso do Sul, Campo Grande, MS. 84p.
- Rech R.R., Rissi D.R., Pierezan F., Inkelmann M.A. & Barros C.S.L. 2006. Raiva em herbívoros: 27 casos. Endivet, Campo Grande, MS.
- Ribas N.L.K.S., Carvalho R.I., Santos A.C., Valençoela R.A., Gouveia A.F., Castro M.B., Mori A.E. & Lemos R.A.A. 2013. Doenças do sistema nervoso de bovinos no Mato Grosso do Sul: 1082 casos. Pesq. Vet. Bras. 33(10):1183-1194. <http://dx.doi.org/10.1590/S0100-736X2013001000003>
» https://doi.org/10.1590/S0100-736X2013001000003 - Schild A.L., Marques L.S., Coelho A.C.B., Echenique J.Z., Lemos B.S., Estima-Silva P. & Oliveira P.A. 2017. Principais diagnósticos realizados em ruminantes e equinos no Laboratório Regional de Diagnóstico entre 1978-2016. Bol. Lab. Reg. Diagn. 39:48-51.
- Silva J.A., Moreira E.C., Haddad J.P.A., Modena C.M. & Tubaldini M.A.S. 2001. Distribuição temporal e espacial da raiva bovina em Minas Gerais, 1976 a 1997. Arq. Bras. Med. Vet. Zootec. 53(3):263-272. <http://dx.doi.org/10.1590/S0102-09352001000300001>
» https://doi.org/10.1590/S0102-09352001000300001 - Póvoas D.R., Chaves N.P., Bezerra D.C., Almeida V.M. & Saraiva L.Q. 2012. Rabies in herbivorous in the state of Maranhão: a retrospective study. Revta Bras. Ciênc. Vet. 19(2):86-89.
- Teixeira L.H.M., Tomaz L.A.G., Linhares G.F.C., Santos M.F.C. & Jayme V.S. 2015. Distribuição espaço-temporal dos diagnósticos laboratoriais da raiva animal. Ciênc. Anim. Bras. 16(1):144-157. <http://dx.doi.org/10.1590/1809-6891v16i131282>
» https://doi.org/10.1590/1809-6891v16i131282 - Vergara E.N. 2017. Seção de Gestão dos Processos e da Informação. Fiscal Estadual Agropecuário, IF 2372568, Secretaria Estadual da Agricultura Pecuária e Abastecimento (SEAPA/RS), Porto Alegre. (Comunicação Pessoal) < (Comunicação Pessoal) https://www.agricultura.rs.gov.br/secao-de-gestao-dos-processos-e-da-informacao-agropecuaria > Accessed on Dez. 13, 2018.
» https://www.agricultura.rs.gov.br/secao-de-gestao-dos-processos-e-da-informacao-agropecuaria
Publication Dates
-
Publication in this collection
30 Sept 2019 -
Date of issue
July 2019
History
-
Received
08 Feb 2019 -
Accepted
01 Apr 2019