ABSTRACT:
The aim in this work was to evaluate the coexistence of Urochloa decumbens (signal grass) and Synedrellopsis grisebachii (Cinderella weed) in a replacement series experiment. To find the critical population density, 1, 2, 4, 8, 16, 24 and 32 plants were planted in the same box, harvested after 40 days, dried and weighted, and analyzed through regression analysis. The replacement series experiment used density percentages for signal grass and Cinderella weed of 100:0, 75:25, 50:50, 25:75 and 0:100. The aboveground parts were harvested, dried and analyzed through qualitative and quantitative measures. Sixteen plants per box were needed for the signal grass to achieve the critical population. Qualitative analysis showed mutual harm to the dry matter allocation of both species. Quantitative analysis showed Cinderella weed to be a better competitor than signal grass.
Keywords:
replacement series experiment; interspecific competition; intraspecific competition ecological indexes; Urochloa decumbens; Synedrellopsis grisebachii
RESUMO:
O objetivo deste trabalho foi avaliar a coexistência de Urochloa decumbens (capim-braquiária) e Synedrellopsis grisebachii (agriãozinho) num modelo de experimento substitutivo. Para determinação da população crítica, foram plantadas nas proporções de 1, 2, 4, 8, 16, 24 e 32 plantas por vaso e colhidas as partes aéreas, secadas e pesadas, para serem analisadas através de análise de regressão. O experimento substitutivo teve como proporções porcentuais de capim-braquiária e agriãozinho, respectivamente, 100:0, 75:25, 50:50, 25:75 e 0:100. Foram colhidas as partes aéreas, que foram analisadas através dos métodos qualitativos e quantitativos. Foram necessárias 16 plantas para a população crítica do capim-braquiária. A análise qualitativa indica que as duas espécies têm decréscimo na produção de massa em coexistência. A análise quantitativa indica que o agriãozinho possui maior competitividade que o capim-braquiária.
Palavras-chave:
experimento substitutivo; competição interespecífica; competição intraespecífica; índices ecológicos; Urochloa decumbens; Synedrellopsis grisebachii
INTRODUCTION
Grass species of the genus Urochloa (Syn. Brachiaria) are commonly used as pasture species grass for cattle production in Brazil. Urochloa occupies 85% of Brazillian cattle pastures, with signal-grass (Urochloa decumbens) as a highlight; this species is used in 55% of the aforementioned pastures, largely due to its rusticity, tolerance for poor soils and seed production in soil (Moreira et al., 2009Moreira L.M. et al. Perfilhamento, acúmulo de forragem e composição bromatológica do capim-braquiária adubado com nitrogênio. Rev Bras Zootec. 2009;38:1675-84. ). These characteristics are also the reason why the species is considered a weed when found in many annual and perennial crops in a large part of the country (Jakelatis et al., 2004Jakelatis A. et al. Manejo de plantas daninhas no consórcio de milho com capim-braquiária (Brachiaria decumbens). Planta Daninha. 2004;22:553-60. )
Synedrellopsis grisebachii, also known as Cinderella weed, is a South American native species, dispersed in Brazil throughout the Center-South and Center-West regions; it is prostrated with intense vegetal growth (Kissmann and Groth, 1992Kissmann K.G., Groth D. Plantas infestantes e nocivas. São Paulo: Basf Brasileira, 1992. Tomo II. 789p. ). It is marked as a weed species in pastures (Oliveira et al., 2000Oliveira E. et al. Recuperação de pastagens no Noroeste do Paraná. Londrina: Instituto Agronômico do Paraná, 2000. 96p.), coffee fields (Cunha et al., 2013Cunha A.J., Melo B., Santos J.C.F. Fitossociologia de plantas daninhas em cafezal intercalado com leguminosas perenes. Cerrado Agroci. 2013;4:9-15.), and citrus orchards (Fidalski et al., 2007Fidalski J., Tormena C.A., Silva A.P. Qualidade física do solo em pomar de laranjeira no noroeste do Paraná com manejo da cobertura permanente na entrelinha. Rev Bras Cienc Solo. 2007;31:423-33.). Commonly found in parks and grass fields, among other areas with grass coverage, its high population density high diminishes the yield of other plants where it is present (Oliveira, 2011Oliveira C.A.V.M. Fitossociologia da comunidade infestante de gramados de grama-batatais (Paspalum notatum Flügge) em praças de Jaboticabal, SP [dissertação]. Jaboticabal: Universidade Estadual “Júlio de Mesquita Filho”, 2011. 58p.).
Plant interference may occur in two ways: intraspecific, between individuals of the same species, and interspecific, between different species, for many resources in the field. Competition occurs for nutrients, light, space and water, and the spatial combination of plants in the field highly affects the level of interference. There are essays used to evaluate the interference of weeds and crops, which aim to attain information on the correct management between these species (Zanine and Santos, 2004Zanine A.M., Santos E.M. Competição entre espécies de plantas - Uma revisão. Rev FZVA. 2004;11:10-30.).
Among the factors resulting in interference levels, the population density is considered one of the most important, as more plants exist in the same space, the resources necessary to supply each individual are increased (Christoffoleti and Vitória-Filho, 1996Christoffoleti P.J., Victoria Filho R. Efeitos da densidade e proporção de plantas de milho (Zea mays L.) e caruru (Amaranthus retroflexus L.) em competição. Planta Daninha. 1996;14: 42-7.).
There are many models used to determine the intensity of coexistence between two species, among them are additive, systemic and replacement experiments (Aslani and Saeedipour, 2015Aslani S., Saeedipour S. Competitive interaction of canola (Brassica napus) against wild mustard (Sinapis arvensis) using replacement series method. WALIA J. 2015;31:111-6.).
Additive experiments are one of the most common tools to evaluate crop-weed interaction. In an additive experiment, the crop is maintained at a single constant density and the treatments consist of the addition of specimens to this population. As there is variation in the total population density, the data may be controversial; without constant plant proportions, result interpretation can become more difficult. The systemic model maintains a greater focus in the area a weed species affects a given crop, such as Nelder experiments or additive systemic model, through spatial variation and total plant density (Radosevich, 1987Radosevich S.R. Methods to study interactions among crops and weeds. Weed Technol. 1987;1:190-8.).
Experiments in the replacement series are typically used to evaluate the coexistence between crops and weeds (Santos et al., 1997Santos B.M., Bewick T.A., Shilling D.G. Competitive interactions of tomato (Lycopersicum esculentum) and nutsedges (Cyperus spp.) Weed Sci. 1997:45:229-33.; Yamauti et al., 2011Yamauti M.S., Alves P.L.C.A., Carvalho L.B. Interações competitivas de triticale (Triticum turgidosecale) e nabiça (Raphanus raphanistrum) em função da população e proporção de plantas. Planta Daninha. 2011;29:129-35.; Fontana et al., 2015Fontana L.C. et al. Barley competitive ability in coexistence with black oat or wild radish. Científica. 2015;43:22-9.) in order to understand which is the better competitor among species or biotypes and how these species interact among themselves within a constant population density (Passini et al., 2003Passini T., Christofoletti P.J., Yada I.F.U. Competitivity of the common-bean plant relative to the weed alexandergrass [Brachiaria plantaginea (Link) Hitch.]. Sci Agric. 2003;60:259-68.).
From the presupposition that Cinderella weed and signal grass coexist in the same environment, liable of competition for the same resources, the aim in this work was to study the effects on intra- and interspecific interference on the initial development of both species.
MATERIAL AND METHODS
Two experiments were performed in field conditions during the months of September to December, 2014, without water restriction. The experiments were conducted in polyethylene boxes with a 19.8 L capacity (0.40 x 0.33 x 0.15 m2), filled with a mix of Oxisol and river sand in a 3:1 proportion (v:v), previously fertilized with an equivalent to 300 kg.ha-1 of 04-20-20 NPK formulation, adding 200 kg.ha-1 of urea.
For each experiment, seedlings were seeded in polystyrene trays with 128 cells, using commercial seedling substratum, 15 days before the definitive planting in the boxes.
The first experiment consisted of monoculture of signal-grass and Cinderella weed and was performed to determine the populations’ critical density. To do so, 1, 2, 4, 8, 16, 24 and 32 seedlings were planted in the boxes, equivalent to 7.5, 15, 30, 60, 121, 181 and 242 plants.m 2.
Forty days after planting, the aboveground shoot systems were cut, placed in paper bags and dried in an air-circulation oven at 65 oC. After that, the dry matter was measured in semi-analytic scale with precision to three decimals.
The analysis to attain the critical density was performed according to Spitters (1983Spitters C.J.T. An alternative approach to the analysis of mixed cropping experiments. 1. Estimation of competition effects. Nether J Agric Sci. 1983;31:1-11.). With the data obtained, the mass reciprocal (1/w) was calculated using the formula:
in which the reciprocal is the relation between plant density (N) and the mass produced per area unit (Y). Using the reciprocal values, a regression analysis was generated with a linear model:
in which the value of b0 is the mass produced by a single plant and it is augmented in b1 units after each unit increment in the plant population. Max biomass production (Ymax) is given by the inverse of b1:
Critical density is then adjusted with an equation relating produced mass and density:
being the critical density a population density (Y) next to the value of Ymax.
This experiment was conducted with a completely randomized design, using seven treatments and four replications for each species. The analyses were performed with the statistical software Origin 9.0.
After the first experiment, a second experiment using the replacement model was performed, with a constant density of 121 plants m-2, however, the treatments consisted of different proportions of signal grass and Cinderella weed. The percentage proportions were 100:0, 75:25, 50:50, 25:75 and 0:100, for signal grass and Cinderella weed densities.
The plants were monitored for 40 days after planting, after which the aboveground shoot systems of each species were cut, placed in paper bags and dried in an air-circulation oven at 65 oC. After that, the dry matter was measured in semi-analytic scale with precision to three decimals.
Data found was analyzed in two ways: qualitatively and quantitatively, through graphical analysis and regression analysis, respectively.
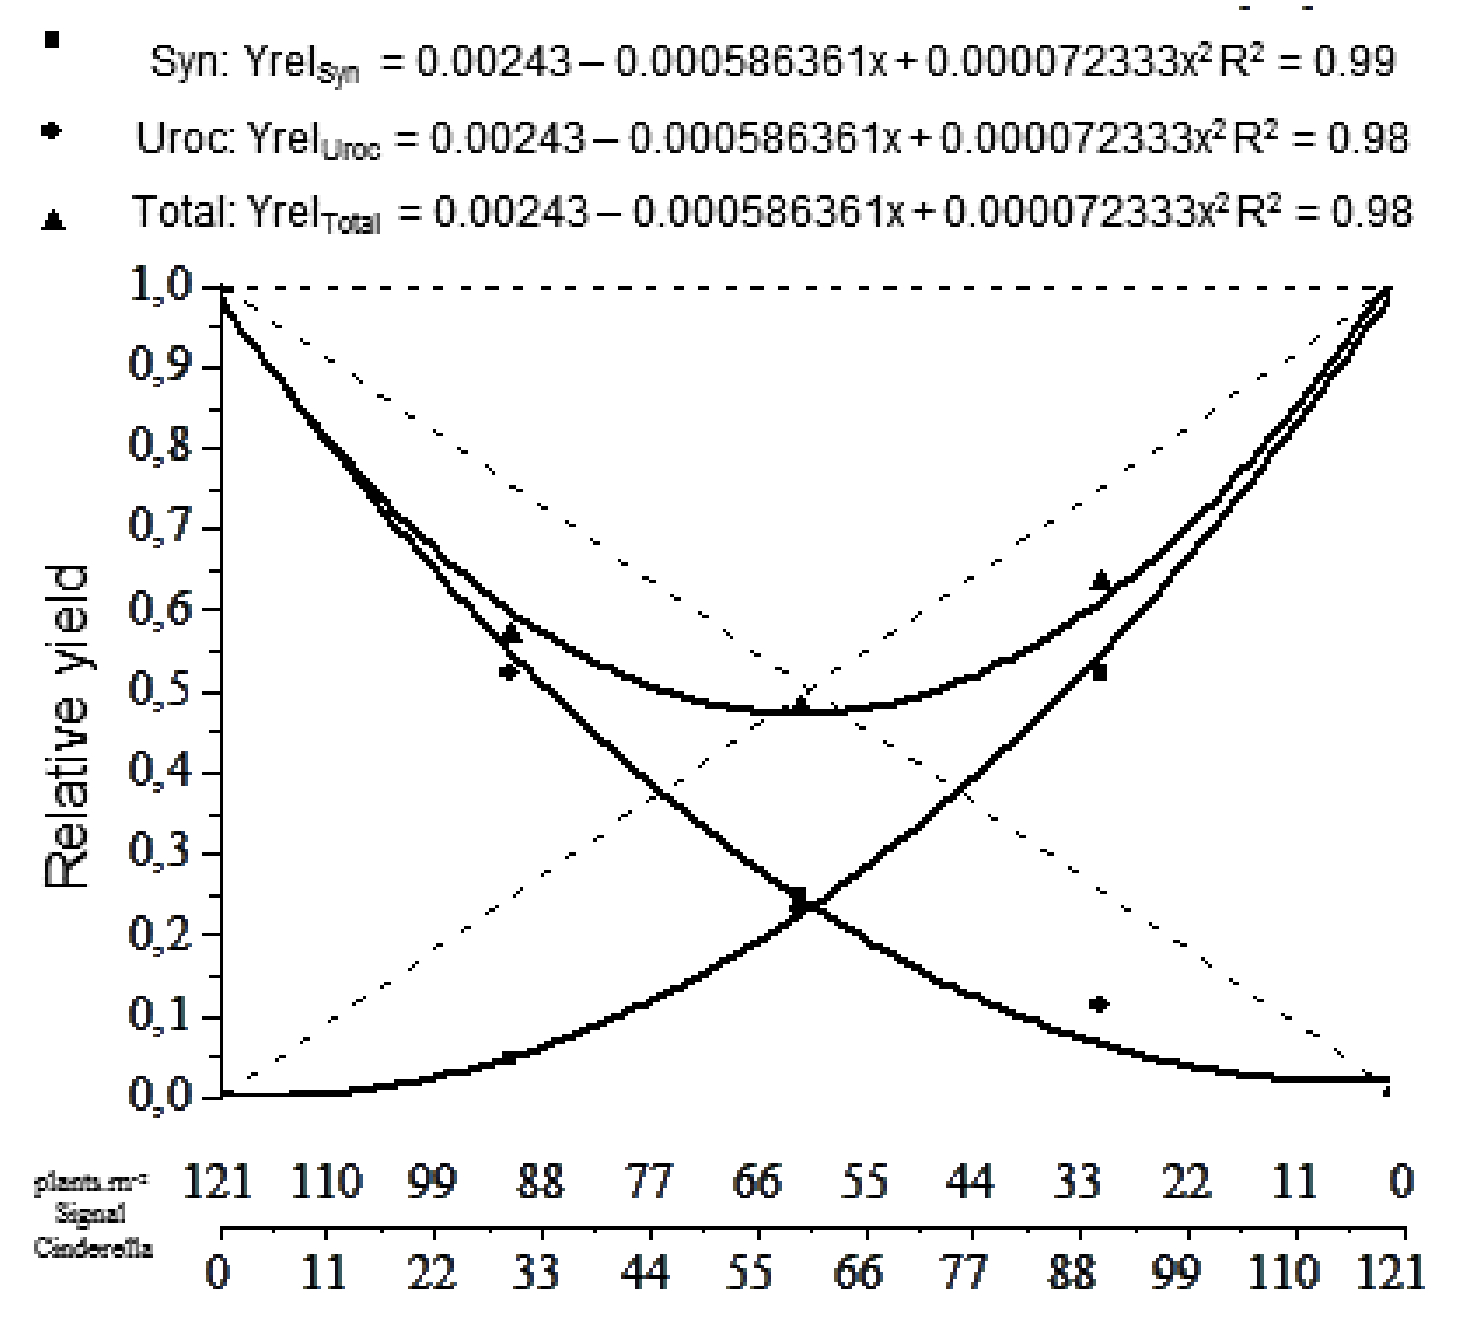
For qualitative analysis, also known as the conventional analysis for replacement experiments (Agostinetto et al., 2008Agostinetto D. et al. Competitividade relativa entre cultivares de arroz irrigado e biótipo de capim-arroz (Echinochloa spp.) Planta Daninha. 2008;26:757-66.), it is necessary to calculate the relative yield of each species and treatment.
To obtain this relative yield, the relative yield in relation to density was used as described by Cousens and O’Neil (1993Cousens R., O’neil M. Denisty dependence of replacement series experiments. Oikos. 1993;66:347-52. ):
with p being the percentage density of the given species, varying from 0 to 1; Ymix being the productivity of the treatment in coexistence with second species; and Ymax being the productivity of the species when cultivated in monoculture.
Then, a dispersal graphic was built using the relative yield of each species and the total relative yield, which is the sum of the separate relative yields of both species. It is also established the theoretical equality line, which represents the relative yield if no interference is shown, which ranges from 0 to 1 for each species and with a line passing through 1 in the total relative yield.
With these data, the difference between attained and theoretical relative yields is calculated. Using the t-test, it is verified if the difference between those is statistically different, being null if means are equal to zero (H0 = 0; H1¹0).
The final result is achieved by analyzing whether or not if the mass in mixed treatments is superior or inferior to the line of theoretical relative yields. If line is convex, it demonstrates a loss when the species are in coexistence; if it is concave, there are benefits when in coexistence (Cousens, 1991Cousens R. Aspects of the design and interpretation of competition (interference) experiments. Weed Technol. 1991;5:664-73.).
The quantitative analysis, referencing Spitters (1983Spitters C.J.T. An alternative approach to the analysis of mixed cropping experiments. 1. Estimation of competition effects. Nether J Agric Sci. 1983;31:1-11.), Passini (2001) and Yamauti et al. (2011Yamauti M.S., Alves P.L.C.A., Carvalho L.B. Interações competitivas de triticale (Triticum turgidosecale) e nabiça (Raphanus raphanistrum) em função da população e proporção de plantas. Planta Daninha. 2011;29:129-35.), is obtained via a multiple regression equation with the mass reciprocal (1/w), following the model:
in which N is the plant density per area, Y is the mass produced per area and b1,0 is the theoretical maximum mass produced for species 1. This mass is increased by b1,1 units due to intraspecific interference, with each N1 increase in the same species population, and in b1,2 units due to interspecific interference for each N2 unit increase in the species 2 population.
Based on the equations attained for each species, were calculated the ecological indexes of relative competition (C) for each species and ecological niche differentiation (END) using the following formulas:
There is niche differentiation when END is higher than 1 (Spitters, 1990Spitters C.J.T. On descriptive and mechanistic models for inter-plant competition, with particular reference to crop-weed interaction. In: Rabbinge R. et al. Theoretical production ecology: reflections and prospects. Wageningen: Pudoc, 1990. p.217-36. (Simulation monographs, 34).).
Finally, the relative competition index (RC), relative crowding coefficient (k) and aggressiveness (A) were calculated for each species, using the formulas described in Cousens and O’Neil (1993Cousens R., O’neil M. Denisty dependence of replacement series experiments. Oikos. 1993;66:347-52. ):
in which C is the relative competition index, subscript “1” and “2” refer to each species and p is the density of first species, varying from 0 to 1.
Relative competition refers to growth when comparing one species to the other. The crowding coefficients reveal dominance between the species. The aggressiveness index indicates which species is a better competitor.
Analyzing the three parameters, it is more useful to observe which species in the experiment has better competitive characteristics. When a species has two favorable indexes (RC>1, Ka>Kb, A>0), it is considered a better competitor. The standard for this analysis is the population at 50:50 (%) density data.
The analyses for this experiment were performed with the statistical software Origin 9.0.
RESULTS AND DISCUSSION
Critical density determination
For signal grass, the linear equation for the mass reciprocal was 0.00368 + 0.000625649*N (Figure 1A). With that, it was established the maximum mass yield for signal grass at 40 days after planting is 1,598.34 g.

Mass reciprocal (A) and maximum mass yield (B) of signal grass for obtaining critical density.
Extracting the coefficients b0 and b1 from the linear regression, it is inferred that the yield expectation equation for signal grass relating to its density is (Figure 1B). As such, it was determined that, with a population density of 121 plants m-2, there is no difference in mass production related to the expected maximum yield.
For the Cinderella weed, the linear equation for mass reciprocal was <mml:math><mml:mn>0.13196</mml:mn><mml:mo>+</mml:mo><mml:mn>0.000711428</mml:mn><mml:mi mathvariant="normal">*</mml:mi><mml:mi mathvariant="normal">N</mml:mi></mml:math> (Figure 2A). In this equation, maximum mass yield after 40 days after planting is 1,848.32 g.
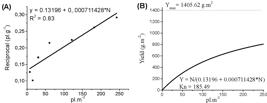
Mass reciprocal (A) and maximum mass yield (B) of Cinderella weed for obtaining critical density.
Extracting the coefficients b0 and b1 from the linear regression, it is inferred that the yield expectation equation for signal grass relating to its density is (Figure 2B).
When the formula was used to obtain the critical density for Cinderella weed, it was shown that there were no population with the maximum yield mass.
Kn is the quantity of plants needed for the mass accumulation to be 50% of the maximum yield. As more plants are needed to attain 50%, the intraspecific interference is shown to be at a lower level.
Kn for signal grass was 5.81 plants, while for Cinderella weeds it was 185.49 plants. Therefore, the intraspecific interference of signal grass is higher than that of Cinderella weed.
The replacement experiment used a population of 121 plants m-2, which is considered the critical density of signal grass, as a reference for both species.
Replacement experiment - qualitative
It is observed that both species, when in coexistence, had less mass than the equality line (Figure 3). Therefore, it may be affirmed that the coexistence of these species reduces the resource capture for both. The fact that the total mass accumulation in the system (Yreltotal) is 50% confirms this.

Harper (1977Harper J.L. Population biology of plants. London: Academic Press, 1977. 892p.) states that, as in the species behavior shown here, interspecific competition between species has greater influence than intraspecific competition, which may be caused by two situations: toxin liberation (allelopathic compounds) of one or both species on the other, which limits growth; or the resource consumption of species A being greater while the higher percentage of species B causes shadowing, and thus, diminishes the yield of species A.
Replacement experiment - quantitative
From the mass reciprocal of each species dry matter, the following formulas for multiple linear regression regarding the densities were attained: and , in which the subscript “a” refers to Cinderella weed and subscript “b” refers to signal grass, 1/w is the mass reciprocal regarding species and N is the given species density. The R2 for each equation is 0.84 and 0.92, respectively. The data is shown in Tables 1and2.
Multiple linear regression of mass reciprocal of Cinderella weed and its analysis of variation
Based on the regression data, the ecological indexes of relative competition and ecological niche differentiation (END) were calculated, as shown in Table 3.
The relative competition coefficient expresses, for a given species A, how many plants of species B cause interspecific competition equivalent to the addition of one plant of species A, which causes intraspecific competition.
The coefficient of both plants was very close to 1; this is equivalent to stating that the presence of one specimen of signal grass is equivalent in competitive terms to one specimen of Cinderella weed in the same environment.
With this proximity in values, END is also close to one. The differentiation of the niche occurs when END is higher than 1, therefore, both species compete in the same niche. As such, in the same environment, the two species tend to have lower productions than when in monoculture.
As in the critical density determination experiment the intraspecific competition of signal grass was higher than that of Cinderella weed, it is probable that, as cited in the qualitative analysis, there are allelochemicals that interfere in the species growth.
The genus of Urochloa has already been tested for its allelopathic potential and it has already been observed that allelopathic substances such as p-coumaric acid and aconitic acid are present (Souza et al., 2006Souza L.S. et al. Efeito alelopático de capim-braquiária (Brachiaria decumbens) sobre o crescimento inicial de sete espécies de plantas cultivadas. Planta Daninha. 2006;24:657-68.). It has also been established that one reason why signal grass invades natural vegetation is, partially, due its allelopathic potential (Barbosa et al., 2008Barbosa E.G. et al. Allelopathic evidence in Brachiaria decumbens and its potential to invade the Brazilian Cerrados. Braz Arch Biol Technol. 2008;51:625-31.).
Assays for secondary metabolites identification in Cinderella weed have identified many classes with allelopathic potential, such as phenolic compounds, tannins, steroids/triterpenes and alkaloids (Barros et al., 2009Barros M.F. et al. Análise fitoquímica, atividade citotóxica e antioxidante de Synedrellopsis grisebachii Hieron & Kuntze (Asteraceae) coletada no Pantanal e Cerrado sul-matogrossense. Rev Bio (In)Formação. 2009;3:233-48.). Studies of the species in San Miguel de Tucumán, Argentina, found sesquiterpene lactones (Hernández et al., 1996Hernández L.R. et al. Sesquiterpene lactones and other constituents of Stevia maimarensis and Synedrellopsis grisebachii. Phytochemestry. 1996;42:681-4. ).
Ecological indexes of relative competition, relative crowding and aggressiveness may be found in Table 4.
It is observed that the RC and K indexes for Cinderella weed were higher than those of signal grass, and aggressiveness was greater than 1. With these data, it can be stated that Cinderella weed is more competitive than signal grass.
It may be inferred that Cinderella weed may compete better and may capture nutrients in the environment with more ease than signal grass. This result may explain the field observations in which Cinderella weed can suppress signal grass plants.
It is concluded that the coexistence of signal grass and Cinderella weed reduces the mass of both species due the occupation of the same ecological niche and due to the inter and intraspecific competitive abilities similar. In ecological terms, Cinderella weed has more potent competitive characteristics than signal grass during the initial period of development.
REFERENCES
- Agostinetto D. et al. Competitividade relativa entre cultivares de arroz irrigado e biótipo de capim-arroz (Echinochloa spp.) Planta Daninha. 2008;26:757-66.
- Aslani S., Saeedipour S. Competitive interaction of canola (Brassica napus) against wild mustard (Sinapis arvensis) using replacement series method. WALIA J. 2015;31:111-6.
- Barbosa E.G. et al. Allelopathic evidence in Brachiaria decumbens and its potential to invade the Brazilian Cerrados. Braz Arch Biol Technol. 2008;51:625-31.
- Barros M.F. et al. Análise fitoquímica, atividade citotóxica e antioxidante de Synedrellopsis grisebachii Hieron & Kuntze (Asteraceae) coletada no Pantanal e Cerrado sul-matogrossense. Rev Bio (In)Formação. 2009;3:233-48.
- Christoffoleti P.J., Victoria Filho R. Efeitos da densidade e proporção de plantas de milho (Zea mays L.) e caruru (Amaranthus retroflexus L.) em competição. Planta Daninha. 1996;14: 42-7.
- Cousens R. Aspects of the design and interpretation of competition (interference) experiments. Weed Technol. 1991;5:664-73.
- Cousens R., O’neil M. Denisty dependence of replacement series experiments. Oikos. 1993;66:347-52.
- Cunha A.J., Melo B., Santos J.C.F. Fitossociologia de plantas daninhas em cafezal intercalado com leguminosas perenes. Cerrado Agroci. 2013;4:9-15.
- Fidalski J., Tormena C.A., Silva A.P. Qualidade física do solo em pomar de laranjeira no noroeste do Paraná com manejo da cobertura permanente na entrelinha. Rev Bras Cienc Solo. 2007;31:423-33.
- Fontana L.C. et al. Barley competitive ability in coexistence with black oat or wild radish. Científica. 2015;43:22-9.
- Harper J.L. Population biology of plants. London: Academic Press, 1977. 892p.
- Hernández L.R. et al. Sesquiterpene lactones and other constituents of Stevia maimarensis and Synedrellopsis grisebachii Phytochemestry. 1996;42:681-4.
- Jakelatis A. et al. Manejo de plantas daninhas no consórcio de milho com capim-braquiária (Brachiaria decumbens). Planta Daninha. 2004;22:553-60.
- Kissmann K.G., Groth D. Plantas infestantes e nocivas. São Paulo: Basf Brasileira, 1992. Tomo II. 789p.
- Moreira L.M. et al. Perfilhamento, acúmulo de forragem e composição bromatológica do capim-braquiária adubado com nitrogênio. Rev Bras Zootec. 2009;38:1675-84.
- Oliveira C.A.V.M. Fitossociologia da comunidade infestante de gramados de grama-batatais (Paspalum notatum Flügge) em praças de Jaboticabal, SP [dissertação]. Jaboticabal: Universidade Estadual “Júlio de Mesquita Filho”, 2011. 58p.
- Oliveira E. et al. Recuperação de pastagens no Noroeste do Paraná. Londrina: Instituto Agronômico do Paraná, 2000. 96p.
- Passini T., Christofoletti P.J., Yada I.F.U. Competitivity of the common-bean plant relative to the weed alexandergrass [Brachiaria plantaginea (Link) Hitch.]. Sci Agric. 2003;60:259-68.
- Radosevich S.R. Methods to study interactions among crops and weeds. Weed Technol. 1987;1:190-8.
- Santos B.M., Bewick T.A., Shilling D.G. Competitive interactions of tomato (Lycopersicum esculentum) and nutsedges (Cyperus spp.) Weed Sci. 1997:45:229-33.
- Souza L.S. et al. Efeito alelopático de capim-braquiária (Brachiaria decumbens) sobre o crescimento inicial de sete espécies de plantas cultivadas. Planta Daninha. 2006;24:657-68.
- Spitters C.J.T. An alternative approach to the analysis of mixed cropping experiments. 1. Estimation of competition effects. Nether J Agric Sci. 1983;31:1-11.
- Spitters C.J.T. On descriptive and mechanistic models for inter-plant competition, with particular reference to crop-weed interaction. In: Rabbinge R. et al. Theoretical production ecology: reflections and prospects. Wageningen: Pudoc, 1990. p.217-36. (Simulation monographs, 34).
- Yamauti M.S., Alves P.L.C.A., Carvalho L.B. Interações competitivas de triticale (Triticum turgidosecale) e nabiça (Raphanus raphanistrum) em função da população e proporção de plantas. Planta Daninha. 2011;29:129-35.
- Zanine A.M., Santos E.M. Competição entre espécies de plantas - Uma revisão. Rev FZVA. 2004;11:10-30.
Publication Dates
-
Publication in this collection
2018
History
-
Received
08 Mar 2015 -
Accepted
11 Nov 2016