
ABSTRACT:
In Field experiments, a logarithmic sprayer was used to screen the efficacy of 28.5% mixture of nicosulfuron and mesotrione, and the herbicides applied separately. Three adjuvants were also used to assess how they affected the potency of the mixture. The objectives were to test whether a mixture was enhancing or detracting the effect relative to ADM (Additive Dose Model). The test plants were canola and barley. The 28.5% nicosulfuron mixture was acting antagonistic, irrespective of plant species. The antagonistic effect of the nicosulfuron mixture decreased the more developed the plants became; for barley, it almost disappeared 40 days after treatment. For both canola and barley, one adjuvant stood out as being highly effective in decreasing ED50 of the mixture. Antagonism was not alarmingly high, which is found for many herbicides. Results are discussed in relation to the practice of testing mixtures in the literature and the requirements for getting mixture patents.
Keywords:
mixture models; Additive Dose Model (ADM); Multiplicative Survival Model (MSM); adjuvant effect
RESUMO:
Um pulverizador logarítmico foi utilizado para avaliar a eficácia da mistura de 28,5% de nicosulfuron e mesotrione, além da aplicação isolada de cada herbicida. O objetivo deste trabalho foi testar se a mistura é sinérgica ou antagônica, através do modelo ADM (Modelo Aditivo de Dose). As espécies usadas no estudo foram canola e cevada. A mistura de 28,5% de nicosulfuron agiu como antagonista, independentemente das espécies testadas. O efeito antagonista da mistura de nicosulfuron reduziu-se à medida que as plantas se desenvolviam; na cevada, o efeito quase desapareceu 40 dias após o tratamento. Tanto para a canola como para a cevada, um dos adjuvantes destacou-se como altamente eficaz na redução da ED50 da mistura herbicida. Ficou demonstrado que o antagonismo não é alarmantemente alto, o que está de acordo com o observado em muitos herbicidas. Os resultados são discutidos em relação à prática de ensaios de misturas na literatura e aos requisitos para obter patentes de mistura.
Palavras-chave:
modelos para testar misturas; modelo aditivo de dose (ADM); modelo multiplicativo de sobrevivência (MSM); efeito de adjuvantes
INTRODUCTION
More than forty years ago, Pfeiffer (1970Pfeiffer PK. Weed control in the 70s- industry contribution. In: Proceedings of the 10th British Weed Control Conference, 16th-19th November 1970, England. Brighton: 1970; p.58-71) pointed out that discovering new herbicides and emphasizing its many positive attributes, sooner or later one has to accept that these products, when used alone are unable to provide economic and reliable performance. The selection pressure by herbicides on weeds inevitably will make Nature adapt by changing species composition or eventually develop tolerant and resistant biotypes of weeds. (Beckie and Reboud, 2009Beckie HJ, Reboud X. Selecting for weed resistance: herbicide rotation and mixture. Weed Technol. 2009;23(3):363-70.; Duke, 2011Duke SO. Comparing conventional and biotechnology-based pest management. J Agric Food Chem. 2011;59:5793-8.; Barroso et al., 2014Barroso AAM, Albrecht AJP, Reis FC, Victoria Filho R. Accase and Glyphosate diferent formulations herbicides association interactions on sourgrass control. Planta Daninha. 2014;32(3):619-27.; Abbas et al., 2016Abbas T, Nadeem MA, Tanveer A, Ahmad R. Identifying optimum herbicide mixtures to manage and avoid fenoxaprop-p-ethyl resistant phalaris minor in wheat. Planta Daninha. 2016;34(4):787-93.). Particularly, for herbicides, the massive spraying with only a few herbicides, has initiated a quest for new combinations of herbicides. (Green et al., 1995Green JM, Bruhn JA, Baylis AD, Chapman PF. Commercially successful pesticide mixtures. Understanding crop protection mixtures. Conference; 1995; Bedford. Wellesbourne; 1995a. (Aspects of Applied Biology, 41:1-9).a).
Mixtures save numbers of sprayings and thus money for the end user. From a practical point of view, antagonism should be rather strong to pay for spraying twice with sole compounds instead of mixtures. However, mixtures of herbicide need not be sprayed at the same time; residual compounds in the soil can still interact with each other after being absorbed by plants. Mixtures can be patented, and the interest of finding commercially optimal ratios of various binary and multi-compound mixtures of herbicides is great because finding synergism, however little it is, seems to justify patents. In practice, finding synergism is rare when it comes to herbicide mixtures, and if it occurs, the synergism may not play an important role in saving compounds in practice (Streibig et al., 1998Streibig JC, Kudsk P, Jensen JE. A general joint action model for herbicide mixtures. Pest Sci 1998;53:21-7.).
Synergism, although highly desirable for patent purposes, also has some drawbacks. The herbicide selectivity window might change for the crops also, causing crop injuries.
The 28.5% mixture of nicosulfuron and mesotrione are supposed to be useful for weed control in corn (Nogueira and Correia, 2016Nogueira CHP, Correia NM. Selectivity of herbicides bentazon and nicosulfuron for crotalaria juncea intercropped with maize culture. Planta Daninha. 2016;34(4):747-57.; Abbas et al., 2016Abbas T, Nadeem MA, Tanveer A, Ahmad R. Identifying optimum herbicide mixtures to manage and avoid fenoxaprop-p-ethyl resistant phalaris minor in wheat. Planta Daninha. 2016;34(4):787-93.). Mesotrione is a triketone, which inhibits the enzyme 4-hydroxyphenolpyruvate dioxygenase (HPPD); it is used to selectively control weeds in maize (Pallett, 2000Pallett KE. The mode of action of isoxaflutole: a case study of an emerging target site. In: Cobb AH, Kirkwood RC. editors. Herbicides and their mechanisms of action. Sheffield: Sheffield Academic Press; 2000. p.213-38.). It provides both pre- and post-emergence control of important broad-leaved weeds and some annual grass weeds in maize. Among other things, it prevents carotenoid biosynthesis and causes white bleaching symptoms (Pallett, 2000).
Nicosulfuron controls many difficult to control broadleaf weeds (Green and Cahill, 2003Green JM, Cahill WR. Enhancing the biological activity of nicosulfuron with pH adjusters. Weed Technol. 2003;17:338-45.) as well as several difficult to control grass weeds in maize. Nicosulfuron is an ALS inhibitor and leads to a rapid cessation of plant cell division and growth (Brown and Kearney, 1991Brown HM, Kearney PC. Plant biochemistry, environmental properties and global impact of sulfonylurea herbicides. In: Baker DR, Fenyes JG, Moberg WK. editors. Synthesis and chemistry of agrochemicals II. Washington, DC: American Chemical Society; 1991. p.32-49. (ACS Symposium Series, 443)). Target weeds growth are retarded or inhibited within hours of foliar treatment, but physical symptoms in the field may take longer to develop (Brown and Kearney, 1991).
The objective of this paper is to illustrate how a logarithmic sprayer can be used to effectively investigate the effect of binary mixtures of mesotrione and nicosulfuron in field experiments and how effects of adjuvants can be measured on canola and barley.
MATERIALS AND METHODS
The field experiments were carried out at the experimental farm of University of Copenhagen (N 55o40’09.6", 12o18’16.3") on a sandy loam soil (75% sand, 20% clay, 15% silt). The species were Hordeum vulgare (variety “Tam Tam”) and Brassica napus (variety “Lyside”), sown on 22-04-2013 with a seed rate of 160 kg ha-1 and 5 kg ha-1, respectively. The preceding crop was winter-wheat. The field was fertilized with 365 kg ha-1 (NPKS 22-2-7-9). No other pesticides, but the herbicides, were applied. The species were chosen because of different phenology, leaf surface characteristics, selectivity profiles and ease of establishing a uniform emergence and density.
Each species was divided into six plots of 3 x 30 m, and each spraying had two replicates, which gave 12 plots of each species. Between each plot, there was an untreated control plot to aid comparison of visual assessment in treated and untreated plots. Besides, the untreated plots limited the risk of spray drift to neighboring plots. A net treated plot strip was 1.5 m wide and 30 m long and was in the middle of the 3 m wide gross plot.
We used a self-propelled logarithmic sprayer, with a boom width of 1.5 m and with four nozzles (Tind et al., 2009Tind T, Mathiesen TJ, Jensen JE, Ritz C, Streibig JC. Using a selectivity index to evaluate logarithmic spraying in grass seed crops. Pest Manag Sci. 2009;65(11):1257-62.). The maximum field dose of the stock solution of nicosulfuron applied alone was 120 g a.i. ha-1, and for mesotrione applied alone it was 300 g a.i. ha-1. The maximum dose for the 28.5% nicosulfuron mixture was 420 g a.i. ha-1 (120 g nicosulfuron + 300 g mesotrione ha-1). When the logarithmic sprayer traveled along the strip, the stock solution was exponentially diluted with water, or for the adjuvant experiment by the respective adjuvant solutions. The principle of the logarithmic dilution is found elsewhere (Pfeiffer et al., 1955Pfeiffer R, Brunskill RT, Hartley GS. Variable dosage sprayer for agricultural experiments. Nature. 1955;176:472-3. ). By using the speed of the sprayer and the spray yield of the nozzles (l sec-1), one can calculate the logarithmic dilution of the spray in time or in meters. Consequently, at any one distance from the onset of spraying, we can calculate a dose ha-1. We assessed the effect of the spray at 0, 5, 10, 15, 20, 25 and 30 m on either side of the various meter settings. Total spray volume was 150 L ha-1. On the day of application, the weather was partly cloudy with little wind (2.2 m s-1), dry crops, no rain incidence until 24 hours after treatment, and a temperature of 12 oC. The plots were sprayed the 24-5-2013 with the herbicides, which were suspension concentrates formulations. Nicosulfuron and mesotrione were applied alone and in a 28.5% nicosulfuron and mesotrione mixture.
For the adjuvant experiments, a 28.5% nicosulfuron and mesotrione mixture was sprayed with a constant concentration of adjuvants in the spray solution. Fortune® contains 75% w/w mixed fatty acid esters of seed oil and n-butanol. It is a propriety mix of methylated seed oil (75% w/w) surfactants and co-solvents. It is an emulsifiable spray adjuvant specially formulated to enhance wetting, spreading and penetration of herbicides. Fortune works equally well with oil-based and water-based formulations due to its special emulsifier system and is ideally suited for use in multi-product tank mixes with 0.5% of total spray volume. Intake® contains 40% w/w propionic acid mix of organic acids and surfactant. It is an agricultural wetting agent specially formulated for inclusion in tank mixes with a wide range of foliar applied herbicides. It may also be used as an acidifier to optimize pH when water used for spraying is alkaline with 0.5% of spray volume. Guard® contains a 10% w/w styrene/butadiene copolymer and is an organic copolymer/biodegradable surfactant blend, which has sticker/extender properties to avoid herbicide performance be adversely affected by unfavorable weather or crop growing conditions. Guard provides rain fastness, improves foliar cover and improves foliar retention of spray. The dose rate was 0.1% of total spray volume.
The experimental design was a so-called ray design where each dose-response curve represents fixed mixture ratios, and the isoboles are the contours of the response curves at any response levels of interest (Berenbaum, 1981Berenbaum MC. The expected effect of a combination of agents: the general sulution. J Theor Biol. 1981;114(3):3-31.; Gessner, 1995Gessner PK. Isobolographic analysis of interactions: an update on applications and utility. Toxicology. 1995;105(2-3):161-79.).
Statistical analyses
The response, y, is described by a log-logistic dose-response curve (Ritz, 2010Ritz C. Toward a unified approach to dose-response modeling in ecotoxicology. Environ Toxicol Chem. 2010;29:220-9.) of the dose, x, or the sum of doses of the two herbicides in a 28.5% nicosulfuron mixture:
The upper limit, d, is a parameter close to the untreated control. The ED50 denotes the dose that halves the response d/2. The relative slope, b, is around the ED50. The log-logistic model is just one of numerous sigmoid models that can be used. The distribution of residuals and the fit themselves were used to assess the quality of the regressions with the add on drc package (Version 3.0-1) (Ritz et al., 2015Ritz C, Edwards TL, Gaë D, Payne AJ, Vincent P, Hindmarsh RCA. Potential sea-level rise from Antarctic ice-sheet instability constrained by observations. Nature. 2015;528:115-8.) of the open source program R (version 3.3.1, 2016-06-21).
The reference model
There are numerous reference models to compare the effect of mixtures (Greco et al., 1995Greco WR, Bravo G, Parsons JC. The search for synergy - a critical-review from a response-surface perspective. Pharmacol Rev. 1995;47(2):331-85.). However, the Additive Dose Model (ADM) answers the question raised by many end users. “Which mixture ratios of two herbicides could I use without gaining or losing effects relative to the effect of the compounds administrated separately?” Figure 1 illustrates the answer to this question. The reference model assumes that two herbicides have the same mode/site of action and do not interfere with each other’s action. Also, when mixture ratio approaches zero, the dose-response curve reverts to the pure herbicides.

Dose-response curves for herbicide A and B applied separately (full and broken lines), and a 33% mixture of A and B dotted line C.
A straight line isobole in Figure 1B is derived from the two herbicides administered separately in Figure 1A and represents the ADM reference model for a preset effect level, say ED50. The isobole defines all possible combinations of the two herbicides that yield the same response (Figure 1B). The isobole is a contour line at a specific response level that illustrates all combinations of two herbicides giving the same response in a plant.
The response curves in Figure 1A represent one of the numerous scenarios. The ED50 for herbicide A is one unit, and for herbicide B it is five units (Figure 1B). In this instance, the perceived mixture ratio dose-response curve, C, would be 0.5 units of A and 2.5 units of B (Figure 1B). The mixture dose-response is not half way between the two curves for the herbicides applied separately (A and B) because of the relative potency of five (Equation 2) between the single herbicides are not 1. Therefore, the isobole point with a 50% mixtures of A and B would be displaced to the upper half of the isobole. Accordingly, the use of the term additive in ADM is not based on the sheer size of doses but is based on the relative potencies Equation 2 of the pure herbicides ZA and ZB, which in this case is five at ED50.
The real mixture half way between herbicide A and B in Figure 1B would be 33% (0.5/(2.5+0.5)*100) of herbicide A because herbicide A is five times as potent as is herbicide B at ED50. The relative potency, r, denotes the relative displacement on the dose axis of the two response curve for the herbicide applied separately. The ADM isobole can be define at any response level by the relationships below.
where ZA and ZB are doses of the pure herbicides, and zA and zB are the doses of the herbicide mixture (zmix=zA+zB). The exponents λA and λB could be the same or different. If they are the same we get a symmetric isobole, if they are different from each other they are asymmetric, and if they are equal to 1.0 the isobole follows ADM.
With ADM the herbicides can be considered a dilution of each other and the herbicides do not compete at the binding site. It can mathematically be expressed by
where p is the proportion of either of the herbicides in a mixture, and zmix is their sum. A zmix dose can be expressed unambiguously by a biologically equivalent dose of either of the herbicides applied alone (Equation 4). This applies to any dose-response relationship if the response curves are either monotonically decreasing or increasing. If we have similar dose-response curves, i.e., all parameters are similar except for the ED50 of the herbicides administered separately, then ADM can be incorporated into a dose-response model if mixtures are in a fixed ratio (Green et al., 1995Green JM, Bruhn JA, Baylis AD, Chapman PF. Commercially successful pesticide mixtures. Understanding crop protection mixtures. Conference; 1995; Bedford. Wellesbourne; 1995a. (Aspects of Applied Biology, 41:1-9).a and bGreen JM, Jensen JE, Streibig JC. Models to assess joint action of pesticide mixtures. Asp Appl Biol. 1995b;41:61-8.; Streibig et al., 1998Streibig JC, Kudsk P, Jensen JE. A general joint action model for herbicide mixtures. Pest Sci 1998;53:21-7.).
If the dose-response curves for herbicides administered separately are not similar, the isoboles at various EDx levels would have different slopes, because the relative potency, r, in Equation 2 changes with response levels (Ritz et al., 2006Ritz C, Cedergreen N, Jensen JE, Streibig JC. Relative potency in nonsimilar dose-response curves. Weed Sci. 2006;54(3):407-12.). At any response level, the isoboles are still almost straight lines, but their slopes change with the EDx level.
We usually work with whole plants and not isolated target enzymes, and one could argue that affecting the same response would suffice, thus reducing all herbicides to having the same mode of action if the effect is growth of a plant. The mere definitions of site and mode of action are equivocal, as it is dose dependent (Fedtke, 1982Fedtke C. Biochemistry and hhysiology of herbicide action. Berlin: Springer-Verlag; 1982.). Any departure from the ADM reference model can be defined as either synergistic (convex curve) or antagonistic effects (concave curve) (Figure 1B).
The Multiplicative Survival Model (MSM) also requires dose-response curves for two pesticides administered separately, MSM is for binomial responses (dead or alive, affected not affected) and not continuous responses (Hewlett and Plackett, 1979Hewlett PS, Plackett RL. An introduction to the interpretation of quantal responses in biology. London: Edward Arnold; 1979.). It fits perfectly into the mortality of insects in response to dose. In weed science, the response is often continuous, e.g., biomass or height. Therefore, use of MSM can only be considered an approximation in those situations (Morse, 1978Morse PM. Some comments on the assessment of joint action in herbicide mixtures. Weed Sci. 1978;26:58-71.). Factorial analysis of variance is used to find MSM synergism or antagonism at specific mixture dose combinations. It is the opinion of the authors that this way of illustrating MSM does not result in a useful recommendation for the end user of mixtures, but is accepted as proof of synergism in the US patent office (Richer, 1987Richer DL. Synergism - a patent view. Pest Sci. 1987;19:309-15.; Man et al., 2014Man RK, Masters RA, Mcmasters SPM, Amela MS, Wright TR. Synergistic herbicidal weed control from combinations of 2,4D-choline and glyphosat. Patent [US2015/0173371A1]. 2014. ; Hacker et al., 2017Hacker E, Bieringer H, Huff HP. Herbicide combinations comprising specific sulfonyureas. Patent [US2017/0042157 A1]. 2017;1-19 ).
RESULTS AND DISCUSSIONS
For all the dose-response curves, regression parameters were all significantly different from zero (<5% level), and the variation of essential parameters (ED50) in the Figures is given with their 95% confidence intervals.
Mixture and canola
In Figure 2, the distribution of responses was fairly uniform at 10 Days After Treatment (DAT). At 17 DAT the lower part of the nicosulfuron curve was not supported by responses and the same applies to the visual assessment at 25 DAT (data not shown). At 40 DAT the 28.5% nicosulfuron mixture dose-response curve of height was between the curves for the herbicides applied separately, but the mixture performed poorer than expected in relation to ADM. At all DAT (Figure 2) the antagonism was obvious by looking at the efficacy of the mixture (Figure 2A, B, C) in relation to the ADM isobole (Figure 2D, E, F). At 10 DAT the mixture was situated in the middle of the isobole (Figure 2D) as at 17 DAT, but not for height at 40 DAT (Figure 2F). Although antagonism was obvious, the antagonistic mixture was only about 1.17-fold less efficacious as would be a mixture that would follow ADM (the ratio between the distance OD/OE) (Figure 2F). Not a large and important difference, giving the uncertainty of the actual dose when sprayed with a tractor or aircraft. How the mixture would behave on mixed weed populations cannot be answered, as the selectivity windows probably would change depending on the sensitivity/tolerance of the weed flora species as well as the composition of the weed flora itself.
Mixture and Barley
Barley is tolerant to mesotrione, so only the 28.5% nicosulfuron and the pure nicosulfuron dose response curves can be compared (Figure 3). Although mesotrione did not affect barley, it did antagonize the effect of nicosulfuron. Figure 3 illustrated that EDx is a relative parameter Equation 1. The upper limits, d, were not the same, and ED50 had different value at the y-axis (Figure 3A, B). It is as if the mixture gradually approached the upper limit of 100 at 34 DAT (Figure 3C). The same applied when the endpoint was plant height. However, the difference in ED50 was marginal (Figure 3D). At harvest, the antagonistic effect might have disappeared for the yield of barley (not measured). Apart from the 17 DAT, the ED50s for the 28.5% mixture at any other DATs were significantly larger than for nicosulfuron applied alone.

Dose response curves for mesotrione applied separately and a 28.5% nicosulfuron mixture with mesotrione.
Effects of adjuvant on mixture efficacy
Canola
The adjuvants were assumed to be biologically inert in their constant concentration in the spray solution. Therefore, any departure of the dose-response curves of the 28.5% nicosulfuron mixture from each other was due to the synergistic or antagonistic effect of the adjuvant in the mixture. Figure 4 showed that Fortune in all instances was the most potent combination when using visual phytotoxicity endpoints at all DAT (Figure 4A, B, C). Interestingly, there was no difference between the Guard and Intake adjuvants, but the Fortune made the 28.5% nicosulfuron mixture so potent that the dose-response could not be fitted; because any doses of 28.5% nicosulfuron killed all plants.

Fortune was significantly increasing the mixture potency in the course of time and ended up by yielding a nine-fold more potent 28.5% nicosulfuron mixture relative to the that the dose-response curve without adjuvant (Figure 5). It is linked to the assessment of plant height 40 DAT in Figure 4, where the dose-range for the mixtures with Fortune could not be fitted because even low doses killed the plants. Apparently, the Fortune adjuvant was indeed effective in boosting the potency of the herbicide mixture. There were no differences between the other ED50s for no adjuvant, (51 ± 2.69), Intake (53 ± 3.1), and Guard (48 ± 2.5) at 25 DAT (Figure 5).

Potency of the mixture and adjuvant combinations on canola at various days after treatment.
Barley
In Figure 6, the dose response trends looked almost the same as for barley mixtures in Figure 3. 17 DAT the visual phytotoxic assessment had different upper limits (Figure 6A) as did the dose-response curves for the mixture experiment (Figure 3A). Only the Fortune adjuvant promoted maximum effect (Figure 6B, C). In all instances, Fortune was the best adjuvant whether the endpoint was a visual assessment or plant height (Figures 6C). Already at 34 DAT, the effect of 100 was met for all adjuvant herbicide mixtures, and Fortune was clearly increasing the maximum phytotoxicity.

Dose-response curves for barley and adjuvants mixed with the 28.5% nicosulfuron herbicide mixture.
While the distribution of responses was well spaced on the response axis, to begin with, later on, the observation were not evenly distributed for Fortune at 40 DAT (Figure 6C). Obviously, Fortune constantly improved the 28.5% nicosulfuron mixture potency in the course of time, and the same applies to the other adjuvants, but not to the same extend. For the endpoint barley height, only Fortune stood out as the best at 40 DAT, and with no obvious differences among the other adjuvants. For visual assessment, Fortunes did it somewhat better (Figure 7) relative to the spray with no adjuvants. Fortune increased the potency almost twice from 50 a.i. ha-1 to 27 g a.i. ha-1, but not to the same extend as for canola (Figure 5).

The use of a logarithmic sprayer is an effective way of screening for the effect of mixtures of herbicides and effect of adjuvants. One can easily cover the whole dose-response curve by prior knowledge of the potencies of the herbicides applied separately. In all instances, the 28.5% nicosulfuron mixtures were acting antagonistically. When spraying mesotrione tolerant barley with the mixture, the mesotrione antagonized nicosulfuron. The antagonistic effect, however, seemed to become less the more developed the plants became. For barley, it almost disappeared when looking at the height endpoint. The reason for this antagonism could be that the increased level of Reactive Oxygen Species (ROS), released by the mesotrione, may block the inhibitory effect of nicosulfuron on ALS (Cobb, 1992Cobb AH. Herbicides and plant physiology. London: Chapman & Hal; 1992.).
The magnitude of either synergism or antagonism is not very often discussed (Cedergreen, 2014Cedergreen N. Quantifying synergy: a systematic review of mixture toxicity studies within environmental toxicology. Plos One. 2014; 9(5): e96580.). We showed that the antagonism was not alarmingly high. It is in accordance with the finding for many herbicides; one can find a small synergism or antagonism when testing on a single species (Cedergreen, 2014; Matzenbacher et al., 2015Matzenbacher FO, Kalsing A, Dalazen G, Markus C, Merotto Jr A. Antagonism is the predominant effect of herbicide mixtures used for imidazolinone-resistant barnyardgrass (Echinochloa Crus-Galli) control. Planta Daninha. 2015;33(3):587-97.). The illustration of the joint action of the herbicides and the herbicide mixtures assess the magnitude of the departure from the ADM isobole. It is in contrast to the way the MSM often is used in the weed science literature.
Even though an antagonism appeared to begin with, at the end of the assessment, we demonstrated that the mixture with 28,5% nicosulfuron reached satisfactory control levels compared to nicosulfuron and mesotrione applied alone. The only difference was the speed of this control; mixture took more days to reach a satisfactory level of control for both test species. For both Canola and barley, the adjuvant, Fortune, stood out as being effective in decreasing the ED50 of the herbicide mixture.
Very rarely mixtures are tested on difficult to control weed floras in the field because the uncertainties will dramatically increase. Given the uncertainties in spraying with a tractor or aircraft, the antagonism found in this paper was not alarming from a practical point of view.
ACKNOWLEDGEMENT
The project was partly financed by Cheminova A/S during the development of mixtures in maize.
REFERENCES
- Abbas T, Nadeem MA, Tanveer A, Ahmad R. Identifying optimum herbicide mixtures to manage and avoid fenoxaprop-p-ethyl resistant phalaris minor in wheat. Planta Daninha. 2016;34(4):787-93.
- Barroso AAM, Albrecht AJP, Reis FC, Victoria Filho R. Accase and Glyphosate diferent formulations herbicides association interactions on sourgrass control. Planta Daninha. 2014;32(3):619-27.
- Beckie HJ, Reboud X. Selecting for weed resistance: herbicide rotation and mixture. Weed Technol. 2009;23(3):363-70.
- Berenbaum MC. The expected effect of a combination of agents: the general sulution. J Theor Biol. 1981;114(3):3-31.
- Brown HM, Kearney PC. Plant biochemistry, environmental properties and global impact of sulfonylurea herbicides. In: Baker DR, Fenyes JG, Moberg WK. editors. Synthesis and chemistry of agrochemicals II. Washington, DC: American Chemical Society; 1991. p.32-49. (ACS Symposium Series, 443)
- Cedergreen N. Quantifying synergy: a systematic review of mixture toxicity studies within environmental toxicology. Plos One. 2014; 9(5): e96580.
- Cobb AH. Herbicides and plant physiology. London: Chapman & Hal; 1992.
- Duke SO. Comparing conventional and biotechnology-based pest management. J Agric Food Chem. 2011;59:5793-8.
- Fedtke C. Biochemistry and hhysiology of herbicide action. Berlin: Springer-Verlag; 1982.
- Gessner PK. Isobolographic analysis of interactions: an update on applications and utility. Toxicology. 1995;105(2-3):161-79.
- Greco WR, Bravo G, Parsons JC. The search for synergy - a critical-review from a response-surface perspective. Pharmacol Rev. 1995;47(2):331-85.
- Green JM, Bruhn JA, Baylis AD, Chapman PF. Commercially successful pesticide mixtures. Understanding crop protection mixtures. Conference; 1995; Bedford. Wellesbourne; 1995a. (Aspects of Applied Biology, 41:1-9).
- Green JM, Cahill WR. Enhancing the biological activity of nicosulfuron with pH adjusters. Weed Technol. 2003;17:338-45.
- Green JM, Jensen JE, Streibig JC. Models to assess joint action of pesticide mixtures. Asp Appl Biol. 1995b;41:61-8.
- Hacker E, Bieringer H, Huff HP. Herbicide combinations comprising specific sulfonyureas. Patent [US2017/0042157 A1]. 2017;1-19
- Hewlett PS, Plackett RL. An introduction to the interpretation of quantal responses in biology. London: Edward Arnold; 1979.
- Man RK, Masters RA, Mcmasters SPM, Amela MS, Wright TR. Synergistic herbicidal weed control from combinations of 2,4D-choline and glyphosat. Patent [US2015/0173371A1]. 2014.
- Matzenbacher FO, Kalsing A, Dalazen G, Markus C, Merotto Jr A. Antagonism is the predominant effect of herbicide mixtures used for imidazolinone-resistant barnyardgrass (Echinochloa Crus-Galli) control. Planta Daninha. 2015;33(3):587-97.
- Morse PM. Some comments on the assessment of joint action in herbicide mixtures. Weed Sci. 1978;26:58-71.
- Nogueira CHP, Correia NM. Selectivity of herbicides bentazon and nicosulfuron for crotalaria juncea intercropped with maize culture. Planta Daninha. 2016;34(4):747-57.
- Pallett KE. The mode of action of isoxaflutole: a case study of an emerging target site. In: Cobb AH, Kirkwood RC. editors. Herbicides and their mechanisms of action. Sheffield: Sheffield Academic Press; 2000. p.213-38.
- Pfeiffer PK. Weed control in the 70s- industry contribution. In: Proceedings of the 10th British Weed Control Conference, 16th-19th November 1970, England. Brighton: 1970; p.58-71
- Pfeiffer R, Brunskill RT, Hartley GS. Variable dosage sprayer for agricultural experiments. Nature. 1955;176:472-3.
- Ritz C, Edwards TL, Gaë D, Payne AJ, Vincent P, Hindmarsh RCA. Potential sea-level rise from Antarctic ice-sheet instability constrained by observations. Nature. 2015;528:115-8.
- Richer DL. Synergism - a patent view. Pest Sci. 1987;19:309-15.
- Ritz C. Toward a unified approach to dose-response modeling in ecotoxicology. Environ Toxicol Chem. 2010;29:220-9.
- Ritz C, Cedergreen N, Jensen JE, Streibig JC. Relative potency in nonsimilar dose-response curves. Weed Sci. 2006;54(3):407-12.
- Streibig JC, Kudsk P, Jensen JE. A general joint action model for herbicide mixtures. Pest Sci 1998;53:21-7.
- Tind T, Mathiesen TJ, Jensen JE, Ritz C, Streibig JC. Using a selectivity index to evaluate logarithmic spraying in grass seed crops. Pest Manag Sci. 2009;65(11):1257-62.
Publication Dates
-
Publication in this collection
2018
History
-
Received
04 July 2017 -
Accepted
06 Sept 2017

 The ED50 of A, B, and C were 1, 5, and 3 dose units, respectively. The 33% mixture was in the middle of the ADM Isobole (A), because the relative potency of the herbicides applied separately was 5 (5/1), the real 50% mixture is displaced to the upper part of the isobole (B). If the mixture did not follow the ADM, they would be on either side of the straight line Isobole.
 Note the axes of the Isoboles are adjusted to the ED50 of the pure herbicides and the mixture. For the height endpoint at 40DAT, (F), the 28.5 % mixture was 1.17 fold weaker than if it followed ADM (0D/0E). The 95% confidence intervals of the ED50s are the full lines at all points.
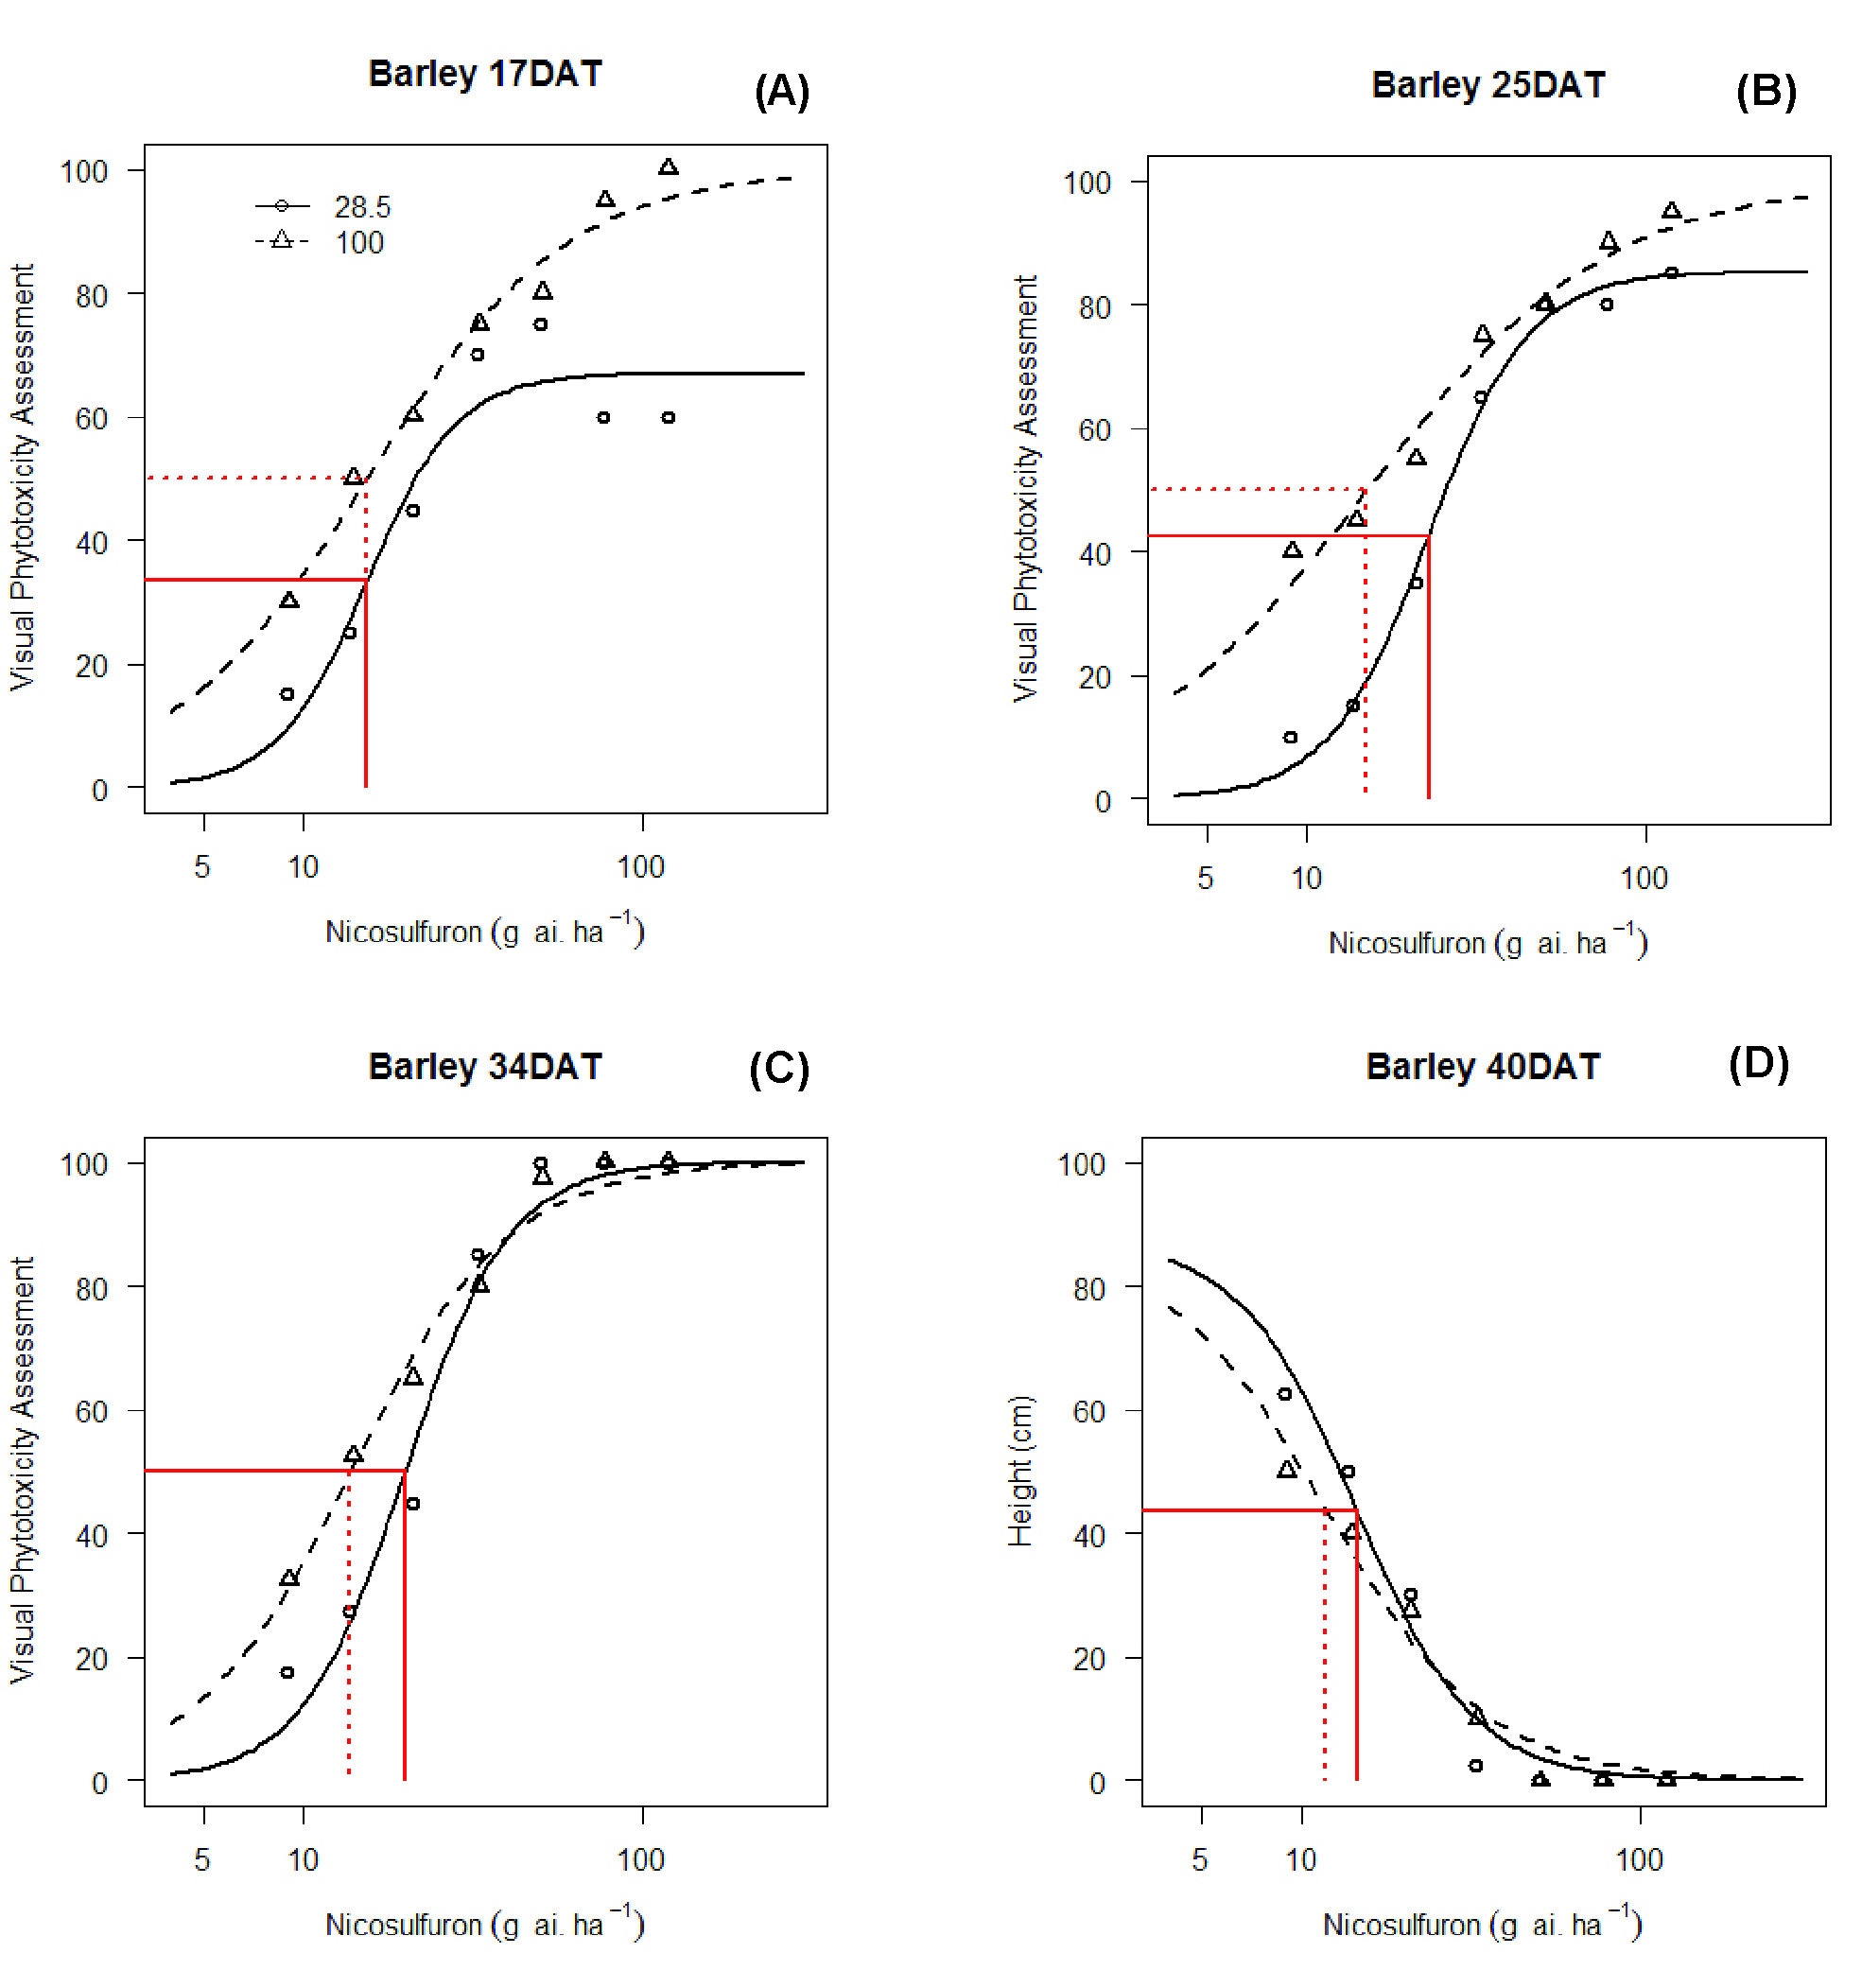 The ED50s are shown in all plots for the two dose-response curves.
 For plant height, the mixture with the adjuvant, Fortune could not be used because, at all doses the height was zero, it meant complete kill.
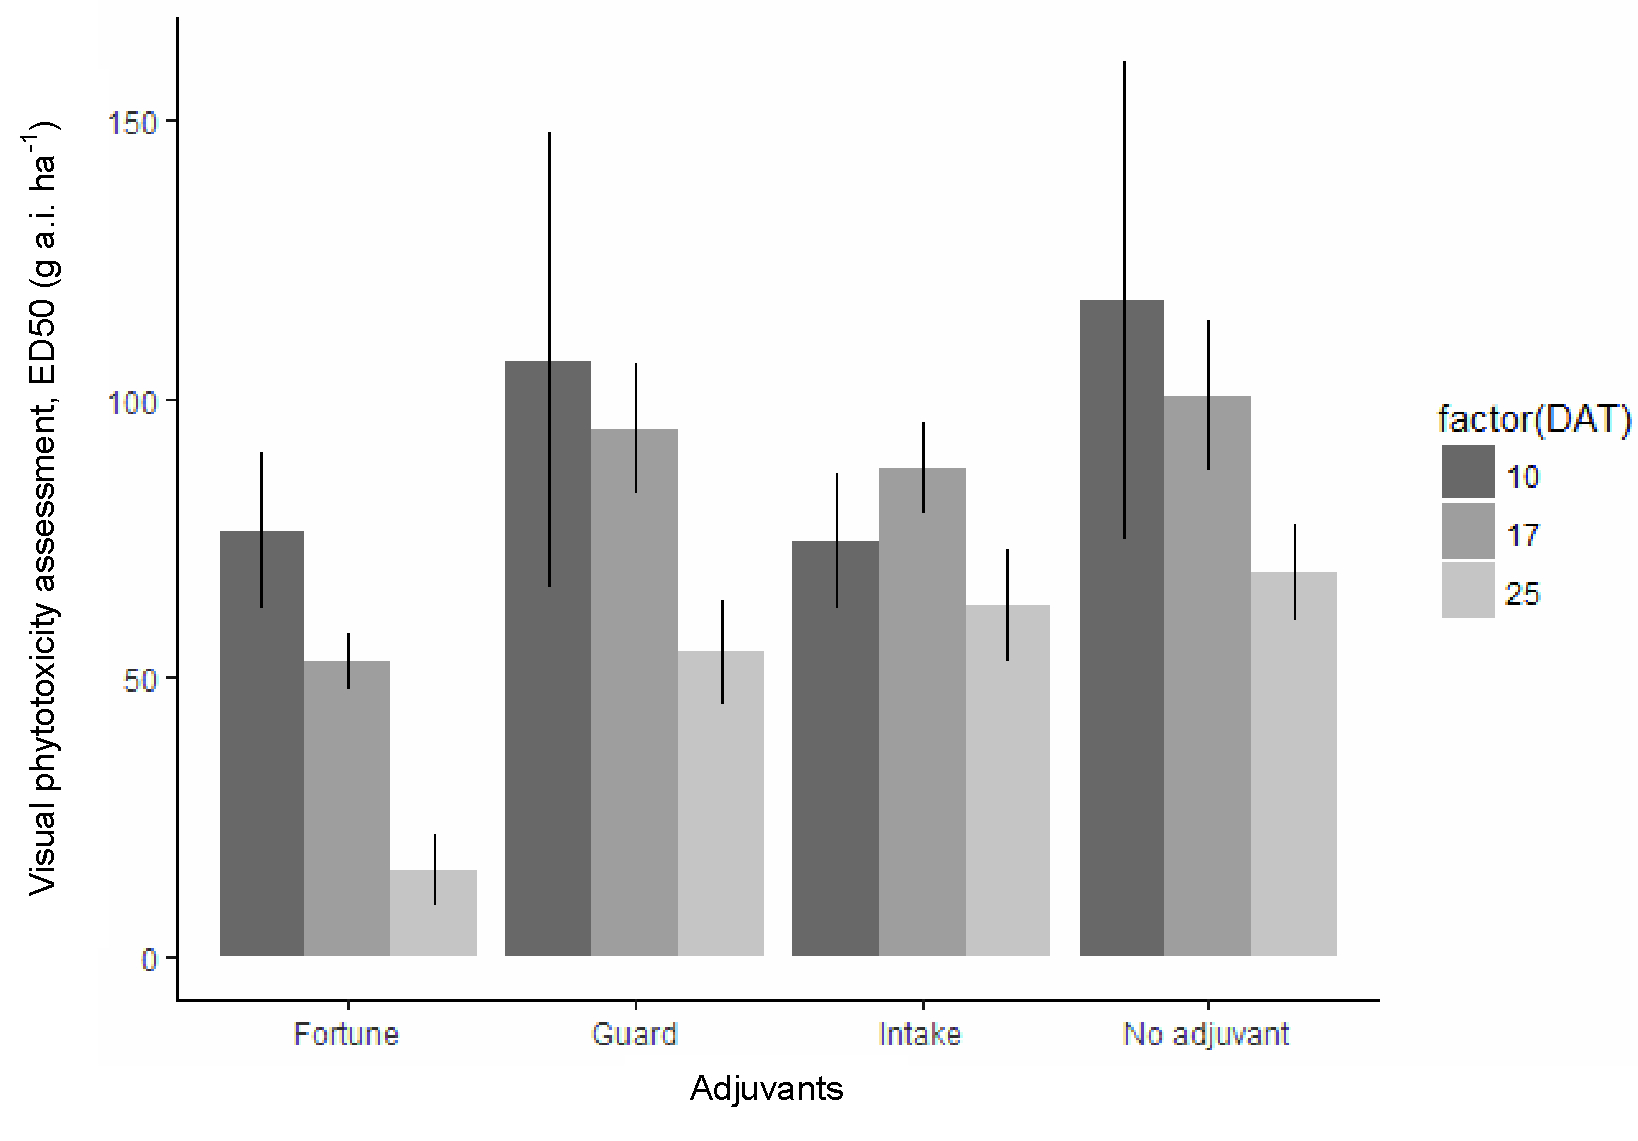 The 95% confidence intervals are vertical lines.

 The 95% confidence intervals are vertical lines.