Abstract
Alcohol is part of the history of humanity, seemingly as a result of countless factors including the easy production of alcoholic beverages in practically all regions of the world. The authors studied aspects of the use of and the dependence on alcohol in Brazil, through a household survey conducted by Centro Brasileiro de Informações sobre Drogas Psicotrópicas (CEBRID). A total of 8,589 interviews were held in 107 of the largest cities in Brazil, all of them with more than 200 thousand inhabitants. The study was planned to gather information within the household environment about a stratified probabilistic sample obtained in three selection phases: 1) the censitaire sectors for each municipality, 2) a systematic randomized sampling, and 3) drafting a respondent by lot in each household to provide information. Approximately 11.2% of the subjects were concerned with their own consumption of alcohol. The signs/symptoms of the syndrome of dependence evident in a greater percentage were the desire to stop or reduce the use of alcohol and to stop or reduce resorting to alcoholic beverages more often than desired, as reported by 14.5 and 9.4% of the respondents, respectively. The regions in Brazil with the highest percentage of dependents were the North (16.3%) and the Northeast (19.9%). According to the estimates obtained in the survey, 5.2% of the teenagers were concerned about the use of alcohol. The estimates obtained in this survey reveal a need to implant specific preventive programs for the problem of alcohol, especially for the very young.
Alcohol; Household survey; Dependence; Brazil
Braz J Med Biol Res, March 2007, Volume 40(3) 367-375
Use of alcohol among the inhabitants of the 107 largest cities in Brazil - 2001
 Correspondence and Footnotes
 J.C.F. Galduróz and E.A. Carlini
Centro Brasileiro de Informações sobre Drogas Psicotrópicas, Departamento de Psicobiologia, Universidade Federal de São Paulo, São Paulo, SP, Brasil
 Correspondence and Footnotes
Correspondence and Footnotes
Correspondence and Footnotes
Correspondence and Footnotes
Correspondence and Footnotes
Abstract
Alcohol is part of the history of humanity, seemingly as a result of countless factors including the easy production of alcoholic beverages in practically all regions of the world. The authors studied aspects of the use of and the dependence on alcohol in Brazil, through a household survey conducted by Centro Brasileiro de Informações sobre Drogas Psicotrópicas (CEBRID). A total of 8,589 interviews were held in 107 of the largest cities in Brazil, all of them with more than 200 thousand inhabitants. The study was planned to gather information within the household environment about a stratified probabilistic sample obtained in three selection phases: 1) the censitaire sectors for each municipality, 2) a systematic randomized sampling, and 3) drafting a respondent by lot in each household to provide information. Approximately 11.2% of the subjects were concerned with their own consumption of alcohol. The signs/symptoms of the syndrome of dependence evident in a greater percentage were the desire to stop or reduce the use of alcohol and to stop or reduce resorting to alcoholic beverages more often than desired, as reported by 14.5 and 9.4% of the respondents, respectively. The regions in Brazil with the highest percentage of dependents were the North (16.3%) and the Northeast (19.9%). According to the estimates obtained in the survey, 5.2% of the teenagers were concerned about the use of alcohol. The estimates obtained in this survey reveal a need to implant specific preventive programs for the problem of alcohol, especially for the very young.
Key words: Alcohol, Household survey, Dependence, Brazil
Introduction
Alcohol is part of the history of humanity, seemingly as a result of countless factors among which the ease with which alcoholic beverages are produced in practically all of the regions of the world; moreover, the effects of consumption contribute to the use of alcohol in different contexts (1).
Brazil, the largest country in Latin America, with a territory of 8,500,000 km2 and with a population of 174,200,000 inhabitants according to the 2000 census (2), was colonized by Portugal starting in the 16th century. Approximately 5 to 7 million Indians lived in the country at that time, with intense miscegenation occurring between Portuguese and Indians, especially in the North and Northeast. At first the Indians were enslaved; however, since they did not adapt to slave work, the use of black Africans as slaves became the rule. From the beginning of the 18th century, slave traffic to Brazil became intense, mainly in the Northeast, so much so that, at the end of the century, in the State of Bahia (the Northeast) the proportion of black/white inhabitants was of 4/1. The 19th and early 20th centuries saw great waves of European immigrants: Germans and Italians in the states of the South; Italians, Spaniards, and other European nationalities in the Southeast.
In Northern Brazil, exploitation of the rich biodiversity of the Amazon region was always the mainstay of the economy. The Northeast is fundamentally agricultural, with sugarcane as the main crop; agribusiness (cattle and soybean) predominates in the Midwest with industrial and agricultural activities in the Southeast and South.
The use of alcoholic beverages in Brazil dates back to before the arrival of the Portuguese navigators: the Brazilian Indians used cauim, an alcoholic beverage obtained by fermenting maize. Because sugarcane was readily available, "cachaça or pinga", a distillate containing 40 to 48% ethyl alcohol, became extremely popular from the start of the Portuguese colonization.
However, the real magnitude of the consumption of alcohol in Brazil has been little investigated, although some studies have shown the outstanding role of alcoholic beverages in the country as, beyond any doubt, the psychotropic substance most consumed and responsible for the highest indices of problems subsequent to its use. As an example, in three urban areas in Brazil (Brasília, São Paulo, and Porto Alegre) the prevalence of abuse of/dependence on alcohol ranged from 7.6% (in São Paulo) to 9.2% (in Porto Alegre) among the adult population, at a proportion of some 15 men to every woman (3). Another survey involving four Brazilian capitals (Salvador, Recife, Brasília, and Curitiba) showed that 27.2% of 865 victims of traffic accidents presented alcoholemia higher than 0.6 g/L - the limit permitted today by the National Traffic Code (4). Also, alcohol was responsible for approximately 90% of the hospitalizations that occurred in Brazil due to dependence/psychosis produced by psychotropic substances over the course of 12 consecutive years (1988-1999), with a predominance of men (some 15 men to every woman), 83% of them older than 30 years (5).
Furthermore, consumption of alcoholic beverages is not restricted to the adult population but also occurs among Brazilian adolescents, with a prevalence of heavy alcohol users (defined as use of twenty times or more in the month prior to the study) estimated in the ten largest cities in the country (6-9) ranging from 5.1% in Belém to 10.1% in São Paulo. Other data on the use of alcohol available in the country refer to specific studies conducted, for example, on students (10) and street children (11). To implement adequate prevention programs regarding the use of psychotropic drugs within a particular population, it is necessary, above all, to understand the actual state of this consumption (12).
The purpose of the present study was to determine the prevalence of lifetime use of alcohol in the population in general and to estimate the number of persons concerned with their own consumption. Furthermore, given the great sociocultural, ethnical, and economic differences between the five geographical macroregions of Brazil (North, Northeast, Midwest, Southeast, and South) a comparison was made in terms of alcohol consumption and consequences between the two macroregions that presented the most disparate values. The results presented in this paper are derived from the I Household Survey carried through for the CEBRID (13).
Material and Methods
A total of 107 cities with more than 200 thousand inhabitants were studied. The study was planned to gather information within the household environment through a three-stage sampling procedure: first, in each sampling city, the censitaire sectors were selected at random; the second stage consisted of a systematic randomized sampling using a sample interval in order to obtain 24 households; in the third stage, a respondent was drafted in each household to provide information concerning himself. The methodology applied in this study is similar to that used in the study by the Research Triangle Institute (Substance Abuse and Mental Health Services Administration, SAMHSA) (14).
A censitaire sector (with 200 to 300 homes) is the smallest unit for which the Brazilian Institute of Geography and Statistics supplies socioeconomic information (2). This information was used to define by multivariate statistical techniques homogeneous groups named strata in each city, to ensure precision of the estimates with relatively small samples. The number of sectors ranged from 1 to 60 depending on the population of the city, and the number of homes researched in each sector was fixed a priori at 24. Homes were selected in a systematic way, with a random start, with the sample thus being close to a simple random sample. All of the interviewers were told that, they should not include shops, hospitals, factories, hostels, hotels, etc. in their counts. In the case of apartment buildings, each apartment would be the equivalent of a home.
The selection of the respondent in each home was random, independent of the interviewer, so as not to always interview the person that was at home at the time of the interview, which would alter an equal chance for all possible respondents in the home (13,15).
The selection of the individual to be interviewed in each residence was determined by random criteria. After three failed attempts to locate the target interviewee, or whenever one of the following occurred: total refusal, physical or mental impairment, obstruction by a family member, or inability to comply due to a trip, hospitalization or inappropriate schedule considering the safety of the interviewer, a substitute with an equivalent socioeconomic profile, of the same gender and age group and living in the same census sector was selected.
Only persons aged 12 to 65 years were drawn by lot. The index of persons drawn who refused to give an interview was 9.3%. Refusals occurred primarily in homes located in more privileged socioeconomic regions. Interviews in shantytowns took place after prior contact with the Residents' Association in each shantytown, with someone appointed by the Association to accompany the interviewer. The interviewers had no problems with the field research in any sector.
The interviewers were trained in order to standardize the procedures used to approach both the homes and those interviewed and were also specifically trained in the execution of the interview, with knowledge concerning the questionnaire and psychotropic drugs. They were instructed to interview the person whose name was drawn, in a place as isolated as possible in order to ensure freedom and privacy of the person interviewed.
The questionnaire used was that of the SAMHSA (16) translated and adapted to Brazilian conditions. Basically, the questionnaire consists of 6 parts: the first contains the explanation of the research in addition to details as to how a person should be drawn by lot to participate in the study. The second part refers to the sociodemographic data of the person interviewed such as age, gender, and ethnic background. The third part of the questionnaire contained a "screening" of lifetime use of different psychotropic drugs as well as anabolizing steroids. If the response was positive for some drugs, the interviewer moved on to the page indicated to obtain more in-depth information about the use of the drug in question, this being the fourth part of the questionnaire - details on each drug. The fifth part of the questionnaire included a simplification of the criteria of the syndrome of dependence on drugs adapted from the Diagnostic and Statistic Manual of Mental Disorders, Revised Third (DSM-III-R) (17). Finally, the 6th part refers to the identification of possible treatments already undertaken by the person interviewed, plus questions about complications resulting from the use of alcohol. In the present article, only data from the first five parts of the questionnaire referring exclusively to alcohol will be reported and discussed.
The questionnaire was first translated and administered to 50 persons in various parts of the city of São Paulo, taking into account the socioeconomic and cultural conditions: 50 persons answered the questionnaire twice, with an interval of 30 days between replies. Agreement between test and retest was analyzed by the kappa coefficient (18), with a result of k = 0.75.
A reliable diagnosis of dependence requires a clinical interview during which the signs/symptoms chosen from the diverse instruments of diagnostic criteria are assessed qualitatively. For instance, the DSM-III-R (14) will diagnose a person who presents 3 of the 9 signs/symptoms previously established to define a dependence on a substance. The SAMHSA (13,16-18) has greatly simplified the diagnosis of dependence, using only six of the signs/symptoms of the DMS-III-R and a positive response regarding only two or more of these by the person interviewed. This concept was developed by the National Household Surveys on Drug Abuse in 1991 (17). The signs/symptoms are as follows: it took a great deal of time to obtain the drugs, to use them or to recover from the effects; used a greater amount, or at a frequency greater than intended; tolerance (greater amount to produce the same effects); physical risks under the effect of drugs or soon after the effect of the drugs (for instance, driving, riding a motorbike, using machinery, swimming, etc.); personal problems (with family, friends, work, with the police, whether emotional or psychological); the desire to reduce or to stop the use of a specific drug.
Because, according to the SAMHSA (19), only a questionnaire is applied to establish a diagnosis of dependence - furthermore, with a reduced number of criteria and responses, in the present study, we found it convenient to replace the term dependence with expressing "concern with one's own consumption".
The variables studied concerning the prevalence of consumption of psychotropic drugs are regarded as proportions, which permit the estimation of the use of a specific drug in a given population. These estimates were calculated, but were subject to sampling errors inherent to the process of collecting information, because this was a probabilistic sample. Using the coefficient of variation, we can describe how much an estimate may be affected by sampling errors (20-22).
The chi-square test was used for the comparisons between the regions Northeast and South, with the level of significance set at P < 0.05.
Results
Since the reports on concern over one's own consumption of alcohol showed a marked contrast between the sample in the North and Northeast in relation to the Southeast and South, the results obtained will be presented for the three different segments of the estimated population: total population involving five regions of Brazil and, separately, the population of the Northeast and of the South.
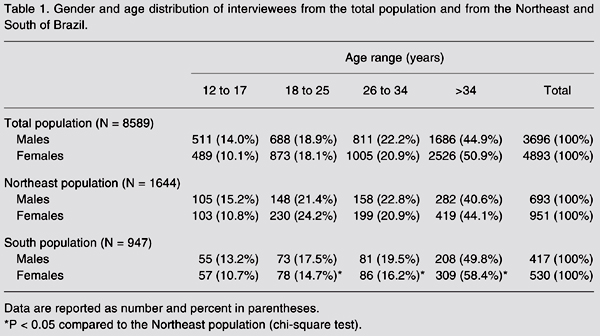
Table 1 shows the sociodemographic characteristics of the three study populations. In the total population that involved 107 major cities in the country, there was a predominance of interviewees over 26 years of age (67.1% males and 71.8% females). Table 1 also shows that the age ranges of the interviewees are similar in the Northeast and in the South and do not differ from the total estimated population.
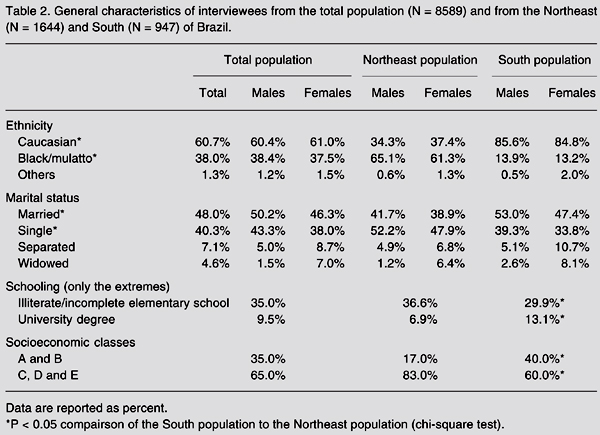
In contrast, there are significant ethnic and socioeconomic differences between the Northeast and the South (Table 2). Caucasians are predominant in the South (over 80% of the population interviewed), a percentage more than two times greater than in the Northeast; in contrast, the Northeast possesses approximately six times more blacks/mulattoes than the South. The South has almost twice the number of people belonging to social classes A and B and twice the number of people with upper level education than the Northeast.
Comparison of the three population samples (Table 3) shows a marked similarity in the percentage of users, not only for the different age brackets but also for gender regarding lifetime use of alcohol. In the total population, 77.3% of males and 60.6% of females reported lifetime use of alcohol. It can also be observed that, regardless of the population studied and of the age range, there was a predominance of reports of lifetime use by the male population.
Table 4 presents the percentages of interviewees reporting two or more concerns regarding the use of alcohol. In the total estimated population, 11.2% of those interviewed reported such concern, a fact observed three times more frequently among men (17.1 and 5.7%, respectively) and in all age brackets. The percentage of interviewees concerned with one's own consumption of alcohol was greater expressive, in particular in the Northeast, for all age brackets studied, with a male:female proportion 3:1. Another feature that is outstanding in the Northeast is the fact that 15.2% of those interviewed were males between the ages of 12 and 17 years reporting concern over the use of alcohol. Table 5 shows that the percentages of persons concerned over consumption in the Northeast were approximately twice those observed the South for any age bracket and gender. Table 5 shows the percentage of affirmative responses for each of the signs/symptoms that make up a classification of dependence according to that proposed by SAMHSA which, in this study, were defined as concern with one's own consumption (see Methods). Both in the total population and in the two regions analyzed, the desire to stop or reduce the use of alcohol presented the highest percentages varying from 11.2% in the South to 20.2% in the Northeast. Use in quantities or at frequencies greater than intended ranks second as a problem, as reported by 13.6% of the population in the Northeast and 8.1% of the population in the South. On the other hand, it can be seen that, with the exception of answers regarding physical risks, a greater percentage of northeastern users responded affirmatively to criteria determining concern with one's own consumption.
Gender and age distribution of interviewees from the total population and from the Northeast and South of Brazil.
General characteristics of interviewees from the total population (N = 8589) and from the Northeast (N = 1644) and South (N = 947) of Brazil.
Lifetime use of alcohol by the total population (N = 8589) and by the populations of the Northeast (N = 1644) and the South (N = 947), distributed according to gender and the age range in Brazilian cities with over 200 thousand inhabitants.
Overall prevalence of persons interviewed reporting two or more concerns with their own consumption of alcohol, and comparison of the percentages of the population in general and the Northeast and South populations.
Prevalence of answers concerning the presence of different concerns with the consumption of alcohol and comparison of the percentages of the population in general and the Northeast and South populations.
Discussion
The lifetime use of alcohol in the 107 largest cities in Brazil was 68.7%, a lower percentage than 83.6% for Chile and 81.3% for the US, but higher than that observed in Colombia (35.5%). Brazilian data confirm recent studies showing that the use of alcohol begins in infancy and is consolidated in adolescence (23,24). It is important to note that an early start in the use of alcohol may render an adolescent more vulnerable to problems related to drinking abuse (24).
In Brazil, as in other countries, lifetime use of alcohol was greater among males than among females, with a differential profile between genders. Reported frequencies are 87.3% for males and 80.5% for females in Chile, 86.6% for males and 78.8% for females in the US, 77.3% for males and 60.6% for females in Brazil, and 48.1% for males and 23.6% for females in Colombia (14,23). Regarding concerns as a result of alcohol consumption, the prevalence was also much greater for males (17.1%) than for females (5.7%; Table 4).
Analysis of the components that characterize concern about alcohol consumption (the presence of at least two, according to SAMHSA criteria) (13,19,20) showed that the percentage of subjects showing the desire to reduce intake or to stop was more prevalent and as high as 14.5% in the present study, but slightly lower than the value reported in a US survey where this sign/symptom was detected in 20.2% of the total population (19). Another important component was greater use than intended as reported by 9.4% of those interviewed in the population in general, closely similar to the 7.6% rate reported in the US study. The frequency of personal problems reported as a result of use of alcoholic beverages was 7.1%. Close to 5% of the subjects showed signs/symptoms of tolerance, physical risks under the effect of alcohol and personal problems as a result of use of drink.
On the other hand, in the male population, the relationship between lifetime use (77.3%) and concern with consumption (17.1%) was 4.5:1, whereas for females, this proportion was 10.6:1. In other words, for every group of 10 women with lifetime use, only one reported at least two criteria of concern about her own consumption of alcohol.
The prevalence of persons who met at least two criteria for concern about their own drinking habits ranked above 16% both in the North and Northeast and was below 10% in the Southeast and South. There are marked sociocultural differences between the Northeast and South regions (Table 2), although none of these characteristics may, a priori, be deemed responsible for differences in consumption.
However, different preferences for drinks exist between the Northeast and South regions. While in the Northeast there is a predominance of beer and "cachaça" (sugarcane spirits), in the South, owing to a strong contingent of European immigrants (Italian and German), the use of wine is culturally more accepted (13). The difference between North/Northeast and South may be due to the type of drink used and the culture involving these uses. Thus, the use of "cachaça", a distillate with approximately 50% alcohol, is regarded by the population as the main alcoholic beverage responsible for ill effects, whereas in the South drinking wine at mealtimes is a traditional behavior passed down over generations and considered to be healthy. A fact of greater concern is the evidence that in Brazil as a whole 5.2% of teenagers (ages 12 through 17 years) satisfied at least two criteria regarding their own consumption of alcohol, with these values reaching 9% in the North and Northeast.
References
1. Keller M. A historical overview of alcohol and alcoholism. Cancer Res 1979; 39: 2822-2829.
2. IBGE - Instituto Brasileiro de Geografia e Estatística. Anuário estatístico do Brasil. Rio de Janeiro: Fundação Instituto Brasileiro de Geografia e Estatística; 2001.
3. Almeida-Filho N, Mari JJ, Coutinho ESF, França JF, Fernades JG, Andreoli SB, et al. Estudo multicêntrico de morbidade psiquiátrica em áreas urbanas brasileiras (Brasília, São Paulo, Porto Alegre). Rev ABP-APAL 1992; 16: 93-104.
4. ABDETRAN - Associação Brasileira dos Departamentos de Trânsito. Impacto do uso do álcool e outras vítimas de acidentes de trânsito. Brasília: CETAD/ RAID; 1997.
5. Noto AR, Carlini EA. Internações hospitalares provocadas por drogas: análise de sete anos consecutivos (1987-1993). Rev ABP-APAL 1995; 17: 107-114.
6. Carlini-Cotrim B, Carlini EA, Silva-Filho A, Barbosa MTS. O uso de drogas psicotrópicas por estudantes de primeiro e segundo graus da rede estadual, em dez capitais brasileiras, 1987. In: Ministério da Saúde (Editor), Consumo de drogas psicotrópicas no Brasil, em 1987. Brasília: Centro de Documentação do Ministério da Saúde (Série C: Estudos e Projetos 5); 1989. p 9-84.
7. Carlini EA, Carlini-Cotrim B, Silva-Filho AR, Barbosa M. II Levantamento nacional sobre o uso de psicotrópicos em estudantes de primeiro e segundo graus, 1989. São Paulo: Centro Brasileiro de Informações sobre Drogas Psicotrópicas, Departamento de Psicobiologia da Escola Paulista de Medicina; 1990.
8. Galduróz JCF, D'Almeida V, Carvalho V, Carlini EA. III Levantamento sobre o uso de drogas entre estudantes de 1º e 2º graus em 10 capitais brasileiras - 1993. São Paulo: Centro Brasileiro de Informações sobre Drogas Psicotrópicas, Departamento de Psicobiologia da Escola Paulista de Medicina; 1994.
9. Galduróz JCF, Noto AR, Carlini EA. V Levantamento sobre o uso de drogas entre estudantes de 1º e 2º graus em 10 capitais brasileiras - 1997. São Paulo: Centro Brasileiro de Informações sobre Drogas Psicotrópicas, Departamento de Psicobiologia, Universidade Federal de São Paulo; 1997.
10. Plotnik R, Azmus AD, Tannhauser M, Tannhauser SL. Utilização de psicotrópicos por estudantes universitários. Rev Pesq Med 1986; 20: 109-113.
11. Noto AR, Nappo S, Galduróz JCF, Mattei R, Carlini EA. III Levantamento sobre o uso de drogas entre meninos e meninas em situação de rua de cinco capitais brasileiras - 1993. São Paulo: Centro Brasileiro de Informações sobre Drogas Psicotrópicas, Departamento de Psicobiologia da Escola Paulista de Medicina; 1994.
12. Galduroz JC, Noto AR, Nappo SA, Carlini EA. Household survey on drug abuse in Brazil: study involving the 107 major cities of the country - 2001. Addict Behav 2005; 30: 545-556.
13. Carlini EA, Galduróz JCF, Noto AR, Nappo SA. I Levantamento domiciliar sobre o uso de drogas psicotrópicas no Brasil, 2001. São Paulo: Centro Brasileiro de Informações sobre Drogas Psicotrópicas, Departamento de Psicobiologia, UNIFESP; 2002.
14. Research Triangle Institute. Substance abuse and mental health services administration. 2004 National survey on drug use and health data collection final report. Research Triangle Park: RTI International; 2005.
15. Kish L. Survey sampling. Washington: John Wiley & Sons Inc.; 1967.
16. SAMHSA - Substance Abuse and Mental Health Services Administration. Substance abuse in states and metropolitan areas: model based estimates from 1991-1993, national household survey on drug abuse: Summary report. Washington: U.S. Department of Health and Human Services; 1996.
17. APA - American Psychiatric Association. Diagnostic and statistical manual of disorders. 3rd edn. revised (DSM-III-R). Washington: American Psychiatric Association; 1987.
18. Kramer MS, Feinstein AR. Clinical biostatistics. LIV. The biostatistics of concordance. Clin Pharmacol Ther 1981; 29: 111-123.
19. SAMHSA - Substance Abuse and Mental Health Services Administration. Office of applied studies, national household survey on drug abuse. U S Department of Health and Human Services http://www.samhsa.gov; 2005.
20. Epstein J, Gfroerer J. A method for estimating substance abuse treatment need from a national household survey. 37th International Congress on Alcohol and Drug Dependence. August 20-25; USA: 1995.
21. Kessler RC, McGonagle KA, Zhao S, Nelson CB, Hughes M, Eshleman S, et al. Lifetime and 12-month prevalence of DSM-III-R psychiatric disorders in the United States. Results from the National Comorbidity Survey. Arch Gen Psychiatry 1994; 51: 8-19.
22. IBGE. PNAD - Década de 70. Séries: relatórios metodológicos. Rio de Janeiro: Fundação IBGE; 1971.
23. CONACE - Consejo Nacional para el Control de Estupefacientes MdI. Segundo informe anual sobre la situación de drogas en Chile. Santiago: Sistema Nacional de Información sobre Drogas; 1997.
24. Fergusson DM, Lynskey MT, Horwood LJ. Childhood exposure to alcohol and adolescent drinking patterns. Addiction 1994; 89: 1007-1016.
Address for correspondence: J.C.F. Galduróz, Rua Napoleão de Barros, 925, 04024-002 São Paulo, SP, Brasil. Fax: +55-11-5084-2793. E-mail: galduroz@psicobio.epm.br
Research supported by Secretaria Nacional Antidrogas, Presidência da República, Brazil, the USA Embassy, AFIP, and CNPq. Publication supported by FAPESP. Received March 3, 2006. Accepted January 3, 2007.
- 1. Keller M. A historical overview of alcohol and alcoholism. Cancer Res 1979; 39: 2822-2829.
- 2. IBGE - Instituto Brasileiro de Geografia e Estatística. Anuário estatístico do Brasil Rio de Janeiro: Fundação Instituto Brasileiro de Geografia e Estatística; 2001.
- 3. Almeida-Filho N, Mari JJ, Coutinho ESF, França JF, Fernades JG, Andreoli SB, et al. Estudo multicêntrico de morbidade psiquiátrica em áreas urbanas brasileiras (Brasília, São Paulo, Porto Alegre). Rev ABP-APAL 1992; 16: 93-104.
- 4. ABDETRAN - Associação Brasileira dos Departamentos de Trânsito. Impacto do uso do álcool e outras vítimas de acidentes de trânsito Brasília: CETAD/ RAID; 1997.
- 5. Noto AR, Carlini EA. Internações hospitalares provocadas por drogas: análise de sete anos consecutivos (1987-1993). Rev ABP-APAL 1995; 17: 107-114.
- 6. Carlini-Cotrim B, Carlini EA, Silva-Filho A, Barbosa MTS. O uso de drogas psicotrópicas por estudantes de primeiro e segundo graus da rede estadual, em dez capitais brasileiras, 1987. In: Ministério da Saúde (Editor), Consumo de drogas psicotrópicas no Brasil, em 1987 Brasília: Centro de Documentação do Ministério da Saúde (Série C: Estudos e Projetos 5); 1989. p 9-84.
- 7. Carlini EA, Carlini-Cotrim B, Silva-Filho AR, Barbosa M. II Levantamento nacional sobre o uso de psicotrópicos em estudantes de primeiro e segundo graus, 1989 São Paulo: Centro Brasileiro de Informações sobre Drogas Psicotrópicas, Departamento de Psicobiologia da Escola Paulista de Medicina; 1990.
- 8. Galduróz JCF, D'Almeida V, Carvalho V, Carlini EA. III Levantamento sobre o uso de drogas entre estudantes de 1º e 2º graus em 10 capitais brasileiras - 1993 São Paulo: Centro Brasileiro de Informações sobre Drogas Psicotrópicas, Departamento de Psicobiologia da Escola Paulista de Medicina; 1994.
- 9. Galduróz JCF, Noto AR, Carlini EA. V Levantamento sobre o uso de drogas entre estudantes de 1º e 2º graus em 10 capitais brasileiras - 1997 São Paulo: Centro Brasileiro de Informações sobre Drogas Psicotrópicas, Departamento de Psicobiologia, Universidade Federal de São Paulo; 1997.
- 10. Plotnik R, Azmus AD, Tannhauser M, Tannhauser SL. Utilização de psicotrópicos por estudantes universitários. Rev Pesq Med 1986; 20: 109-113.
- 11. Noto AR, Nappo S, Galduróz JCF, Mattei R, Carlini EA. III Levantamento sobre o uso de drogas entre meninos e meninas em situação de rua de cinco capitais brasileiras - 1993 São Paulo: Centro Brasileiro de Informações sobre Drogas Psicotrópicas, Departamento de Psicobiologia da Escola Paulista de Medicina; 1994.
- 12. Galduroz JC, Noto AR, Nappo SA, Carlini EA. Household survey on drug abuse in Brazil: study involving the 107 major cities of the country - 2001. Addict Behav 2005; 30: 545-556.
- 13. Carlini EA, Galduróz JCF, Noto AR, Nappo SA. I Levantamento domiciliar sobre o uso de drogas psicotrópicas no Brasil, 2001 São Paulo: Centro Brasileiro de Informações sobre Drogas Psicotrópicas, Departamento de Psicobiologia, UNIFESP; 2002.
- 14. Research Triangle Institute. Substance abuse and mental health services administration. 2004 National survey on drug use and health data collection final report Research Triangle Park: RTI International; 2005.
- 15. Kish L. Survey sampling Washington: John Wiley & Sons Inc.; 1967.
- 16. SAMHSA - Substance Abuse and Mental Health Services Administration. Substance abuse in states and metropolitan areas: model based estimates from 1991-1993, national household survey on drug abuse: Summary report Washington: U.S. Department of Health and Human Services; 1996.
- 17. APA - American Psychiatric Association. Diagnostic and statistical manual of disorders 3rd edn. revised (DSM-III-R). Washington: American Psychiatric Association; 1987.
- 18. Kramer MS, Feinstein AR. Clinical biostatistics. LIV. The biostatistics of concordance. Clin Pharmacol Ther 1981; 29: 111-123.
-
19SAMHSA - Substance Abuse and Mental Health Services Administration. Office of applied studies, national household survey on drug abuse. U S Department of Health and Human Services http://www.samhsa.gov; 2005.
- 20. Epstein J, Gfroerer J. A method for estimating substance abuse treatment need from a national household survey. 37th International Congress on Alcohol and Drug Dependence August 20-25; USA: 1995.
- 21. Kessler RC, McGonagle KA, Zhao S, Nelson CB, Hughes M, Eshleman S, et al. Lifetime and 12-month prevalence of DSM-III-R psychiatric disorders in the United States. Results from the National Comorbidity Survey. Arch Gen Psychiatry 1994; 51: 8-19.
- 22. IBGE. PNAD - Década de 70. Séries: relatórios metodológicos Rio de Janeiro: Fundação IBGE; 1971.
- 23. CONACE - Consejo Nacional para el Control de Estupefacientes MdI. Segundo informe anual sobre la situación de drogas en Chile Santiago: Sistema Nacional de Información sobre Drogas; 1997.
- 24. Fergusson DM, Lynskey MT, Horwood LJ. Childhood exposure to alcohol and adolescent drinking patterns. Addiction 1994; 89: 1007-1016.
Correspondence and Footnotes

Publication Dates
-
Publication in this collection
13 Feb 2008 -
Date of issue
Mar 2007
History
-
Accepted
03 Jan 2007 -
Received
03 Mar 2006