Abstract
The aim of the present study was to develop a classifier able to discriminate between healthy controls and dyspeptic patients by analysis of their electrogastrograms. Fifty-six electrogastrograms were analyzed, corresponding to 42 dyspeptic patients and 14 healthy controls. The original signals were subsampled, filtered and divided into the pre-, post-, and prandial stages. A time-frequency transformation based on wavelets was used to extract the signal characteristics, and a special selection procedure based on correlation was used to reduce their number. The analysis was carried out by evaluating different neural network structures to classify the wavelet coefficients into two groups (healthy subjects and dyspeptic patients). The optimization process of the classifier led to a linear model. A dimension reduction that resulted in only 25% of uncorrelated electrogastrogram characteristics gave 24 inputs for the classifier. The prandial stage gave the most significant results. Under these conditions, the classifier achieved 78.6% sensitivity, 92.9% specificity, and an error of 17.9 ± 6% (with a 95% confidence level). These data show that it is possible to establish significant differences between patients and normal controls when time-frequency characteristics are extracted from an electrogastrogram, with an adequate component reduction, outperforming the results obtained with classical Fourier analysis. These findings can contribute to increasing our understanding of the pathophysiological mechanisms involved in functional dyspepsia and perhaps to improving the pharmacological treatment of functional dyspeptic patients.
Functional dyspepsia; Electrogastrography; Wavelet transform; Neural networks
Braz J Med Biol Res, December 2009, Volume 42(12) 1203-1209
Detection of patients with functional dyspepsia using wavelet transform applied to their electrogastrogram
M. Chacón1,  Correspondence and Footnotes
 G. Curilem1,2, G. Acuña1, C. Defilippi3, A.M. Madrid3 and S. Jara1
1Informatics Engineering Department, Universidad de Santiago de Chile, USACH, Santiago, Chile
2Electrical Engineering Department, Universidad de La Frontera, Temuco, Chile
3Clinical Hospital, Universidad de Chile, Santiago, Chile
 References
Correspondence and Footnotes
Correspondence and Footnotes
Correspondence and Footnotes
Abstract
The aim of the present study was to develop a classifier able to discriminate between healthy controls and dyspeptic patients by analysis of their electrogastrograms. Fifty-six electrogastrograms were analyzed, corresponding to 42 dyspeptic patients and 14 healthy controls. The original signals were subsampled, filtered and divided into the pre-, post-, and prandial stages. A time-frequency transformation based on wavelets was used to extract the signal characteristics, and a special selection procedure based on correlation was used to reduce their number. The analysis was carried out by evaluating different neural network structures to classify the wavelet coefficients into two groups (healthy subjects and dyspeptic patients). The optimization process of the classifier led to a linear model. A dimension reduction that resulted in only 25% of uncorrelated electrogastrogram characteristics gave 24 inputs for the classifier. The prandial stage gave the most significant results. Under these conditions, the classifier achieved 78.6% sensitivity, 92.9% specificity, and an error of 17.9 ± 6% (with a 95% confidence level). These data show that it is possible to establish significant differences between patients and normal controls when time-frequency characteristics are extracted from an electrogastrogram, with an adequate component reduction, outperforming the results obtained with classical Fourier analysis. These findings can contribute to increasing our understanding of the pathophysiological mechanisms involved in functional dyspepsia and perhaps to improving the pharmacological treatment of functional dyspeptic patients.
Key words: Functional dyspepsia; Electrogastrography; Wavelet transform; Neural networks
Introduction
Functional dyspepsia (FD) has been defined by the Rome III consensus as the presence of symptoms thought to originate in the gastroduodenal region in the absence of any organic systemic or metabolic disease that is likely to explain the symptoms (1). The symptoms are epigastric pain and burning, postprandial fullness and early satiation. Also, two subgroups have been defined: postprandial distress syndrome and epigastric pain syndrome. Several factors are involved in the origin of these symptoms (2). The role of Helicobacter pylori infection has been controversial but more recent studies have revealed small benefit from H. pylori eradication. Gastric sensorimotor abnormalities have been extensively investigated in patients with FD and delayed gastric emptying has been considered the most important mechanism since an abnormal gastric emptying was observed in 20 to 50% of patients with FD (3,4), but the relationship between abnormalities of gastric emptying and symptoms is unclear. Impaired gastric accommodation to a meal has been demonstrated in patients with FD by studies on the gastric barostat, causing an abnormal intragastric distribution of food. Other abnormalities such as hypersensitivity to gastric distention or altered duodenal sensitivity to lipids or acid have also been described. Gastric function testing currently used to investigate impairment of motor activity or altered sensitivity is still limited to research laboratories and is not recommended for routine study of patients with FD (5), also because radiation or intubation is necessary.
Another approach to these patients is to study myoelectrical activity by means of cutaneous electrogastrography (6). The difficulty in recording the electric activity by means of electrogastrograms (EGG) has resulted in the design of new methods that have improved the signal/noise ratio of the EGG and improved the reliability of the record (7,8). The long signal records (approximately 2 h) and their non-stationary nature require computer processing.
Many studies have shown that the EGG is an accurate measurement of the gastric slow wave frequency, and that the relative change in amplitude of the EGG signals might reflect the contractility of the stomach (8). EGG analysis has been focused on the study of the pathophysiological mechanisms involved in diseases such as FD (9), diabetic gastroparesis (10), gastroesophageal reflux (11), systemic sclerosis (12), and a combination of them.
Although there is no standard method for analyzing the EGG, at present, frequency, amplitude and stability are the most frequently studied EGG parameters (8). The most widely used processing structure for EGG analysis consists of a preprocessing step, which extracts the most relevant characteristics from the original signal, and a classification step.
The first step has been implemented using mostly spectral analysis based on the Fourier transform (11,13). Since traditional Fourier analysis uses block processing, which produces undesired averaging effects in the spectra, special processing techniques have been developed based on adaptive and mobile media models, and more recently on the wavelet transform (WT) (12,14). The WT stands out because it avoids the problems of segmenting the signal by using windows based on functions that can be completely scaled and modulated. This is called multiresolution analysis (15). This type of transform is a powerful alternative for the analysis of non-stationary signals whose spectral characteristics change in time, such as biomedical signals in general (16) and EGG in particular (10).
The second step is the classification of the characteristics extracted in the first step. The most widely used techniques are statistical tests (9,11,13,17,18). However, more sophisticated tools such as artificial neural networks (ANN) (10,19) and support vector machines (20) have also been used.
The number of papers focused exclusively on identifying FD in healthy subjects is limited and the results are controversial. No significant differences result when the characteristics obtained from the signal are the ratio of the power between the post- and preprandial stages, the dominant frequency, the stability (17), the percentage of normo-, brady- and tachygastria (21), the percentage of slow wave coupling (13), or the percentage of power distribution (11). However, other research using spectral analysis has shown EGG abnormalities in different gastric diseases (9,18,22). In all of these studies, statistical analysis of the features was used in the classifying step.
A substantial change in the results occurred when WT was used for feature extraction (10,12). For FD classification, Tchervensky et al. (14) used the compression ability of the WT to evaluate abnormal frequencies.
Based on state-of-the-art EGG analysis, it can be stated that WT performs better in feature extraction of the signals. However, the number of coefficients obtained from this transform makes their analysis more difficult, and therefore complex indices must be developed to achieve an adequate classification.
The aim of the present study was to develop an automatic classifier to discriminate between healthy subjects and FD patients based on their EGG recordings. The paper presents a classifying method that uses WT as the feature extractor and a particular feature reduction based on correlation to reduce the number of WT coefficients. ANNs have been successfully used to classify nonlinear, irregular and noise data, and their ability to adapt to different problems makes them suitable for solving classification problems, mainly based on qualitative differences (23). For these reasons they were chosen in the present study for the classifying step. Second objective of the study was to apply the proposed method to the three stages of the EGG exam (pre-, post- and prandial) to look for a segment where the characteristics of the signal are more representative of the disease investigated.
Material and Methods
Data collection
EGG were obtained from 42 patients who fulfilled Rome II criteria for the diagnosis of functional dyspepsia, 36 (85.7%) women with an average age of 46.6 years (range: 7 to 82 years) and 6 men (14.3%), with an average age of 45.17 years (from 23 to 61 years). The control group included 14 healthy volunteers: 8 (55.5%) women with an average age of 34.1 years (range 18-51 years) and 6 men (44.4%) with an average age of 39.5 years (range: 28 to 63 years). These exams were carried out between 2000 and 2002 at the Clinical Hospital of Universidad de Chile, using a computational tool known as Polygram version 5.0 developed by Gastrosoft Inc. (24) for registering, processing and storing data. The electrogastrograph has bandwidth analogue filters that capture the gastric frequencies (between 0.03 and 0.15 Hz) and small intestinal frequencies (from 0.15 to 0.3 Hz). Additionally, low-pass filters are used before digitalization in order to avoid "alising" (25). The analysis of these signals was authorized by the Ethics Committee of the Clinical Hospital of the University of Chile. The signals obtained were digitally stored at a sampling frequency of 8 Hz for subsequent processing by Matlab version 6.1, using the signal processing, wavelet and neural network toolboxes.
Each exam consisted of a 2.5-h recording. After a 10-min relaxation period, the preprandial stage was initiated under fasting conditions, and lasted approximately 1 h. Subsequently, a light meal was offered to the patient, thus initiating the prandial stage, which lasted 20 to 30 min. Finally, the postprandial stage started, lasting approximately 1 h. A total of 28,800 samples were considered for each of the pre- and postprandial stages, which corresponded to 1 h sampled at 8 Hz, and 7200 samples were considered for the prandial stage, which corresponded to the first 15 min, sampled at 8 Hz.
Feature extraction
In order to avoid the segmentation of the signal required for the Fourier windowing calculation, the WT uses a different alternative, which consists of using a window that moves through the signal allowing the spectral calculation of each position. Iteration is then performed by gently increasing or decreasing the size of the window, thus obtaining a complete set of time-frequency representations at different resolutions.
The WT decomposes the signal into a set of base functions that correspond to a family. Families are generated by dilation and translation of a basic wavelet, called the "mother" wavelet, which is a function of time denoted by ψ(t). Translation of ψ provides temporal resolution, and dilation provides scaling. In order to implement these functions there are various alternatives, the most widely used being those of Haar, Daubechies and Morlet.
The discrete WT is used for applications that involve digital processing of the signals. The result of discrete WT is a multilevel decomposition in which the coefficients that determine a high degree of resolution correspond to the high-frequency components of the signal, while the low resolution levels correspond to the low-frequency components.
For the implementation of the discrete WT, scaling functions ψ(t) are used, in addition to the base wavelets that act as band pass filters, to establish upper limits for the scaling factors.
The division of the spectrum is carried out by means of a multiresolution analysis, which subsequently divides the spectrum into two portions. The details of the high-frequency portion of the signal are kept, while the half corresponding to the lower frequencies can be further subdivided as often as necessary, and is limited only by the amount of available information.
Since the EGG signal is non-stationary and its spectral characteristics change with time, the discrete WT coefficients should provide more information about the frequency and temporal characteristics of the recordings than the Fourier transform, which is the mathematical tool most commonly used to process them. Thus, the discrete WT coefficient will be used as the signal feature.
Preprocessing step
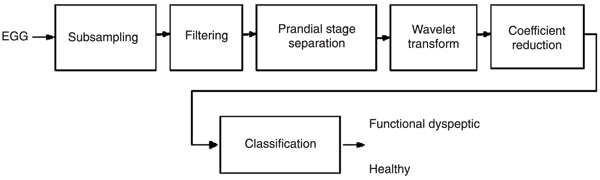
The data obtained from the Polygram equipment presented a very high rate of sampling because the maximum frequencies in the stomach correspond to tachygastric episodes and reach 0.15 Hz or 9 cycles per minute (cpm). Frequencies above 9 cpm correspond to activity in the small intestine. These signals have frequency components that are outside the range of gastric activity, and include a great deal of noise. In order to focus on the relevant information, a subsampling process was carried out followed by filtering of the signal. The exam was separated into its three stages (preprandial, prandial and postprandial), in order to obtain the wavelet transform coefficients separately. After subsampling by a down-sampling rate of 20, the pre- and postprandial stages included 1440 samples each, while the prandial stage included 360 samples. The discrete WT coefficients were extracted from these signals and the coefficient reduction was then performed. The complete process is illustrated in Figure 1.
The reduction of the coefficients' number had to be performed because classifiers designed with all the discrete WT coefficients obtained from the transformation did not reach acceptable performances. Thus, the first step was to compare the bands of all patients. For both groups, the analysis showed that in the two highest bands the amplitude of the coefficients was very low, carrying poor information, and the lowest band exhibited an erratic behavior, as shown in Figure 2. Therefore, these bands were discarded. After this reduction there still remained a large number of coefficients for each stage, but it was seen that they contained redundant information. With this large number of coefficients and only 56 cases, it was not possible to carry out a principal component analysis (26), and thus the characteristics were reduced by discarding correlation coefficients that had a percentage of correlation higher than a threshold value (27). This percentage is called percentage of similarity between the coefficients. A nonlinear curve was obtained for the relationship between the percentage of similarity and the number of coefficients, as previously shown by Chacon et al. (28). The threshold controls a trade-off criterion: minimum number of coefficients versus maximum signal information. To define the best threshold, the feature reduction process was carried out using different thresholds ranging from 5 to 95% for the prandial stage, and from 50 to 95% for the pre- and postprandial stages. In the study by Chacon et al. (28), the filter method used to reduce the number of features consisted of selecting the point of the most pronounced drop of the similarity versus coefficients curve. This approach has the disadvantage that it ignores the effects of the selected features on the performance of the classifier. Thus, unlike as done by Chacon et al. (28), in the present study, a wrapper method (29) was used to select the more relevant number of coefficients. This method uses the classifier itself to find the optimal point of the ROC curve, obtained from the test set error as the threshold varies.
Classification step
The reduced set of discrete WT coefficients is directly introduced into the classifier as the input. Since the coefficients come from a wavelet transformation, each one provides the frequency and time information of the signal and the classifier has to make a decision based on this information.
Classification was carried out by means of a static neural network, which used the backpropagation method for training (30). As the input layer receives the reduced set of wavelet coefficients obtained from the preprocessing step, the number of input neurons is fixed by the number of coefficients left by the reduction process. Architectures with one hidden layer were tested because this structure can represent any decision boundary to classify different classes with an arbitrary small error (31). The number of neurons in the hidden layer was fixed in order to reduce the validation error of the network. For the output layer two configurations were evaluated: an output with two neurons corresponding to the two classes (0,1: healthy and 1,0: FD), representing a classic classifier and an output with one neuron for which a threshold J must be calculated to identify the corresponding class ((0;J: healthy and J;1: FD).
Different training methods were also evaluated such as backpropagation with momentum, resilient backpropagation, secant and second-order methods (Levenberg-Marquardt) (30). In order to improve the training of the network, a cross-validation process was used (32), which consisted of separating the initial set into seven groups. Each group included the exams of 6 dyspeptic and 2 healthy patients. Training was carried out with six groups, and the seventh was the test set, reserved to evaluate the generalization capacity of the network. This process was carried out seven times in order to evaluate all groups.
Results
Feature selection
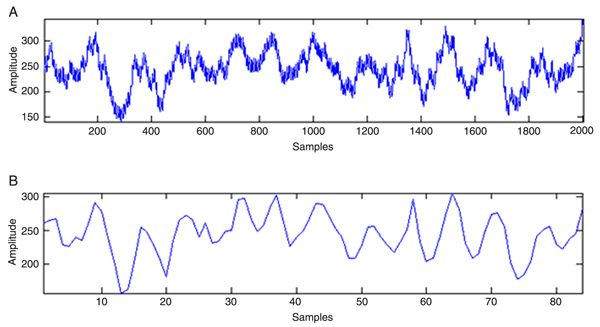
In the subsampling step, the signal was reduced by selecting one sample for every 20 original samples, thus obtaining a sampling frequency of 24 cpm. The signal filtering was carried out with a Butterworth low-pass 4th-order filter with a cut-off frequency of 10 cpm. This cut-off frequency allowed eliminating small intestine activity without damaging the signals that correspond to gastric activity. The results of this process for 1 patient are shown in Figure 3A and B. The EGG recordings were divided into the three previously mentioned stages, which were analyzed separately. For each stage it was necessary to ensure that the length of each segment was the same for each patient, as a way of normalizing the input to the neural classifier.
For the calculation of the discrete WT, the Morlet and the Daubechies of 1st- (Haar), 3rd-, 4th-, and 5th-order base wavelets were tested to obtain the discrete WT coefficients. The performance of each base wavelet was evaluated by the classifier performance after the cross-validation process. The 4th-order Daubechies yielded the best results, in agreement with de Sobral Cintra et al. (33). As mentioned before, once the wavelet transform coefficients were obtained, very little relevant information existed in the first lower band and the two higher bands, and thus these coefficients were discarded. After this elimination the number of wavelet coefficients left was 112 for the prandial stage and 481 for the pre- and postprandial stages.
Correlation analysis was applied to the discrete WT coefficients to eliminate coefficients describing the same behavior for the whole set of subjects. Feature reduction using correlation analysis associated with the wrapper method allowed evaluating different correlation percentages. The best reduction was achieved when the threshold reached 75% for the prandial stage. In this case, only 25% of the total information was preserved, which corresponded to 24 coefficients left in this stage. In the pre- and postprandial stages the maximum percentage of correlated coefficients that could be eliminated was 50%, so that 327 coefficients were left for each stage, impairing their treatment with only 56 cases.
Classifier design and performance
Different neural classifiers were implemented for each exam stage, and the four training methods mentioned above were evaluated. Sigmoid neurons were used for the hidden layers, and linear and sigmoid neurons for the output layer.
Acceptable results were obtained by means of the cross-validation process: 83.9% accuracy, 88.1% sensitivity and 71.4% specificity. However, these results were achieved with a reduced number of neurons in the hidden layer, which led to the assumption that the problem could be linear. Due to this fact, the evaluation of a network structure with no hidden layer was performed, thus transforming the classifier into a linear discriminator, which uses a single output neuron with a sigmoid activation function.
The best results of the linear model were obtained for the prandial stage with 24 input coefficients, one output neuron, and the resilient backpropagation training method. In the network evaluation process, specificity was favored over sensitivity because it is more important to correctly classify the individuals with no FD since the symptoms can hide a more complicated diagnosis. The threshold value was adjusted according to this criterion in order to improve the classification of healthy people. Then, the ANN achieved 82.1% accuracy, with 78.6% sensitivity and 92.9% specificity. These results outperformed those of the nonlinear classifier and of the linear configuration implemented with a Fourier feature extraction method. This last configuration achieved 44.6% accuracy, with 38.1% sensitivity and 64.2% specificity, confirming the superiority of the wavelet preprocessing method compared to Fourier preprocessing.
Preprocessing and classification steps: at the input the electrogastrograms (EGG) and at the output the classes: healthy or functional dyspeptic.
Remaining coefficients after the elimination of the first lower band and the two higher bands (shaded regions) that do not carry information. DWT = discrete wavelet transform.
Discussion
Due to the multiple possible pathophysiological causes of FD, the Rome protocol is the only diagnostic method that allows dealing with the multifactorial symptoms that characterize this gastric disorder. The diagnosis is based on the patient's perception of the symptoms since there are no clinical criteria to distinguish FD from other gastric diseases. The Rome protocol establishes a classification of the FD patients according to the possible origin of their symptoms. The classification is fundamental to define the specific pharmacotherapeutic treatment for each patient. Myoelectrical disorders may support the identification of a subgroup of FD patients.
Attempts to diagnose gastric electric abnormalities in FD by studying the frequencies generated by the spectral analysis are not satisfactory when treated by conventional methods like Fourier and statistical analysis. In most FD analyses the methods integrate many features, like frequency, amplitude ratios, stability, etc., and complex indices must be developed in order to characterize the different phenomena. The results obtained by Zheng et al. (9) are promising, although they were not compared to those of healthy patients. Attempts to systematically extract EGG characteristics for their subsequent classification using WT have generated adequate results in other gastric diseases (10,12). In many cases, a multichannel EGG was necessary to obtain the signals (13,14).
The present study showed that it is possible to distinguish FD patients from healthy individuals with a high degree of accuracy using only the frequency of the signal obtained from a single-channel EGG recording. The proposed method, which incorporates the advantages of WT and ANN, systematizes a procedure for extracting relevant spectral features from the signal, selecting the most significant ones, and improving the efficiency of the classifier. The main result is that this preprocessing method transformed the complex EGG processing into a linear problem.
One of the main problems of feature extraction is dimensionality. As an additional contribution, the proposed feature selection was performed by a correlation mechanism, able to eliminate the most correlated coefficients obtained from the WT and leaving a minimum but sufficient number of coefficients to correctly classify the EGG.
On the other hand, the analysis of the signal incorporated the prandial stage, which is usually discarded in other studies. The procedure showed that the analysis of this stage yielded better results in feature reduction and classification. This suggests that it is easier to detect abnormalities when the stimulation of the gastric system begins, during the transient period (prandial), than during the stable period, when the stomach is empty (preprandial) or loaded (postprandial). In other studies, the prandial stage is automatically excluded from the EGG analysis because it is full of noise due to the swallowing of food and other non-gastric movements. The results obtained by the mechanism of wavelet coefficient reduction showed that there is more redundant information in the prandial stage than in the other stages, suggesting that this mechanism is able to depurate the prandial signal from the noise. Moreover, as the reduced subset of coefficients contains the less correlated ones and allows obtaining a good classification performance, it can be inferred that the feature selection process performed the extraction of relevant time-frequency information that separated FD from the control signals. This provides a new alternative for EGG processing, which is relevant because the prandial stage is shorter than the other stages, so the duration of the exam can be reduced.
The present study demonstrates that it is possible to design a linear classifier that discriminates between FD and healthy patients if the wavelet transform is applied to the EGG. The results show that it is possible to obtain an adequate classification performance when time-frequency characteristics are extracted from the EGG. This confirmed the superiority of the time-frequency analysis achieved by the wavelet transform compared to the spectral analysis of the Fourier method. Another interesting result of the present investigation is that the correlation method allowed reducing the dimensionality of the signal features, showing that the EGG contains redundant information. Moreover, the prandial stage supplied the more significant information with fewer features. These results open the possibility of analyzing what happens during feeding, when the stomach changes its state, perhaps supporting the understanding of the origin of the disorders. This study is currently underway in our laboratory.
The results are promising and future studies should improve the classifying capacity by incorporating the ability to discriminate between different subgroups of FD or other functional disorders. However, because of their nature, discrete WT coefficients do not provide clinical information about what is being considered by the classifier to identify an FD record from a normal one. This is why future study will consider the analysis and identification of relevant clinical parameters of the signals to perform the classification.
Acknowledgments
The authors acknowledge the financial support of the Departamento de Investigación Científica y Tecnológica (DICYT), Universidad de Santiago de Chile, and of FONDECYT project #1070070.
Address for correspondence: G. Curilem, Departamento de Ingeniería Eléctrica, Universidad de La Frontera, Av. Francisco Salazar, 01145, Casilla 54-D, Temuco, Chile. Fax: +56-45-32-5550. E-mail: millaray@ufro.cl
Received December 30, 2008. Accepted October 28, 2009. Available online November 13, 2009. Published December 4, 2009.
The Brazilian Journal of Medical and Biological Research is partially financed by


- 1. Tack J, Talley NJ, Camilleri M, Holtmann G, Hu P, Malagelada JR, et al. Functional gastroduodenal disorders. Gastroenterology 2006; 130: 1466-1479.
- 2. Tack J, Bisschops R, Sarnelli G. Pathophysiology and treatment of functional dyspepsia. Gastroenterology 2004; 127: 1239-1255.
- 3. Talley NJ, Shuter B, McCrudden G, Jones M, Hoschl R, Piper DW. Lack of association between gastric emptying of solids and symptoms in nonulcer dyspepsia. J Clin Gastroenterol 1989; 11: 625-630.
- 4. Waldron B, Cullen PT, Kumar R, Smith D, Jankowski J, Hopwood D, et al. Evidence for hypomotility in non-ulcer dyspepsia: a prospective multifactorial study. Gut 1991; 32: 246-251.
- 5. Talley NJ, Vakil N. Guidelines for the management of dyspepsia. Am J Gastroenterol 2005; 100: 2324-2337.
- 6. Lin Z, Eaker EY, Sarosiek I, McCallum RW. Gastric myoelectrical activity and gastric emptying in patients with functional dyspepsia. Am J Gastroenterol 1999; 94: 2384-2389.
- 7. Verhagen MA, Van Schelven LJ, Samsom M, Smout AJ. Pitfalls in the analysis of electrogastrographic recordings. Gastroenterology 1999; 117: 453-460.
- 8. Chang Y. Electrogastrography: Basic knowledge, recording, processing and its clinical applications. Review. J Gastroenterol Hepatol 2005; 20: 502-516.
- 9. Zheng X, Li J, Chen Q, Wang X. Incidence of gastric myoelectrical dysrhythmia in patients with functional dispepsia. Chinese J Gastroenterol 2006; 11: 107-108.
- 10. Kara S, Dirgenali F, Okkesim S. Detection of gastric dysrhythmia using WT and ANN in diabetic gastroparesis patients. Comput Biol Med 2006; 36: 276-290.
- 11. Chen CL, Hu CT, Lin HH, Yi CH. Clinical utility of electrogastrography and the water load test in patients with upper gastrointestinal symptoms. J Smooth Muscle Res 2006; 42: 149-157.
- 12. West BJ, Maciejewski A, Latka M, Sebzda T, Swierczynski Z, Cybulska-Okolow S, et al. Wavelet analysis of scaling properties of gastric electrical activity. J Appl Physiol 2006; 101: 1425-1431.
- 13. Zhang H, Xu X, Wang Z, Li C, Ke M. Correlation between gastric myoelectrical activity recorded by multi-channel electrogastrography and gastric emptying in patients with functional dyspepsia. Scand J Gastroenterol 2006; 41: 797-804.
- 14. Tchervensky IV, de Sobral Cintra RJ, Neshev E, Dimitrov VS, Sadowski DC, Mintchev MP. Centre-specific multichannel electrogastrographic testing utilizing wavelet-based decomposition. Physiol Meas 2006; 27: 569-584.
- 15. Mallat S. A theory for multirresolution signal decomposition: The wavelet representation. IEEE Trans Patter Anal 1989; 11: 674-693.
- 16. Torrence C, Compo G. A practical guide to wavelet analysis. Am Meteorol Soc 1998; 79: 61-78.
- 17. Holmvall P, Lindberg G. Electrogastrography before and after a high-caloric, liquid test meal in healthy volunteers and patients with severe functional dyspepsia. Scand J Gastroenterol 2002; 37: 1144-1148.
- 18. Friesen CA, Lin Z, Hyman PE, Andre L, Welchert E, Schurman JV, et al. Electrogastrography in pediatric functional dyspepsia: relationship to gastric emptying and symptom severity. J Pediatr Gastroenterol Nutr 2006; 42: 265-269.
- 19. Liang H, Lin Z, McCallum RW. Application of combined genetic algorithms with cascade correlation to diagnosis of delayed gastric emptying from electrogastrograms. Med Eng Phys 2000; 22: 229-234.
- 20. Liang H, Lin Z. Detection of delayed gastric emptying from electrogastrograms with support vector machine. IEEE Trans Biomed Eng 2001; 48: 601-604.
- 21. Oba-Kuniyoshi AS, Oliveira JA Jr, Moraes ER, Troncon LE. Postprandial symptoms in dysmotility-like functional dyspepsia are not related to disturbances of gastric myoelectrical activity. Braz J Med Biol Res 2004; 37: 47-53.
- 22. Leung MW, Wong BP, Chao NS, Chung KW, Kwok WK, Liu KK. Electrogastrography in the management of pediatric functional dyspepsia and motility disorder. J Pediatr Surg 2006; 41: 2069-2072.
- 23. Papik K, Molnar B, Schaefer R, Dombovari Z, Tulassay Z, Feher J. Application of neural networks in medicine - a review. Med Sci Monit 1998; 4: 538-546.
- 24. Gastrosoft Inc., Polygram - Software reference manual [Computer program]. USA: Lower GI Edition; 1990.
- 25. Smouth AJPM, Jebbink HJA, Samson M. Acquisition and analysis of electrographic data. The Dutch experience. In: Chen JZ, McCallum RW (Editors), Electrogastrography: Principles and applications New York: Raven Press Ltd.; 1994. p 3-30.
- 26. Jolliffe IT. Principal component analysis 2nd edn. New York: Springer-Verlag; 2002.
- 27. Carvajal K, Chacón M, Mery D, Acuña G. Neural network method for failure detection with skewed class distribution. Insight 2004; 7: 399-402.
- 28. Chacon M, Jara S, Defilippi C, Madrid AM, Defilippi C. A simple feature reduction method for the detection of long biological signals. Lect Notes Comput Sci 2005; 3773: 431-439.
- 29. John GH, Kohavi R, Pfleger K. Irrelevant features and the subset selection problem. Proceedings of the 11th International Conference of Machine Learning 1994. p 121-129.
- 30. Prince J, Euliano N, Lefebre W. Neural and adaptive system New York: John Wiley & Sons Inc.; 2000.
- 31. Hornick K, Stinchcombe M, White H. Multi layer feedforward networks are universal approximators. Neural Netw 1989; 2: 359-366.
- 32. Bishop C. Neural networks for pattern recognition Oxford: Claredon Press; 1995.
- 33. de Sobral Cintra RJ, Tchervensky IV, Dimitrov VS, Mintchev MP. Optimal wavelets for electrogastrography. Conf Proc IEEE Eng Med Biol Soc 2004; 1: 329-332.
Correspondence and Footnotes

Publication Dates
-
Publication in this collection
04 Dec 2009 -
Date of issue
Dec 2009
History
-
Accepted
28 Oct 2009 -
Received
30 Dec 2008