Abstract
In order to understand the mechanisms of poor osseointegration following dental implants in type 2 diabetics, it is important to study the biological properties of alveolar bone osteoblasts isolated from these patients. We collected alveolar bone chips under aseptic conditions and cultured them in vitro using the tissue explants adherent method. The biological properties of these cells were characterized using the following methods: alkaline phosphatase (ALP) chemical staining for cell viability, Alizarin red staining for osteogenic characteristics, MTT test for cell proliferation, enzyme dynamics for ALP contents, radio-immunoassay for bone gla protein (BGP) concentration, and ELISA for the concentration of type I collagen (COL-I) in the supernatant. Furthermore, we detected the adhesion ability of two types of cells from titanium slices using non-specific immunofluorescence staining and cell count. The two cell forms showed no significant difference in morphology under the same culture conditions. However, the alveolar bone osteoblasts received from type 2 diabetic patients had slower growth, lower cell activity and calcium nodule formation than the normal ones. The concentration of ALP, BGP and COL-I was lower in the supernatant of alveolar bone osteoblasts received from type 2 diabetic patients than in that received from normal subjects (P < 0.05). The alveolar bone osteoblasts obtained from type 2 diabetic patients can be successfully cultured in vitro with the same morphology and biological characteristics as those from normal patients, but with slower growth and lower concentration of specific secretion and lower combining ability with titanium than normal ones.
Alveolar bone; Cell culture; Implant; Osteoblast; Type 2 diabetics
Abstract
Introduction
Material and Methods
Results
Discussion
Acknowledgments
Braz J Med Biol Res, June 2012, Volume 45(6) 502-509
In vitro culture and characterization of alveolar bone osteoblasts isolated from type 2 diabetics
Dao-Cai Sun1,2*, De-Hua Li1, Hui-Cang Ji3*, Guo-Zhou Rao4, Li-Hua Liang1, Ai-Jie Ma5, Chao Xie1, Gui-Ke Zou1 and
Correspondence and Footnotes
 Ying-Liang Song1*
1Department of Implant Dentistry, School of Stomatology, Fourth Military Medical University, Xi’an, China
2Department of Stomatology, The 291st Hospital of P.L.A, Baotou, China
3Military Sanatorium of Retired Cadres, Baotou, China
4Center of Laboratory, School of Stomatology, Xi’an Jiaotong University, Xi’an, China
5Xi’an Technology University, Xi’an, China
 References
Correspondence and Footnotes
Correspondence and Footnotes
Correspondence and Footnotes
In order to understand the mechanisms of poor osseointegration following dental implants in type 2 diabetics, it is important to study the biological properties of alveolar bone osteoblasts isolated from these patients. We collected alveolar bone chips under aseptic conditions and cultured them in vitro using the tissue explants adherent method. The biological properties of these cells were characterized using the following methods: alkaline phosphatase (ALP) chemical staining for cell viability, Alizarin red staining for osteogenic characteristics, MTT test for cell proliferation, enzyme dynamics for ALP contents, radio-immunoassay for bone gla protein (BGP) concentration, and ELISA for the concentration of type I collagen (COL-I) in the supernatant. Furthermore, we detected the adhesion ability of two types of cells from titanium slices using non-specific immunofluorescence staining and cell count. The two cell forms showed no significant difference in morphology under the same culture conditions. However, the alveolar bone osteoblasts received from type 2 diabetic patients had slower growth, lower cell activity and calcium nodule formation than the normal ones. The concentration of ALP, BGP and COL-I was lower in the supernatant of alveolar bone osteoblasts received from type 2 diabetic patients than in that received from normal subjects (P < 0.05). The alveolar bone osteoblasts obtained from type 2 diabetic patients can be successfully cultured in vitro with the same morphology and biological characteristics as those from normal patients, but with slower growth and lower concentration of specific secretion and lower combining ability with titanium than normal ones.
Key words: Alveolar bone; Cell culture; Implant; Osteoblast; Type 2 diabetics
Branemark proposed the osseointegration theory and established the biological basis of modern oral implantology in the early 1960s. With a growing number of clinical practices and basic research, oral implants have become an ideal means for repairing defects or lack of tooth column and maxillofacial organs (1). However, in clinical practice, many patients who need dental implants often have a range of systemic diseases, including cardiovascular disease, diabetes, metabolic bone disease, bleeding disorders, adrenal hyperfunction, Crohn’s disease, autoimmune disease, nervous system disease, or mental disorders (2). These conditions often lead to failure of the implant prosthesis and greatly limit further application and promotion of implant technology. Within these systemic diseases, diabetes has an especially prominent manifestation and dental clinicians have been plagued by the high failure rate and risks for oral implants (3-7). Diabetes is a general metabolic abnormality and harbors a genetic predisposition to chronic systemic disease. Its incidence has increased yearly, with it already becoming a pandemic. The International Diabetes Federation (IDF) estimated that global cases will increase from 2.2 to 3.8 hundred million in 2025 (8,9). Among these diagnosed cases, type 2 diabetics account for ~90-95% (10) of all new cases of diabetes. Type 2 diabetes mellitus was previously defined as non-insulin-dependent diabetes mellitus and is characterized by variable degrees of insulin resistance in peripheral tissue, impaired insulin secretion, and increased glucose production (11). Previous studies have shown that the implant cannot form good osseous adhesion to the surrounding tissues (12-19), although the exact mechanism remains unclear. The influence of type 2 diabetes mellitus on osseointegration has many complicated features. For example, damage to the healing ability of the bone, microvascular pathological changes in blood supply, decline in immune defenses, a decline in collagen fiber formation, and an increase in collagen enzyme activity (20). As a result, the differentiation of these osteoblasts is blocked and new bone formation is damaged. Based on previous studies using diabetic animals (19,21,22), our team attempted to elucidate the properties of osteoblasts of these type 2 diabetic patients, with the ultimate goal of improving the success rate for dental implants for type 2 diabetic patients.
Alveolar bone collection
Samples of alveolar bone were collected from 2 patients who requested dental implants due to the lack of the left mandibular first molar. One patient was healthy and the other had an 8-year history of type 2 diabetes. The healthy and diabetic patients were males and were 47 and 48 years old, respectively. Blood tests indicated that blood glucose and glycosylated hemoglobin were 5.9 mM and 5.8% for the healthy patient and 11.7 mM and 10.8% for the diabetic patient, who had not controlled his blood glucose in the past. The diabetic patient was advised to lower his blood glucose level prior to having the dental implant. His blood glucose and glycosylated hemoglobin were 6.1 mM and 6.2%, respectively, after 2 months of manipulation of both diet and medicine (oral intake of metformin). With the permission of both the patients and the University Research Ethics Committee, bone chips were collected from both patients using aseptic techniques.
Reagents and instruments
Dulbecco’s modified Eagle’s medium (DMEM) (containing low and high carbohydrate) was purchased from Gibco Company (USA). Ten percent fetal calf serum (FCS) was purchased from Hao Yang (China). Trypsin (0.25%) and MTT were supplied by Sigma (USA). Alizarin red was from USA Scientifics. The alkaline phosphatase staining and test kits were purchased from NanJing Jiancheng Technology Company Ltd. (China). The bone gla protein (BGP) radio-immunoassay kit was supplied by BeiJing Puer Biological Technology Company Ltd. (China). The human collagen I (COL-I) kit was purchased from R&D Company (USA). Pure titanium slices 10 mm in diameter were supplied by the Northwest Institute for Nonferrous Metal Research of China (China).
Osteoblast culture
Collected bone chips were washed in triplicate with Hank’s buffer containing two antibiotics (100 U/mL penicillin and 100 µg/mL streptomycin). The bone chips were centrifuged twice (5 min each), the supernatant was removed and the bone chips were placed on Petri dishes pre-coated with small amounts of FCS. The bone chips were moisturized with low carbohydrate DMEM and incubated for 3 h in a 37°C, 5% CO2 incubator. The bone chips were then transferred to complete culture medium for 4 days using the same conditions. The culture medium was refreshed every 4 days, until the cells covered approximately 80% of the bottom of the Petri dishes. The cultured cells were re-plated to their fourth generation, which was used to identify biological specificity. The type 2 diabetic cells grew slower than those of the healthy patient and high sugar DMEM was therefore used for culture starting from the second generation.
Alkaline phosphatase staining
Cultured cells from both the healthy and diabetic patients were washed twice with PBS and then fixed with 2 mL 4% paraformaldehyde for 3 min. The cells were covered with freshly prepared alkaline phosphatase substrate and incubated for 15 min at 37°C in a dark, wet box. Cells were washed with PBS and stained with hematoxylin-eosin for 3 min and examined under a light microscope.
Alizarin red staining
The cultured cells were washed twice with PBS, then fixed with 95% ethanol for 10 min and washed with distilled water three times. Alizarin red (0.1%) in Tris-HCl, pH 8.3, was added to the cell culture and incubated for 30 min at 37°C. Cells were flushed with distilled water, air dried, and examined under a light microscope.
Cell growth curve
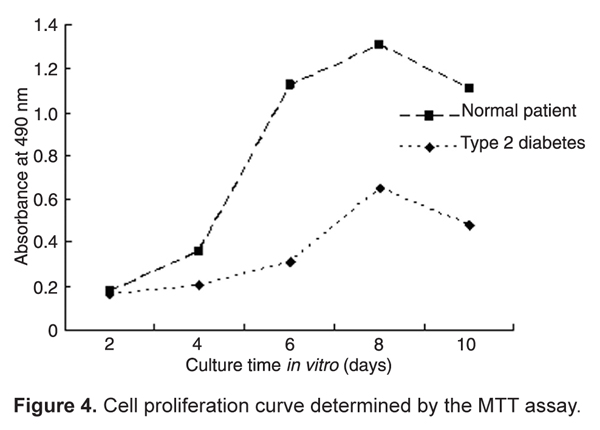
The cultured alveolar bone osteoblasts from both the type 2 diabetic patient (C1) and the healthy patient (C2) were transferred to 96-well plates and cultured further. The fourth generation of cells was collected and cell density was adjusted to 1 x 10³/mL. Cells were then inoculated into multiple wells of the 96-well plates. At days 2, 4, 6, 8, and 10, 20 µL MTT was added to cultured cells for 4 h and a growth curve was determined using a standard enzyme analyzer at 490-nm wavelength.
Alkaline phosphatase content
Using the techniques described above, the C1 and C2 cells were centrifuged at days 2, 4, 6, and 8. The supernatants were collected and alkaline phosphatase content was measured using a colorimetric assay according to manufacturer instructions (alkaline phosphatase staining and test kit, NanJing Jiancheng Technology Company Ltd.). Absorbance was measured at 520 nm and was converted to enzyme activity units.
BGP concentration in osteoblast supernatant fluid
The BGP concentration was determined using the 125I BGP radio-immunity kit (BeiJing Puer Biological Technology Company Ltd.) according to manufacturer instructions. The mixed liquid was left at room temperature for 20 min and then centrifuged at 3500 rpm for 25 min at 4°C. The supernatant was removed and the precipitation value for each tube was measured using a gamma counter. The corresponding sample concentration was obtained according to the standard curve.
Human COL-I concentration in osteoblast supernatant fluid
COL-I concentration was determined using the human COL-I kit (R&D Company, USA) according to the manufacturer operation manual and absorbance was measured at 450 nm. The corresponding concentration was calculated according to the standard curve.
Nonspecific immunofluorescence staining and cell count
C1 and C2 cells were inoculated onto culture plates pre-loaded with titanium slices. When the titanium slices were fully covered with cells, the culture medium was removed, and the cells were washed with PBS twice and then immersed in the fluorescence dye acrydine orange (Sigma). Cells were examined using a fluorescence microscope. Cells were digested with trypsin and the cell concentration was adjusted to 1 x 10³ cells/mL. Cells were inoculated onto 6-well culture plates pre-loaded with titanium slices at the top, bottom, left, and right. The cell suspension was slowly added to the titanium slices, cultured in a 37°C, 5% CO2 incubator until the titanium slices was covered with cells. The titanium slices were placed on Petri dishes, washed with PBS and digested with 0.25% trypsin and the cell number was counted.
Osteoblast morphology and growth conditions
In primary cells, osteoblasts from the healthy patient migrated out of the tissue mass by the 5th day in culture, whereas it took 9 days for the osteoblasts from the diabetic patient to migrate out (Figure 1a, Panel A). The morphology of cells from the two patients was similar. Cells first migrating from the tissue were long and slim. As cell number increased and cells continued to grow, they became polygonal or triangular. The osteoblast cells were re-cultured when they covered 80% of the bottom of the plates (22 days for cells from the healthy patient and 32 days for cells from the diabetic patient; Figure 1a, Panel B). Mineral nodules were observed in the newly cultured cells. Figure 1b shows the process of mineral nodule formation (blue outline) and well-formed mineral nodules (red outline). Cell growth time in low carbohydrate DMEM of the type 2 diabetic patient was significantly slower than that in high carbohydrate DMEM (Figure 2). No significant difference for cell growth was observed, however, in the healthy patient.
Alkaline phosphatase staining
The majority of cells from the healthy patient showed positive alkaline phosphatase (ALP) staining. Gully-like shapes were observed between cells, and the cytoplasm color was dark gray (Figure 3a, Panel A). Under the same culture conditions, cells from the type 2 diabetic patient appeared lighter in color (Figure 3a, Panel B) compared to those from the healthy patient. Positive-stained cells were loosely arranged. Using the grid count method, we calculated that the positive cells from the healthy patient were 92%, while the positive cells from the type 2 diabetic patient were 73%, indicating that the activity of alkaline phosphatase from type 2 diabetic cells was lower than that from healthy cells.
Alizarin red staining
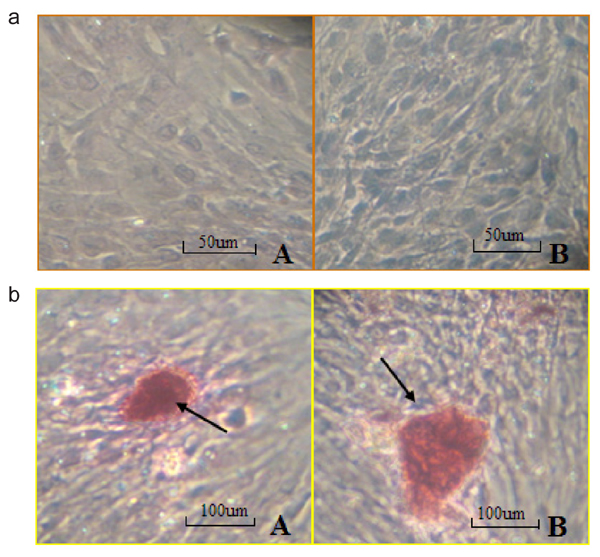
Using the same culture conditions, cells from the healthy patient and the diabetic patient showed Alizarin red-positive staining. Dark-red staining with various sizes and shapes was observed, confirming the formation of mineral nodules. Cells from the diabetic patient showed less mineral nodules, and the sizes of the nodules were smaller than those of the healthy patient (Figure 3b).
Colorimetric analysis of thiazole blue
After cell inoculation at 2, 4, 6, 8, and 10 days, the cell number and growth curves were calculated. The number of cells from the healthy patient was high during the 4-8-day period, while the number of cells from the type 2 diabetic patient peaked on the 6-8th day. Cells from both patients reached saturation during the 8-10-day period, and then gradually declined. As shown in Figure 4, proliferation of type 2 diabetic cells was slower than that of cells from the healthy patient.
Quantitative assessment of alkaline phosphatase activity
The alkaline phosphatase activity of cells from the healthy patient was highest on the 6th day, as opposed to the 8th day for the patient with type 2 diabetes. The overall trend for alkaline phosphatase activity from the healthy patient was relatively higher than that of the type 2 diabetic (P < 0.05; Table 1).
Determination of BGP concentration
According to the standard concentration curve, we obtained BGP concentrations in the supernatant fluid from cells of the type 2 diabetic and healthy patients at 2, 4, 6, and 8 days and found that both reached a peak on the 6th day and gradually decreased on the 8th day, with significant differences in BGP concentrations between patients (P < 0.05; Table 1).
COL-I concentration
COL-I concentration was determined according to the standard cell concentration (absorbance value). The COL-I concentration of C1 reached its highest level on the 6th day, but the overall increase was slow. On the 4th day, the COL-I concentration of the healthy patient increased significantly and reached a peak on the 6th day. The COL-I concentration of the healthy patient was significantly higher than that of the type 2 diabetic patient (P < 0.05; Table 1).
Immunofluorescence staining and cell count
Immunofluorescence staining showed that cells from both the healthy and the diabetic patient were able to adhere to the titanium slices. Cell nuclei and cell membranes were observed using various fluorescence backgrounds (Figure 5). Under the same conditions, the cell counts of the diabetic patient (means ± SD = 0.45 ± 0.138, x 105 cells/mL) and the healthy patient (means ± SD = 0.53 ± 0.239, x 105 cells/mL) were significantly different (P < 0.05; one-way ANOVA). The ability to adhere to the titanium slices was lower for cells from the type 2 diabetic patient than for cells from the healthy patient.
Comparison of cell morphology (a) and mineralization (b) of osteoblast cells from a healthy patient and a type 2 diabetic patient. a, Morphology of cells from the type 2 diabetic patient that migrated out of tissue chips (Panel A; magnification: 200X). Cells from a healthy patient (Panel B; magnification 400X). Cells from a type 2 diabetic patient before passage in culture (Panel C; magnification: 200X). b, Cell mineralization showing high mineralization density of cells from a healthy patient (Panel A; magnification: 400X). Mineralization nodules formed from cells of the healthy patient (Panel B). Several mineralization nodules formed from cells of the type 2 diabetic patient (Panel C). Blue arrow indicates high mineralization density of cells. Red arrows indicate mineralization nodules.
Comparison of cell growth from the type 2 diabetic mellitus (DM) patient in low and high carbohydrate DMEM. The height of the column indicates the mean ± SD (*P < 0.05; one-way ANOVA).
Comparison of alkaline phosphatase (ALP) staining (a) and mineral nodules (b) of osteoblast cells from a healthy subject and from a type 2 diabetic patient. a, ALP staining of osteoblast cells from a type 2 diabetic patient (Panel A), and from a healthy patient (Panel B). b, Mineral nodules secreted by osteoblast cells from a type 2 diabetic patient (Panel A), and a healthy patient (Panel B). Arrows indicate mineral nodules after alkaline phosphatase staining.
Comparison of morphology using immunofluorescence of cells from a healthy patient (A) and from a type 2 diabetic patient (B). Black arrows partly indicate cells of a healthy patient. White arrows partly indicate cells of a type 2 diabetic patient. There were no significant morphological differences and both adhered to the titanium slices.
Comparison of alkaline phosphatase (ALP), bone gla protein (BGP), and type I collagen (COL-I) concentration in the supernatant of cells from a diabetic patient and a healthy patient.
Osteoblasts are known to differentiate from multifunctional marrow mesenchymal stem cells through osteoprogenitor cells and into pre-osteoblasts. Mature osteoblasts synthesize collagenous and non-collagenous extracellular bone matrix proteins, and initiate and support matrix mineralization (23). The craniofacial skeleton originates from the ectomesenchyme and the alveolar tissue is formed by intramembranous ossification. It then surrounds the root of the tooth and constantly changes during the development of the mobile, shedding and chewing functions of the tooth. It is the most active part of bone tissue metabolism (24,25). The alveolar osteoblasts can participate in the precise regulation of osteoclast to bone resorption and maintain bone metabolism balance besides forming bone matrix collagen and protein. This balance, however, is influenced by systemic diseases, particularly diabetes. The insulin resistance associated with type 2 diabetics can reduce the quantity of osteoblast and bone matrix synthesis (26). Persistent hyperglycemia can inhibit osteoblast differentiation (27-29), reduce alkaline phosphatase activity and delay bone deposition and mineralization (30). Osteoblast formation and differentiation become the keys for osseointegration. It is therefore particularly important to understand the biological properties of osteoblasts from type 2 diabetic patients.
Our results suggest that alveolar bone osteoblasts from type 2 diabetic patients can be successfully cultured in vitro and have a specific morphology compared to normal osteoblasts. Moreover, we confirmed that they differ in growth rate, activity and mineral secretion. Diabetic alveolar bone osteoblasts have strong memory function for pathologic alveolar bone lesions. Furthermore, these memory functions have been supported by previous animal studies (25-27). The ability to adhere to titanium slices as well as the ability for secretion are lower for osteoblasts from type 2 diabetics. This may be a reason for the poor adhesion of implants surrounding bone in diabetic patients.
Our results also show that osteoblasts from a type 2 diabetic patient exhibited slow growth in low carbohydrate DMEM, while they grew faster in the high sugar medium. The osteoblasts from the healthy patient showed no obvious difference in growth in low or high sugar medium. We speculate that this may be closely related to the speed of reduction of blood glucose to the normal range in the type 2 diabetic within 2 short months, which did not permit the diabetic osteoblasts to adapt to low carbohydrate environments. Similarly, people who live on a plateau on a long-term basis find it difficult to adapt to the atmospheric pressure when they reach a summit. This phenomenon is often seen in the clinic where patients with high blood glucose are often asked to quickly lower their blood glucose levels using insulin before the dental implant, fact that causes a higher failure rate. We speculate that type 2 diabetic patients should lower their blood glucose gradually and slowly prior to their dental implant. Further experiments on both animal models and humans are needed to confirm this hypothesis.
Dentists may hesitate to perform dental implants in diabetic patients for a variety of reasons, including delayed wound healing, prevalence of microvascular disease, impaired response to infection, and susceptibility to periodontal disease (5). In the present study, to guarantee the success of dental implants for the diabetic patient, we only collected bone chips on the pilot or twist drill, which ensured the purity of trabecular bone to a certain extent. Successful culture of normal alveolar bone osteoblasts has been reported earlier (21,28-30). In this study, we cultured alveolar bone osteoblasts from a healthy patient and a diabetic patient under the same conditions. We also characterized the cultured cells using an alkaline phosphatase kit, a BGP radioimmunity kit and a type I collagen kit. These methods are simple and the results are reliable.
The patient had an 8-year history of diabetes and never systematically controlled his blood sugar. A low-calorie diet and oral intake of metformin were prescribed to the patient for two months prior to the surgery. The blood glucose dropped to the normal range, possibly due to the fact that 1) the patient was sensitive to metformin, and 2) the patient’s active cooperation, such as following a low-calorie diet, performing moderate exercise, etc. No weight loss was observed during the 2-month period of treatment. It is not clear whether metformin has any influence on alveolar bone of osteoblasts. Cortizo et al. (31) reported that metformin promotes osteoblast-like cell proliferation in a dose-dependent manner. It has also been reported that metformin may help reduce bone fracture (32). In the present study, we showed that the cellular activity of a diabetic patient was poor even with the metformin intake. Experiments are underway to compare the cell activity of diabetic patients receiving or not metformin treatment. Alveolar bone osteoblasts of type 2 diabetic patients can be successfully cultured in vitro. The cultured cells provided an experimental carrier to study the mechanisms of poor synostosis for type 2 diabetic implants. It also permitted us to observe more directly the influences and changes of the diabetic osteoblasts, therefore, providing new information for exploring effective treatment methods.
We have previously demonstrated in an animal system that osteoblast formation and differentiation is the key influence of osseointegration following dental implants (18-20). In the present study, we tried to adapt the animal studies to clinical ones by comparing the biological characteristics of alveolar bone osteoblasts from a normal subject and a type 2 diabetic patient. It is much more difficult, however, to collect clinical samples, especially considering the patient’s age, gender, weight, lack of teeth, blood sugar levels, alveolar bone health conditions, etc. This greatly limited our study in terms of number of samples. Follow-up experiments will be conducted with a large sample size, as we are screening more patients that fulfill our criteria.
Within the limitations of this study, it can be concluded that alveolar bone osteoblasts from type 2 diabetic patients can be successfully cultured in vitro. Furthermore, this study has yielded important evidence showing that type 2 diabetic osteoblasts had a slower growth rate, lower cell activity, less mineral nodule formation, and lower concentrations of ALP, BGP and COL-I. Thus, our combined findings strongly suggest that osteoblast formation and differentiation are the keys for poor osseointegration in type 2 diabetics.
The authors would like to thank Professor Jing Wang for providing experimental instruments.
Address for correspondence: Ying-Liang Song, Department of Implant Dentistry, School of Stomatology, Fourth Military Medical University, 145 West ChangLe Road, Xi’an 710032, China. Fax: +86-29-8252-1217. E-mail: songyingliang@163.com
*These authors contributed equally to this study. Received June 17, 2011. Accepted March 23, 2012. Available online April 5, 2012. Published June 4, 2012.
The Brazilian Journal of Medical and Biological Research is partially financed by


All the contents of this journal, except where otherwise noted, is licensed under a Creative Commons Attribution License
- 1. Hilsen KL, Kallis J. Immediate placement and immediate loading of implants: restoring a smile in one day. Dent Today 2007; 26: 84, 86, 88.
- 2. Scully C, Hobkirk J, Dios PD. Dental endosseous implants in the medically compromised patient. J Oral Rehabil 2007; 34: 590-599.
- 3. Nevins ML, Karimbux NY, Weber HP, Giannobile WV, Fiorellini JP. Wound healing around endosseous implants in experimental diabetes. Int J Oral Maxillofac Implants 1998; 13: 620-629.
- 4. Fiorellini JP, Chen PK, Nevins M, Nevins ML. A retrospective study of dental implants in diabetic patients. Int J Periodontics Restorative Dent 2000; 20: 366-373.
- 5. Olson JW, Shernoff AF, Tarlow JL, Colwell JA, Scheetz JP, Bingham SF. Dental endosseous implant assessments in a type 2 diabetic population: a prospective study. Int J Oral Maxillofac Implants 2000; 15: 811-818.
- 6. Morris HF, Ochi S, Winkler S. Implant survival in patients with type 2 diabetes: placement to 36 months. Ann Periodontol 2000; 5: 157-165.
- 7. Moy PK, Medina D, Shetty V, Aghaloo TL. Dental implant failure rates and associated risk factors. Int J Oral Maxillofac Implants 2005; 20: 569-577.
- 8. Zimmet P, Shaw J, Alberti KG. Preventing type 2 diabetes and the dysmetabolic syndrome in the real world: a realistic view. Diabet Med 2003; 20: 693-702.
- 9. Federation I. Diabetes atlas Brussels: International Diabetes Federation; 2006.
- 10. Hasegawa H, Ozawa S, Hashimoto K, Takeichi T, Ogawa T. Type 2 diabetes impairs implant osseointegration capacity in rats. Int J Oral Maxillofac Implants 2008; 23: 237-246.
- 11. Casap N, Nimri S, Ziv E, Sela J, Samuni Y. Type 2 diabetes has minimal effect on osseointegration of titanium implants in Psammomys obesus Clin Oral Implants Res 2008; 19: 458-464.
- 12. McCracken M, Lemons JE, Rahemtulla F, Prince CW, Feldman D. Bone response to titanium alloy implants placed in diabetic rats. Int J Oral Maxillofac Implants 2000; 15: 345-354.
- 13. Kotsovilis S, Karoussis IK, Fourmousis I. A comprehensive and critical review of dental implant placement in diabetic animals and patients. Clin Oral Implants Res 2006; 17: 587-599.
- 14. Fiorellini JP, Nevins ML. Dental implant considerations in the diabetic patient. Periodontol 2000 2000; 23: 73-77.
- 15. Mellado-Valero A, Ferrer Garcia JC, Herrera BA, Labaig RC. Effects of diabetes on the osseointegration of dental implants. Med Oral Patol Oral Cir Bucal 2007; 12: E38-E43.
- 16. Tawil G, Younan R, Azar P, Sleilati G. Conventional and advanced implant treatment in the type II diabetic patient: surgical protocol and long-term clinical results. Int J Oral Maxillofac Implants 2008; 23: 744-752.
- 17. Bugea C, Luongo R, Di Iorio D, Cocchetto R, Celletti R. Bone contact around osseointegrated implants: histologic analysis of a dual-acid-etched surface implant in a diabetic patient. Int J Periodontics Restorative Dent 2008; 28: 145-151.
- 18. Wang F, Song YL, Li DH, Li CX, Wang Y, Zhang N, et al. Type 2 diabetes mellitus impairs bone healing of dental implants in GK rats. Diabetes Res Clin Pract 2010; 88: e7-e9.
- 19. Wang F, Song YL, Li CX, Li DH, Zhang HP, Ma AJ, et al. Sustained release of insulin-like growth factor-1 from poly(lactide-co-glycolide) microspheres improves osseointegration of dental implants in type 2 diabetic rats. Eur J Pharmacol 2010; 640: 226-232.
- 20. Wang B, Song Y, Wang F, Li D, Zhang H, Ma A, et al. Effects of local infiltration of insulin around titanium implants in diabetic rats. Br J Oral Maxillofac Surg 2011; 49: 225-229.
- 21. Perinpanayagam H, Martin T, Mithal V, Dahman M, Marzec N, Lampasso J, et al. Alveolar bone osteoblast differentiation and Runx2/Cbfa1 expression. Arch Oral Biol 2006; 51: 406-415.
- 22. Saffar JL, Lasfargues JJ, Cherruau M. Alveolar bone and the alveolar process: the socket that is never stable. Periodontol 2000 1997; 13: 76-90.
- 23. Sodek J, McKee MD. Molecular and cellular biology of alveolar bone. Periodontol 2000 2000; 24: 99-126.
- 24. Santana RB, Xu L, Chase HB, Amar S, Graves DT, Trackman PC. A role for advanced glycation end products in diminished bone healing in type 1 diabetes. Diabetes 2003; 52: 1502-1510.
- 25. Yeh JK, Evans JF, Chen MM, Aloia JF. Effect of hypophysectomy on the proliferation and differentiation of rat bone marrow stromal cells. Am J Physiol 1999; 276: E34-E42.
- 26. Chen TL. Inhibition of growth and differentiation of osteoprogenitors in mouse bone marrow stromal cell cultures by increased donor age and glucocorticoid treatment. Bone 2004; 35: 83-95.
- 27. Gevorgyan A, La Scala GC, Sukhu B, Leung IT, Ashrafpour H, Yeung I, et al. An in vitro model of radiation-induced craniofacial bone growth inhibition. J Craniofac Surg 2007; 18: 1044-1050.
- 28. Simao AM, Beloti MM, Rosa AL, de Oliveira PT, Granjeiro JM, Pizauro JM, et al. Culture of osteogenic cells from human alveolar bone: a useful source of alkaline phosphatase. Cell Biol Int 2007; 31: 1405-1413.
- 29. Al-Rabeah E, Perinpanayagam H, MacFarland D. Human alveolar bone cells interact with ProRoot and tooth-colored MTA. J Endod 2006; 32: 872-875.
- 30. Yefang Z, Hutmacher DW, Varawan SL, Meng LT. Comparison of human alveolar osteoblasts cultured on polymer-ceramic composite scaffolds and tissue culture plates. Int J Oral Maxillofac Surg 2007; 36: 137-145.
- 31. Cortizo AM, Sedlinsky C, McCarthy AD, Blanco A, Schurman L. Osteogenic actions of the anti-diabetic drug metformin on osteoblasts in culture. Eur J Pharmacol 2006; 536: 38-46.
- 32. Vestergaard P, Rejnmark L, Mosekilde L. Relative fracture risk in patients with diabetes mellitus, and the impact of insulin and oral antidiabetic medication on relative fracture risk. Diabetologia 2005; 48: 1292-1299.
Correspondence and Footnotes

Publication Dates
-
Publication in this collection
23 July 2012 -
Date of issue
June 2012
History
-
Received
17 June 2011 -
Accepted
23 Mar 2012