Abstract
This study investigated the effects of tidal volume (TV) on the diagnostic value of pulse pressure variation (PPV) and the inferior vena cava dispensability index (IVC-DI) for volume responsiveness during mechanical ventilation. In patients undergoing elective surgery with mechanical ventilation, different TVs of 6, 9, and 12 mL/kg were given for two min. The left ventricular outflow tract velocity-time integral (VTI) was measured by transthoracic echocardiography. The IVC-DI was measured at sub-xyphoid transabdominal long axis. The PPV was measured via the radial artery and served as baseline. Index measurements were repeated after fluid challenge. VTI increased by more than 15% after fluid challenge, which was considered as volume responsive. Seventy-nine patients were enrolled, 38 of whom were considered positive volume responsive. Baseline data between the response group and the non-response group were similar. Receiver operating characteristic curve confirmed PPV accuracy in diagnosing an increase in volume responsiveness with increased TV. When TV was 12 mL/kg, the PPV area under the curve (AUC) was 0.93 and the threshold value was 15.5%. IVC-DI had the highest diagnostic accuracy at a TV of 9 mL/kg and an AUC of 0.79, with a threshold value of 15.3%. When TV increased to 12 mL/kg, the IVC-DI value decreased. When the TV was 9 and 12 mL/kg, PPV showed improved performance in diagnosing volume responsiveness than did IVC-DI. PPV diagnostic accuracy in mechanically ventilated patients was higher than IVC-DI. PPV accuracy in predicting volume responsiveness was increased by increasing TV.
Pulse pressure variation; Inferior vena cava dispensability index; Volume responsiveness; Tidal volume; Mechanical ventilation; Fluid challenge
Introduction
Fluid resuscitation is the first and key step in the treatment of septic patients with circulatory failure (11. Vincent JL, De Backer D. Circulatory shock. N Engl J Med 2013; 369: 1726–1734, doi: 10.1056/NEJMra1208943.
https://doi.org/10.1056/NEJMra1208943...
,22. Rhodes A, Evans LE, Alhazzani W, Levy MM, Antonelli M, Ferrer R, et al. Surviving sepsis campaign: International guidelines for management of sepsis and septic shock: 2016. Intensive Care Med 2017; 43: 304–377, doi: 10.1007/s00134-017-4683-6.
https://doi.org/10.1007/s00134-017-4683-...
). Appropriate fluid therapy can increase cardiac output and improve tissue perfusion and oxygen supply, which helps improve the condition of the patient. Hypovolemia is very common in elective surgery because of preoperative routine fasting and liquid-fasting in patients (33. Miller A, Mandeville J. Predicting and measuring fluid responsiveness with echocardiography. Echo Res Pract 2016; 3: G1–G12, doi: 10.1530/ERP-16-0008.
https://doi.org/10.1530/ERP-16-0008...
). Perioperative hypovolemia is closely related to the post-surgical prognosis of patients. Additionally, hypovolemia without timely treatment might lead to post-operative nausea and vomiting, prolong the length of hospital stay, and even lead to end organ failure (44. Brienza N, Giglio MT, Marucci M, Fiore T. Does perioperative hemodynamic optimization protect renal function in surgical patients? A meta-analytic study. Crit Care Med 2009; 37: 2079–2090, doi: 10.1097/CCM.0b013e3181a00a43.
https://doi.org/10.1097/CCM.0b013e3181a0...
). Intravenous infusion helps to maintain hemodynamic stability in critically ill and post-surgical patients. Normally, fluid infusion can increase cardiac output; however, excessive fluid load might lead to interstitial edema, and even worsen the condition of the patient (55. Arikan AA, Zappitelli M, Goldstein SL, Naipaul A, Jefferson LS, Loftis LL. Fluid overload is associated with impaired oxygenation and morbidity in critically ill children. Pediatr Crit Care Med 2012; 13: 253–258, doi: 10.1097/PCC.0b013e31822882a3.
https://doi.org/10.1097/PCC.0b013e318228...
6. Micek ST, McEvoy C, McKenzie M, Hampton N, Doherty JA, Kollef MH. Fluid balance and cardiac function in septic shock as predictors of hospital mortality. Crit Care 2013; 17: R246, doi: 10.1186/cc13072.
https://doi.org/10.1186/cc13072...
7. Yang X, Du B. Does pulse pressure variation predict fluid responsiveness in critically ill patients? A systematic review and meta-analysis. Crit Care 2014; 18: 650, doi: 10.1186/s13054-014-0650-6.
https://doi.org/10.1186/s13054-014-0650-...
–88. Huang CC, Fu JY, Hu HC, Kao KC, Chen NH, Hsieh MJ, et al. Prediction of fluid responsiveness in acute respiratory distress syndrome patients ventilated with low tidal volume and high positive end-expiratory pressure. Crit Care Med 2008; 36: 2810–2816, doi: 10.1097/CCM.0b013e318186b74e.
https://doi.org/10.1097/CCM.0b013e318186...
).
Many studies have shown that excessive fluid intake is a common phenomenon in clinical practice, including septic shock patients and high-risk surgically anesthetized patients (99. Levy MM, Macias WL, Vincent JL, Russell JA, Silva E, Trzaskoma B, et al. Early changes in organ function predict eventual survival in severe sepsis. Crit Care Med 2005; 33: 2194–2201, doi: 10.1097/01.CCM.0000182798.39709.84.
https://doi.org/10.1097/01.CCM.000018279...
10. Rivers E, Nguyen B, Havstad S, Ressler J, Muzzin A, Knoblich B, et al. Early goal-directed therapy in the treatment of severe sepsis and septic shock. N Engl J Med 2001; 345: 1368–1377, doi: 10.1056/NEJMoa010307.
https://doi.org/10.1056/NEJMoa010307...
11. Lopes MR, Oliveira MA, Pereira VO, Lemos IP, Auler JO Jr, Michard F. Goal-directed fluid management based on pulse pressure variation monitoring during high-risk surgery: a pilot randomized controlled trial. Crit Care 2007; 11: R100, doi: 10.1186/cc6117.
https://doi.org/10.1186/cc6117...
–1212. Boyd JH, Forbes J, Nakada TA, Walley KR, Russell JA. Fluid resuscitation in septic shock: a positive fluid balance and elevated central venous pressure are associated with increased mortality. Crit Care Med 2011; 39: 259–265, doi: 10.1097/CCM.0b013e3181feeb15.
https://doi.org/10.1097/CCM.0b013e3181fe...
). Current studies have shown that only about 50% of patients that present with unstable hemodynamics show volume responsiveness, meaning that the stroke volume of patients after fluid infusion would increase, and about 50% of patients would display no volume responsiveness; thus, under such conditions, fluid infusion may cause bodily harm (1313. Marik PE, Monnet X, Teboul JL. Hemodynamic parameters to guide fluid therapy. Ann Intensive Care 2011; 1: 1, doi: 10.1186/2110-5820-1-1.
https://doi.org/10.1186/2110-5820-1-1...
).
At present, it is believed that dynamic volume indices, which are based on cardiopulmonary interactions, such as stroke volume variation (SVV), pulse pressure variation (PPV), pleth variability index, inferior vena cava (IVC) variation, and superior vena cava (SVC) variation, offer more objective and significantly reliable guidance for fluid infusion in clinical practice (1414. Hong DM, Lee JM, Seo JH, Min JJ, Jeon Y, Bahk JH. Pulse pressure variation to predict fluid responsiveness in spontaneously breathing patients: tidal vs. forced inspiratory breathing. Anaesthesia 2014; 69: 717–722, doi: 10.1111/anae.12678.
https://doi.org/10.1111/anae.12678...
15. Liu X, Fu Q, Mi W, Liu H, Zhang H, Wang P. Pulse pressure variation and stroke volume variation predict fluid responsiveness in mechanically ventilated patients experiencing intra-abdominal hypertension. Biosci Trends 2013; 7: 101–108, doi: 10.5582/bst.2013.v7.2.101.
https://doi.org/10.5582/bst.2013.v7.2.10...
–1616. Wyffels PA, Sergeant P, Wouters PF. The value of pulse pressure and stroke volume variation as predictors of fluid responsiveness during open chest surgery. Anaesthesia 2010; 65: 704–709, doi: 10.1111/j.1365-2044.2010.06371.x.
https://doi.org/10.1111/j.1365-2044.2010...
). Factors affecting these indices included the tidal volume (TV), positive end-expiratory pressure (PEEP) ventilation, arrhythmia, ventricular failure, and other factors. Moreover, changes in intrathoracic pressure caused by respiratory dynamics must be sufficiently large to cause periodic changes in cardiac output. In patients undergoing mechanical ventilation, TV was considered the main factor affecting the pleura, pericardial pressure, and right ventricular afterload (1717. Bendjelid K, Romand JA. Fluid responsiveness in mechanically ventilated patients: a review of indices used in intensive care. Intensive Care Med 2003; 29: 352–360, doi: 10.1007/s00134-002-1615-9.
https://doi.org/10.1007/s00134-002-1615-...
,1818. Michard F. Changes in arterial pressure during mechanical ventilation. Anesthesiology 2005; 103: 419-428; quiz 449–415, doi: 10.1097/00000542-200508000-00026.
https://doi.org/10.1097/00000542-2005080...
). Compared with PPV, transthoracic ultrasonography for IVC-dispensability index (DI) has the advantages of being non-invasive, rapid, convenient, inexpensive, and reproducible.
In this study, the effect of TV on the diagnostic value of PPV and IVC-DI for volume responsiveness was explored. We hypothesized that the diagnostic accuracy of PPV and IVC-DI could be improved by increasing the TV. In addition, the optimal TV that enabled achieving the best diagnostic value was explored. Finally, this study determined which index (PPV or IVC-DI) was more accurate in diagnosing volume responsiveness, thus providing improved evidence for optimized volume therapy in clinical practice. Our study population targeted patients receiving elective surgery mechanical ventilation. In this study, the velocity-time integral (VTI) of the left ventricular outflow tract was used as the reference method to evaluate volume responsiveness.
Material and Methods
This trial was approved by the local Ethics Committee and registered with the Chinese Clinical Trial Registry. All patients had signed an informed consent.
Patients
We included generally anesthetized and mechanically ventilated male and female patients, aged 18–60 years, with an American Society of Anesthesiologists (ASA) grade of 1–2. Pre-operative strict fasting and drinking prohibition was observed by all patients. The exclusion criteria were as follows: pregnancy, arrhythmia, left ventricle ejection fraction <40%, presence of heart valve disease, obvious right ventricular dysfunction, right heart failure, intracardiac shunt, peripheral artery disease or stenosis, contraindication of fluid challenge (acute coronary syndrome, cardiac shock, and evidence of capacity overload), chronic obstructive pulmonary disease, pulmonary hypertension, pulmonary embolism, increased abdominal pressure, intraperitoneal giant tumor, intra-aortic balloon pump, and a positive Allen's test.
Methods
Three research investigators (designated as A, B, and C) were mainly responsible for different parts of the study. Two of them (A and B) were trained in transthoracic cardiac ultrasound skills. Investigator “A” was responsible for recording the imaging data of the test indicators by ultrasound and did not measure the indicators. Investigator “B” was responsible for measuring and calculating the imaging data that were recorded by investigator “A” and was unaware of the other basic information and indicators of the patient. Investigator “C” was responsible for observing and recording vital signs of the patient and other indicators during the experiment and was blinded to the ultrasonic measurement data of the patient.
An electrocardiogram monitor (Mindray, BeneView T8, China) was used to measure PPV from arterial pressure waveforms and record vital signs of the patients. Transthoracic echocardiography (Mindray, M9cv) was used to measure the VTI of the left ventricular outflow tract and the diameter of the IVC. Routine anesthesia induction was comprised of the following approach: rapid induction with 0.05–0.1 mg/kg midazolam, 1.5–2.5 mg/kg propofol, 0.3–0.5 μg/kg sufentanyl, 0.15 mg/kg cis-atracurium (0.6–1.0 mg/kg rocuronium), and inhalation of sevoflurane to maintain anesthesia after endotracheal tube adjustment according to the patient-specific situation. TV adjustment was carried out after about 10 min with a post-endotracheal tube when the hemodynamics of the patient were stable. Heart rate (HR), diastolic blood pressure, systolic blood pressure, mean arterial pressure (MAP), PPV, peak pressure (Ppeak), plateau pressure, the VTI of the left ventricular outflow tract, and IVC-DI were recorded after a 6 ml/kg TV. The tidal volume was set according to the international ideal body weight. The respiratory rate of 9 cycles/min for 2 min and the air flow at 1L/min were maintained.
The velocity-time integral (VTI) of the left ventricular outflow tract was measured by transthoracic echocardiography. Blood flow of the left ventricular outflow tract was recorded by pulsed Doppler echocardiography on an apical five-chamber view. Sample volume lines were placed in the aortic annulus. The average value was taken after continuous measurement for approximately three to five times in one breathing cycle. The IVC diameter (IVC inspiration/IVC expiration) was measured at the subxiphoid transabdominal long axis, the position of the section was 2–3 cm from the distal end of the right atrial opening of the IVC. The diameter of the IVC at the end of inspiration (IVCinspiration) and the diameter of the IVC at the end of expiration (IVCexpiration) were also measured. The average value was taken after three continuous measurements. The inferior vena cava diameter at inspiration and expiration of the non-responsive (NR) group is shown in Figure 1, and the inferior vena cava diameter at inspiration and expiration of the responsive (R) group is shown in Figure 2.

Inferior vena cava diameter at inspiration (top) and expiration (bottom) of a non-responsive group representative.

Inferior vena cava diameter at inspiration (top) and expiration (bottom) of a responsive group representative.
The IVC-DI was calculated as (IVCinspiratory – IVCexpiratory) / IVCexpiratory × 100%.
The TV was adjusted to 9 and 12 mL/kg and the respiratory rate was maintained at 9 cycles/min. The indices were recorded after maintenance for 2 min and the airflow was maintained at 1 L/min.
Fluid challenge. Succinyl gelatin was infused intravenously over a 10-min period with a total infusion volume of 6 mL/kg that served to observe volume responsiveness. The tidal volumes of 6, 9, and 12 mL/kg were adjusted immediately after the fluid challenge and maintained for 2 min, and then the above indices were recorded again (Figure 3).

Positive criteria for the fluid challenge and grouping. Patients with an increased VTI of the left ventricular outflow tract (ΔVTI) ≥15% after the fluid challenge were enrolled in the response group (R group) and patients with a ΔVTI <15% were enrolled in the non-response group (NR group).
Exclusion criteria during the study. Changes of HR and MAP fluctuated by more than 20% of the baseline value or required vasoactive drug intervention; a Ppeak >30 cm H2O; an ultrasound image quality grading ≤3.
Image quality grading. Images were graded according to the following scoring system: Grade 1: no image; Grade 2: poor and unusable image; Grade 3: usable image quality; Grade 4: acceptable or good image quality; Grade 5: perfect image quality (1919. Jakobsen CJ, Torp P, Sloth E. Perioperative feasibility of imaging the heart and pleura in patients with aortic stenosis undergoing aortic valve replacement. Eur J Anaesthesiol 2007; 24: 589–595, doi: 10.1017/S0265021506002328.
https://doi.org/10.1017/S026502150600232...
).
Statistical analysis
Measurement data conforming to a normal distribution are reported as means±SD; data that did not conform to a normal distribution are reported as the median (Q25, and Q75). Enumeration data are reported as frequency (percentage). The two groups of measurement data were compared by independent samples Student's t-test (normal distribution). The Wilcoxon rank sum test was used for data that did not conform to a normal distribution and chi-squared test or Fisher's exact test was used to compare two groups of enumeration data. Paired sample t-test or a signed rank sum test was used to compare paired data. An alpha value of P<0.05 was considered to be significantly different. Receiver operating characteristic (ROC) curves of PPV and IVC-DI were plotted under different TV values. The Youden method was used to determine the threshold values of PPV and IVC-DI and to identify optimal sensitivity and specificity for diagnosing the volume responsiveness of patients. The differences in the area under each ROC curve were compared using the Delong test. SPSS version 24.0 software (USA) was used for all statistical analyses.
Results
Details of the recruited patients at the completion of the study
From June to September 2018, 97 patients that were undergoing elective surgery in the West China Hospital of Sichuan University were included. Finally, 79 patients were selected from the recruited cohort and formally enrolled in the trial. Of these, five patients needed vasoactive drugs to maintain blood pressure and heart rate; two patients had a parasternal five-chamber view image quality score of less than Grade 3; nine patients had an inferior vena cava image quality score of less than Grade 3; and 1 patient had both an parasternal five-chamber view image quality score and inferior vena cava image quality score that was less than Grade 3. In another case, the IVCmin was 2.46 cm before fluid challenge was performed, and the right atrial pressure was higher than normal or volume overload was considered; thus, in this case, no fluid challenge was performed (Figure 4).

Trial grouping and baseline comparisons
Of the 79 patients enrolled, 38 were positive for volume responsiveness. Baseline data are shown in Table 1. There was no significant difference seen in baseline data between the R group and the NR group. Baseline data of both groups were balanced and comparable.
Comparison of baseline values between the R and NR groups
Before the fluid challenge, HR, diastolic blood pressure, systolic blood pressure, MAP, PPV, Ppeak, plateau pressure, the VTI of the left ventricular outflow tract, and IVC-DI were recorded when a TV of 6, 9, and 12 mL/kg ventilations were performed (Tables 2- 4, respectively). It was found that the HR, PPV, and IVC-DI in the NR group were lower than those in the R group, and the VTI and IVCmin in the NR group were higher than those found in the R group.
Influence of fluid challenge in the R and NR groups
After fluid challenge was performed and when the 6 mL/kg TV ventilation was performed, it was observed that the HR, PPV, and IVC-DI were significantly decreased. Additionally, VTI, IVCmax, and IVCmin were significantly increased in both groups. When the tidal volume increased to 9 mL/kg, it was found that the HR, PPV, and IVC-DI in the R group were significantly decreased, and the VTI, IVCmax, and IVCmin values were significantly increased. In the NR group, the PPV and IVC-DI values were significantly decreased, and the IVCmax and IVCmin values were significantly increased; however, there was no significant change in HR and MAP, and such conditions were also seen when a TV=12 mL/kg ventilation was performed.
Effect of TV on PPV and IVC-DI
For the R group, PPV and IVC-DI increased when TV increased from 6 to 9 mL/kg, while PPV increased and IVC-DI decreased when TV increased from 9 to 12 mL/kg. For the NR group, PPV increased with TV and IVC-DI did not change significantly.
ROC curve analysis in the evaluation of the diagnostic utility of PPV and IVC-DI at different tidal volumes
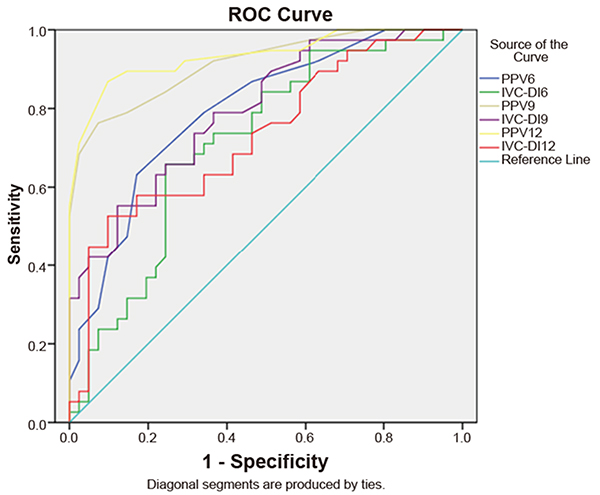
By plotting a receiver operating characteristic curve (Table 5 and Figure 5), when the 6 mL/kg TV ventilation was performed, we can see that the area under the ROC curve of the PPV was 0.79 (95%CI: 0.70, 0.89) and the threshold value was 8.5% (the sensitivity was 55% and the specificity was 83%). The area under the ROC curve of IVC-DI was 0.71 (95%CI: 0.60, 0.83) and the threshold value was 11.1% (the sensitivity was 68% and the specificity was 76%). When 9 mL/kg TV ventilation was performed, the area under the ROC curve (AUROC) of PPV was 0.91 (95%CI: 0.85, 0.98) and the threshold value was 12.5% (the sensitivity was 76% and the specificity was 93%). The AUROC of IVC-DI was 0.79 (95%CI: 0.70, 0.89) and the threshold value was 15.3% (the sensitivity was 55% and specificity was 88%). When 12 mL/kg TV ventilation was performed, AUROC of PPV was 0.93 (95%CI: 0.88, 0.99) and the threshold value was 15.5% (the sensitivity was 87% and the specificity was 90%). The AUROC of IVC-DI was 0.73 (95%CI: 0.62, 0.84) and the threshold value was 13.4% (the sensitivity was 53% and the specificity was 88%).

Receiver operating curve (ROC) of pulse pressure variation (PPV) and inferior vena cava dispensability index (IVC-DI) of three tidal volumes: 6, 9, and 12 mL/kg.
The results of the Delong test (Table 6) showed that Z=2.8 (P=0.005) when the AUROC of PPV9 was compared to PPV6; Z=0.99 (P=0.32) when the AUROC of PPV12 was compared to PPV9; Z=1.87 (P=0.062) when the AUROC of IVC-DI9 was compared to IVC-DI6; Z=-1.63 (P=0.103) when the AUROC of IVC-DI12 was compared to IVC-DI9; Z=-2.28 (P=0.023) when the AUROC of IVC-DI19 was compared to PPV at a TV of 9 mL/kg; and Z=-3.67 (P<0.001) when the AUROC of IVC-DI12 was compared with that of PPV at a TV of 12 mL/kg.
Discussion
Mechanical ventilation causes periodic changes in intrathoracic pressure (ITP), after which the stroke volume (SV) varies periodically. Increased ITP caused by inspiration can be transmitted at least partially to the pericardium, thereby increasing transmural pressure of the right ventricular wall. If the ventricle is in the ascending part of the Frank-Starling curve, periodic changes in ITP can cause periodic changes in ventricular preload and SV (positive volume responsiveness) (33. Miller A, Mandeville J. Predicting and measuring fluid responsiveness with echocardiography. Echo Res Pract 2016; 3: G1–G12, doi: 10.1530/ERP-16-0008.
https://doi.org/10.1530/ERP-16-0008...
). For dynamic indices, which include PPV and IVC-DI, changes in ITP caused by breathing must be sufficiently large to cause periodic changes in cardiac output. Among mechanically ventilated patients, TV was considered a major factor that affected the pleura, pericardial pressure, and right ventricular afterload, and increased TV can shift the Frank-Starling curve to the left (2020. Vieillard-Baron A, Loubieres Y, Schmitt JM, Page B, Dubourg O, Jardin F. Cyclic changes in right ventricular output impedance during mechanical ventilation. J Appl Physiol (1985) 1999; 87: 1644–1650, doi: 10.1152/jappl.1999.87.5.1644.
https://doi.org/10.1152/jappl.1999.87.5....
).
This study found that PPV and IVC-DI displayed a poor diagnostic accuracy for volume responsiveness when the TV was 6 mL/kg, which is concordant with the published results of others (2121. De Backer D, Heenen S, Piagnerelli M, Koch M, Vincent JL. Pulse pressure variations to predict fluid responsiveness: influence of tidal volume. Intensive Care Med 2005; 31: 517–523, doi: 10.1007/s00134-005-2586-4.
https://doi.org/10.1007/s00134-005-2586-...
,2222. Lansdorp B, Lemson J, van Putten MJ, de Keijzer A, van der Hoeven JG, Pickkers P. Dynamic indices do not predict volume responsiveness in routine clinical practice. Br J Anaesth 2012; 108: 395–401, doi: 10.1093/bja/aer411.
https://doi.org/10.1093/bja/aer411...
). This might be because a low TV is insufficient to cause significant periodic changes in ITP, so that the SV is unable to change significantly, which results in PPV, and thus IVC-DI cannot be used as an index for the measurement of volume responsiveness. Moreover, excessive reliance on PPV or IVC-DI can increase the false negative rate when the TV is low (2323. Teboul JL, Monnet X. Pulse pressure variation and ARDS. Minerva Anestesiol 2013; 79: 398–407.,2424. Pinsky MR. Using ventilation-induced aortic pressure and flow variation to diagnose preload responsiveness. Intensive Care Med 2004; 30: 1008–1010, doi: 10.1007/s00134-004-2208-6.
https://doi.org/10.1007/s00134-004-2208-...
).
This study noted that the diagnostic accuracy of PPV for volume responsiveness increased with commensurate increases in the TV. Myatra et al. (2525. Myatra SN, Prabu NR, Divatia JV, Monnet X, Kulkarni AP, Teboul JL. The changes in pulse pressure variation or stroke volume variation after a “tidal volume challenge” reliably predict fluid responsiveness during low tidal volume ventilation. Crit Care Med 2017; 45: 415–421, doi: 10.1097/CCM.0000000000002183.
https://doi.org/10.1097/CCM.000000000000...
) improved the diagnostic accuracy of PPV through a process referred to as “tidal volume challenge”. Similar studies (2626. Reuter DA, Bayerlein J, Goepfert MS, Weis FC, Kilger E, Lamm P, et al. Influence of tidal volume on left ventricular stroke volume variation measured by pulse contour analysis in mechanically ventilated patients. Intensive Care Med 2003; 29: 476–480, doi: 10.1007/s00134-003-1649-7.
https://doi.org/10.1007/s00134-003-1649-...
) have also shown that the accuracy of PPV and SVV in diagnosing volume responsiveness at a TV of 10 mL/kg was significantly higher than that of a TV of 5 mL/kg. When TV increased from 6 to 10 mL/kg, the PPV increased significantly in those with volume responsiveness; however, it was not significant in those without volume responsiveness (2727. Charron C, Fessenmeyer C, Cosson C, Mazoit JX, Hebert JL, Benhamou D, et al. The influence of tidal volume on the dynamic variables of fluid responsiveness in critically ill patients. Anesth Analg 2006; 102: 1511–1517, doi: 10.1213/01.ane.0000209015.21418.f4.
https://doi.org/10.1213/01.ane.000020901...
). Min et al. (2828. Min JJ, Gil NS, Lee JH, Ryu DK, Kim CS, Lee SM. Predictor of fluid responsiveness in the ‘grey zone': augmented pulse pressure variation through a temporary increase in tidal volume. Br J Anaesth 2017; 119: 50–56, doi: 10.1093/bja/aex074.
https://doi.org/10.1093/bja/aex074...
) observed patients that had undergone selective laparotomy under conditions of tracheal intubation and general anesthesia. When patients with a PPV in the grey interval (at 9-13%) were enrolled in the study, the PPV value increased by temporarily adjusting the TV from 8 to 12 mL/kg, thereby increasing the diagnostic value of PPV in the grey interval at a TV of 8 mL/kg.
Therefore, we might consider temporarily increasing the TV to 12 mL/kg to improve the predictive accuracy of PPV for volume responsiveness. However, if patients do not tolerate 12 mL/kg TV, then setting the TV to 9 mL/kg and the threshold value to 12.5% should translate to a diagnostic specificity of 93%, and the PPV can also accurately predict the volume responsiveness.
For IVC-DI, the diagnostic accuracy was optimal when the TV was set at 9 mL/kg. Therefore, when IVC-DI is used as a diagnostic index, there is no justification or need to increase the TV to 12 mL/kg.
This study showed that the diagnostic accuracy of PPV in diagnosing volume responsiveness is superior to that of IVC-DI when the TV values are 9 and 12 mL/kg; however, when the TV is 6 mL/kg, there is no significant difference between the PPV and IVC-DI indices. This result is somewhat concordant with that of a previously published study (2929. Theerawit P, Morasert T, Sutherasan Y. Inferior vena cava diameter variation compared with pulse pressure variation as predictors of fluid responsiveness in patients with sepsis. J Crit Care 2016; 36 246–251, doi: 10.1016/j.jcrc.2016.07.023.
https://doi.org/10.1016/j.jcrc.2016.07.0...
), which set the TV of patients to exceed 8 mL/kg and a PEEP of 8-10 cm H2O. The main conclusion is that PPV offers greater accuracy than IVC-DI in predicting volume responsiveness. Another study (3030. de Oliveira OH, Freitas FG, Ladeira RT, Fischer CH, Bafi AT, Azevedo LC, et al. Comparison between respiratory changes in the inferior vena cava diameter and pulse pressure variation to predict fluid responsiveness in postoperative patients. J Crit Care 2016; 34 46–49, doi: 10.1016/j.jcrc.2016.03.017.
https://doi.org/10.1016/j.jcrc.2016.03.0...
) set the TV to be 8 mL/kg, a value that also resulted in greater accuracy of PPV compared with IVC-DI in predicting volume responsiveness.
The results of this study showed that IVC-DI lacked a sufficiently high value in diagnosing volume responsiveness, which is similar to the results of the meta-analyses previously published by Long et al. (3131. Long E, Oakley E, Duke T, Babl FE. Does respiratory variation in inferior vena cava diameter predict fluid responsiveness: a systematic review and meta-analysis. Shock 2017; 47: 550–559, doi: 10.1097/SHK.0000000000000801.
https://doi.org/10.1097/SHK.000000000000...
) and Orso et al. (3232. Orso D, Paoli I, Piani T, Cilenti FL, Cristiani L, Guglielmo N. Accuracy of ultrasonographic measurements of inferior vena cava to determine fluid responsiveness: a systematic review and meta-analysis. J Intensive Care Med 2018; 885066617752308, doi: 10.1177/0885066617752308.
https://doi.org/10.1177/0885066617752308...
). However, the meta-analysis of Si et al. (3333. Si X, Xu H, Liu Z, Wu J, Cao D, Chen J, et al. Does respiratory variation in inferior vena cava diameter predict fluid responsiveness in mechanically ventilated patients? a systematic review and meta-analysis. Anesth Analg 2018; 127: 1157–1164, doi: 10.1213/ANE.0000000000003459.
https://doi.org/10.1213/ANE.000000000000...
) suggested that IVC-DI was a reliable index in diagnosing volume responsiveness under conditions where the TV ≥ 8 mL/kg and the PEEP ≤ 5 cm H2O. In addition, when compared with a TV < 8 mL/kg or a PEEP > 5 cm H2O, IVC-DI displayed greater sensitivity (0.80 vs 0.66; P=0.02), specificity (0.94 vs 0.68; P<0.001), diagnostic odds ratio (68 vs 4; P<0.001), and AUROC (0.88 vs 0.70; P<0.001).
Based on our findings and the results of other meta-analyses, we suggest that the ventilation mode had a greater impact on the diagnostic accuracy of IVC-DI, and the heterogeneity of IVC-DI was higher due to the different factors of the different meta-analyses, including the disease status of the patient, the “gold standard”, etc. Therefore, when IVC-DI is used in clinical practice, attention should be paid to the specific conditions of the patients and other indices rather than relying solely on a certain preferred or indicated index. Ultrasound has many advantages in clinical practice because of its non-invasive and convenient diagnostic value. A prior study (3434. Vignon P, Repesse X, Begot E, Leger J, Jacob C, Bouferrache K, et al. Comparison of echocardiographic indices used to predict fluid responsiveness in ventilated patients. Am J Respir Crit Care Med 2017; 195: 1022–1032, doi: 10.1164/rccm.201604-0844OC.
https://doi.org/10.1164/rccm.201604-0844...
) suggested that transesophageal ultrasonography for the measurement of superior vena cava variation (ΔSVC) was more accurate than PPV and IVC-DI in diagnosing volume responsiveness. Baron et al. (3535. Vieillard-Baron A, Chergui K, Rabiller A, Peyrouset O, Page B, Beauchet A, et al. Superior vena caval collapsibility as a gauge of volume status in ventilated septic patients. Intensive Care Med 2004; 30: 1734–1739.) also suggested that ΔSVC was better in assessing the volume of mechanically ventilated patients. Therefore, ultrasound has great potential for its utility in clinical practice.
We found that different studies conducted different fluid challenges. In one study (88. Huang CC, Fu JY, Hu HC, Kao KC, Chen NH, Hsieh MJ, et al. Prediction of fluid responsiveness in acute respiratory distress syndrome patients ventilated with low tidal volume and high positive end-expiratory pressure. Crit Care Med 2008; 36: 2810–2816, doi: 10.1097/CCM.0b013e318186b74e.
https://doi.org/10.1097/CCM.0b013e318186...
), 500 mL of a crystal or a colloid solution was used as the standard for fluid challenge. Lanspa et al. (3636. Lanspa MJ, Grissom CK, Hirshberg EL, Jones JP, Brown SM. Applying dynamic parameters to predict hemodynamic response to volume expansion in spontaneously breathing patients with septic shock: reply. Shock 2013; 39: 462, doi: 10.1097/SHK.0b013e318291008e.
https://doi.org/10.1097/SHK.0b013e318291...
) injected crystals according to the metric of 10 mL/kg and the infusion time was less than 20 min. Charbonneau et al. (3737. Charbonneau H, Riu B, Faron M, Mari A, Kurrek MM, Ruiz J, et al. Predicting preload responsiveness using simultaneous recordings of inferior and superior vena cavae diameters. Crit Care 2014; 18: 473, doi: 10.1186/s13054-014-0473-5.
https://doi.org/10.1186/s13054-014-0473-...
) injected 6% hydroxyethyl starch according to the metric of 7 mL/kg and the infusion time was continued for 15 min. In addition, Min et al. (2828. Min JJ, Gil NS, Lee JH, Ryu DK, Kim CS, Lee SM. Predictor of fluid responsiveness in the ‘grey zone': augmented pulse pressure variation through a temporary increase in tidal volume. Br J Anaesth 2017; 119: 50–56, doi: 10.1093/bja/aex074.
https://doi.org/10.1093/bja/aex074...
) injected the crystal solution according to a metric of 6 mL/kg, which was allowed to continue for 10 min.
In 2017, a systematic review and meta-analysis (3838. Toscani L, Aya HD, Antonakaki D, Bastoni D, Watson X, Arulkumaran N, et al. What is the impact of the fluid challenge technique on diagnosis of fluid responsiveness? A systematic review and meta-analysis. Crit Care 2017; 21: 207, doi: 10.1186/s13054-017-1796-9.
https://doi.org/10.1186/s13054-017-1796-...
) included 85 studies (with a total of 3601 patients) and confirmed that the fluid challenge was unaffected by the type of fluid but was instead influenced by the infusion time duration. Another study (3939. Aya HD, Rhodes A, Chis Ster I, Fletcher N, Grounds RM, Cecconi M. Hemodynamic effect of different doses of fluids for a fluid challenge: a quasi-randomized controlled study. Crit Care Med 2017; 45: e161–e168, doi: 10.1097/CCM.0000000000002067.
https://doi.org/10.1097/CCM.000000000000...
) showed that the volume of crystals/colloids also affected the effectiveness of the fluid challenge. Therefore, the fluid challenge in this study was 6 mL/kg of succinyl gelatin and the infusion was permitted to proceed for 10 min to balance the risk of SV change that was caused by an insufficient infusion volume, or by contrast, a volume overload that might be caused by an excessive infusion volume.
Stroke volume can be calculated by the formula SV = VTI × AA, where VTI is left ventricular outflow tract velocity-time integral and AA is aortic area. The aortic area was considered stable throughout the experiment (4040. Airapetian N, Maizel J, Alyamani O, Mahjoub Y, Lorne E, Levrard M, et al. Does inferior vena cava respiratory variability predict fluid responsiveness in spontaneously breathing patients? Crit Care 2015; 19: 400, doi: 10.1186/s13054-015-1100-9.
https://doi.org/10.1186/s13054-015-1100-...
). Thus, an increase or decrease in the VTI might represent an increase or a decrease in the SV, and patients that showed an increased VTI of the left ventricular outflow tract (ΔVTI) of greater than or equal to 15% following the fluid challenge were enrolled in the response group. This can also avoid bias caused by repeated measurements of AA.
Limitations of this study included the following: 1) all patients enrolled in the study were relatively healthy before surgery, thus, this study cannot be generalized to all patients; 2) ultrasound is influenced by personal experience, and the largest and smallest diameter of the inferior vena cava is differentially adjudicated by naked eye inspection, which is clearly a non-objective measurement; 3) the gold-standard for volume responsiveness is a 15% variation in cardiac output as evaluated by invasive methods (i.e., the Swan-Ganz catheter) and, in this investigation, the VTI of the left ventricular outflow tract was used as a surrogate of the cardiac output, which could have greater variability, for example, according to the transducer's angulation in sequential evaluation; 4) twelve patients were excluded because of the imaging quality in the healthy individuals that had undergone elective surgery; in real life situations, and mainly in the setting of critical care, greater attention should be paid to this technical limitation; 5) exclusion of patients that used vasoactive drugs could have inadvertently excluded patients that might present with low blood volume and volume responsiveness.
Conclusions
The accuracy of PPV in predicting volume responsiveness can be increased by increasing the TV. The IVC-DI index can also predict volume responsiveness, at least in part, when the TV is 9 mL/kg. The diagnostic value of PPV was higher than that of IVC-DI. PPV or IVC-DI should not be used solely for fluid management, but in combination with clinical signs and other measured clinical indices. PPV or IVC-DI can only be used as a tool for evaluation and not necessarily as a target for guiding treatment management.
References
-
1Vincent JL, De Backer D. Circulatory shock. N Engl J Med 2013; 369: 1726–1734, doi: 10.1056/NEJMra1208943.
» https://doi.org/10.1056/NEJMra1208943 -
2Rhodes A, Evans LE, Alhazzani W, Levy MM, Antonelli M, Ferrer R, et al. Surviving sepsis campaign: International guidelines for management of sepsis and septic shock: 2016. Intensive Care Med 2017; 43: 304–377, doi: 10.1007/s00134-017-4683-6.
» https://doi.org/10.1007/s00134-017-4683-6 -
3Miller A, Mandeville J. Predicting and measuring fluid responsiveness with echocardiography. Echo Res Pract 2016; 3: G1–G12, doi: 10.1530/ERP-16-0008.
» https://doi.org/10.1530/ERP-16-0008 -
4Brienza N, Giglio MT, Marucci M, Fiore T. Does perioperative hemodynamic optimization protect renal function in surgical patients? A meta-analytic study. Crit Care Med 2009; 37: 2079–2090, doi: 10.1097/CCM.0b013e3181a00a43.
» https://doi.org/10.1097/CCM.0b013e3181a00a43 -
5Arikan AA, Zappitelli M, Goldstein SL, Naipaul A, Jefferson LS, Loftis LL. Fluid overload is associated with impaired oxygenation and morbidity in critically ill children. Pediatr Crit Care Med 2012; 13: 253–258, doi: 10.1097/PCC.0b013e31822882a3.
» https://doi.org/10.1097/PCC.0b013e31822882a3 -
6Micek ST, McEvoy C, McKenzie M, Hampton N, Doherty JA, Kollef MH. Fluid balance and cardiac function in septic shock as predictors of hospital mortality. Crit Care 2013; 17: R246, doi: 10.1186/cc13072.
» https://doi.org/10.1186/cc13072 -
7Yang X, Du B. Does pulse pressure variation predict fluid responsiveness in critically ill patients? A systematic review and meta-analysis. Crit Care 2014; 18: 650, doi: 10.1186/s13054-014-0650-6.
» https://doi.org/10.1186/s13054-014-0650-6 -
8Huang CC, Fu JY, Hu HC, Kao KC, Chen NH, Hsieh MJ, et al. Prediction of fluid responsiveness in acute respiratory distress syndrome patients ventilated with low tidal volume and high positive end-expiratory pressure. Crit Care Med 2008; 36: 2810–2816, doi: 10.1097/CCM.0b013e318186b74e.
» https://doi.org/10.1097/CCM.0b013e318186b74e -
9Levy MM, Macias WL, Vincent JL, Russell JA, Silva E, Trzaskoma B, et al. Early changes in organ function predict eventual survival in severe sepsis. Crit Care Med 2005; 33: 2194–2201, doi: 10.1097/01.CCM.0000182798.39709.84.
» https://doi.org/10.1097/01.CCM.0000182798.39709.84 -
10Rivers E, Nguyen B, Havstad S, Ressler J, Muzzin A, Knoblich B, et al. Early goal-directed therapy in the treatment of severe sepsis and septic shock. N Engl J Med 2001; 345: 1368–1377, doi: 10.1056/NEJMoa010307.
» https://doi.org/10.1056/NEJMoa010307 -
11Lopes MR, Oliveira MA, Pereira VO, Lemos IP, Auler JO Jr, Michard F. Goal-directed fluid management based on pulse pressure variation monitoring during high-risk surgery: a pilot randomized controlled trial. Crit Care 2007; 11: R100, doi: 10.1186/cc6117.
» https://doi.org/10.1186/cc6117 -
12Boyd JH, Forbes J, Nakada TA, Walley KR, Russell JA. Fluid resuscitation in septic shock: a positive fluid balance and elevated central venous pressure are associated with increased mortality. Crit Care Med 2011; 39: 259–265, doi: 10.1097/CCM.0b013e3181feeb15.
» https://doi.org/10.1097/CCM.0b013e3181feeb15 -
13Marik PE, Monnet X, Teboul JL. Hemodynamic parameters to guide fluid therapy. Ann Intensive Care 2011; 1: 1, doi: 10.1186/2110-5820-1-1.
» https://doi.org/10.1186/2110-5820-1-1 -
14Hong DM, Lee JM, Seo JH, Min JJ, Jeon Y, Bahk JH. Pulse pressure variation to predict fluid responsiveness in spontaneously breathing patients: tidal vs. forced inspiratory breathing. Anaesthesia 2014; 69: 717–722, doi: 10.1111/anae.12678.
» https://doi.org/10.1111/anae.12678 -
15Liu X, Fu Q, Mi W, Liu H, Zhang H, Wang P. Pulse pressure variation and stroke volume variation predict fluid responsiveness in mechanically ventilated patients experiencing intra-abdominal hypertension. Biosci Trends 2013; 7: 101–108, doi: 10.5582/bst.2013.v7.2.101.
» https://doi.org/10.5582/bst.2013.v7.2.101 -
16Wyffels PA, Sergeant P, Wouters PF. The value of pulse pressure and stroke volume variation as predictors of fluid responsiveness during open chest surgery. Anaesthesia 2010; 65: 704–709, doi: 10.1111/j.1365-2044.2010.06371.x.
» https://doi.org/10.1111/j.1365-2044.2010.06371.x -
17Bendjelid K, Romand JA. Fluid responsiveness in mechanically ventilated patients: a review of indices used in intensive care. Intensive Care Med 2003; 29: 352–360, doi: 10.1007/s00134-002-1615-9.
» https://doi.org/10.1007/s00134-002-1615-9 -
18Michard F. Changes in arterial pressure during mechanical ventilation. Anesthesiology 2005; 103: 419-428; quiz 449–415, doi: 10.1097/00000542-200508000-00026.
» https://doi.org/10.1097/00000542-200508000-00026 -
19Jakobsen CJ, Torp P, Sloth E. Perioperative feasibility of imaging the heart and pleura in patients with aortic stenosis undergoing aortic valve replacement. Eur J Anaesthesiol 2007; 24: 589–595, doi: 10.1017/S0265021506002328.
» https://doi.org/10.1017/S0265021506002328 -
20Vieillard-Baron A, Loubieres Y, Schmitt JM, Page B, Dubourg O, Jardin F. Cyclic changes in right ventricular output impedance during mechanical ventilation. J Appl Physiol (1985) 1999; 87: 1644–1650, doi: 10.1152/jappl.1999.87.5.1644.
» https://doi.org/10.1152/jappl.1999.87.5.1644 -
21De Backer D, Heenen S, Piagnerelli M, Koch M, Vincent JL. Pulse pressure variations to predict fluid responsiveness: influence of tidal volume. Intensive Care Med 2005; 31: 517–523, doi: 10.1007/s00134-005-2586-4.
» https://doi.org/10.1007/s00134-005-2586-4 -
22Lansdorp B, Lemson J, van Putten MJ, de Keijzer A, van der Hoeven JG, Pickkers P. Dynamic indices do not predict volume responsiveness in routine clinical practice. Br J Anaesth 2012; 108: 395–401, doi: 10.1093/bja/aer411.
» https://doi.org/10.1093/bja/aer411 -
23Teboul JL, Monnet X. Pulse pressure variation and ARDS. Minerva Anestesiol 2013; 79: 398–407.
-
24Pinsky MR. Using ventilation-induced aortic pressure and flow variation to diagnose preload responsiveness. Intensive Care Med 2004; 30: 1008–1010, doi: 10.1007/s00134-004-2208-6.
» https://doi.org/10.1007/s00134-004-2208-6 -
25Myatra SN, Prabu NR, Divatia JV, Monnet X, Kulkarni AP, Teboul JL. The changes in pulse pressure variation or stroke volume variation after a “tidal volume challenge” reliably predict fluid responsiveness during low tidal volume ventilation. Crit Care Med 2017; 45: 415–421, doi: 10.1097/CCM.0000000000002183.
» https://doi.org/10.1097/CCM.0000000000002183 -
26Reuter DA, Bayerlein J, Goepfert MS, Weis FC, Kilger E, Lamm P, et al. Influence of tidal volume on left ventricular stroke volume variation measured by pulse contour analysis in mechanically ventilated patients. Intensive Care Med 2003; 29: 476–480, doi: 10.1007/s00134-003-1649-7.
» https://doi.org/10.1007/s00134-003-1649-7 -
27Charron C, Fessenmeyer C, Cosson C, Mazoit JX, Hebert JL, Benhamou D, et al. The influence of tidal volume on the dynamic variables of fluid responsiveness in critically ill patients. Anesth Analg 2006; 102: 1511–1517, doi: 10.1213/01.ane.0000209015.21418.f4.
» https://doi.org/10.1213/01.ane.0000209015.21418.f4 -
28Min JJ, Gil NS, Lee JH, Ryu DK, Kim CS, Lee SM. Predictor of fluid responsiveness in the ‘grey zone': augmented pulse pressure variation through a temporary increase in tidal volume. Br J Anaesth 2017; 119: 50–56, doi: 10.1093/bja/aex074.
» https://doi.org/10.1093/bja/aex074 -
29Theerawit P, Morasert T, Sutherasan Y. Inferior vena cava diameter variation compared with pulse pressure variation as predictors of fluid responsiveness in patients with sepsis. J Crit Care 2016; 36 246–251, doi: 10.1016/j.jcrc.2016.07.023.
» https://doi.org/10.1016/j.jcrc.2016.07.023 -
30de Oliveira OH, Freitas FG, Ladeira RT, Fischer CH, Bafi AT, Azevedo LC, et al. Comparison between respiratory changes in the inferior vena cava diameter and pulse pressure variation to predict fluid responsiveness in postoperative patients. J Crit Care 2016; 34 46–49, doi: 10.1016/j.jcrc.2016.03.017.
» https://doi.org/10.1016/j.jcrc.2016.03.017 -
31Long E, Oakley E, Duke T, Babl FE. Does respiratory variation in inferior vena cava diameter predict fluid responsiveness: a systematic review and meta-analysis. Shock 2017; 47: 550–559, doi: 10.1097/SHK.0000000000000801.
» https://doi.org/10.1097/SHK.0000000000000801 -
32Orso D, Paoli I, Piani T, Cilenti FL, Cristiani L, Guglielmo N. Accuracy of ultrasonographic measurements of inferior vena cava to determine fluid responsiveness: a systematic review and meta-analysis. J Intensive Care Med 2018; 885066617752308, doi: 10.1177/0885066617752308.
» https://doi.org/10.1177/0885066617752308 -
33Si X, Xu H, Liu Z, Wu J, Cao D, Chen J, et al. Does respiratory variation in inferior vena cava diameter predict fluid responsiveness in mechanically ventilated patients? a systematic review and meta-analysis. Anesth Analg 2018; 127: 1157–1164, doi: 10.1213/ANE.0000000000003459.
» https://doi.org/10.1213/ANE.0000000000003459 -
34Vignon P, Repesse X, Begot E, Leger J, Jacob C, Bouferrache K, et al. Comparison of echocardiographic indices used to predict fluid responsiveness in ventilated patients. Am J Respir Crit Care Med 2017; 195: 1022–1032, doi: 10.1164/rccm.201604-0844OC.
» https://doi.org/10.1164/rccm.201604-0844OC -
35Vieillard-Baron A, Chergui K, Rabiller A, Peyrouset O, Page B, Beauchet A, et al. Superior vena caval collapsibility as a gauge of volume status in ventilated septic patients. Intensive Care Med 2004; 30: 1734–1739.
-
36Lanspa MJ, Grissom CK, Hirshberg EL, Jones JP, Brown SM. Applying dynamic parameters to predict hemodynamic response to volume expansion in spontaneously breathing patients with septic shock: reply. Shock 2013; 39: 462, doi: 10.1097/SHK.0b013e318291008e.
» https://doi.org/10.1097/SHK.0b013e318291008e -
37Charbonneau H, Riu B, Faron M, Mari A, Kurrek MM, Ruiz J, et al. Predicting preload responsiveness using simultaneous recordings of inferior and superior vena cavae diameters. Crit Care 2014; 18: 473, doi: 10.1186/s13054-014-0473-5.
» https://doi.org/10.1186/s13054-014-0473-5 -
38Toscani L, Aya HD, Antonakaki D, Bastoni D, Watson X, Arulkumaran N, et al. What is the impact of the fluid challenge technique on diagnosis of fluid responsiveness? A systematic review and meta-analysis. Crit Care 2017; 21: 207, doi: 10.1186/s13054-017-1796-9.
» https://doi.org/10.1186/s13054-017-1796-9 -
39Aya HD, Rhodes A, Chis Ster I, Fletcher N, Grounds RM, Cecconi M. Hemodynamic effect of different doses of fluids for a fluid challenge: a quasi-randomized controlled study. Crit Care Med 2017; 45: e161–e168, doi: 10.1097/CCM.0000000000002067.
» https://doi.org/10.1097/CCM.0000000000002067 -
40Airapetian N, Maizel J, Alyamani O, Mahjoub Y, Lorne E, Levrard M, et al. Does inferior vena cava respiratory variability predict fluid responsiveness in spontaneously breathing patients? Crit Care 2015; 19: 400, doi: 10.1186/s13054-015-1100-9.
» https://doi.org/10.1186/s13054-015-1100-9
Publication Dates
-
Publication in this collection
29 Aug 2019 -
Date of issue
2019
History
-
Received
21 May 2019 -
Accepted
24 June 2019