Abstracts
A mathematical model to predict microbial growth in milk was developed and analyzed. The model consists of a system of two differential equations of first order. The equations are based on physical hypotheses of population growth. The model was applied to five different sets of data of microbial growth in dairy products selected from Combase, which is the most important database in the area with thousands of datasets from around the world, and the results showed a good fit. In addition, the model provides equations for the evaluation of the maximum specific growth rate and the duration of the lag phase which may provide useful information about microbial growth.
predictive microbiology; dairy products; food safety
Neste trabalho, um modelo matemático que descreve o crescimento de populações de microrganismos no leite foi desenvolvido, aplicado e validado. Para este fim, foi proposto um sistema de duas equações diferenciais de primeira ordem, as quais descreveram hipóteses físicas do crescimento de populações. O modelo foi aplicado para dados de crescimento de cinco diferentes microrganismos em produtos lácteos retirados da Combase, a qual contém uma grande quantidade de dados referentes ao crescimento de microrganismos nos mais diversos alimentos, e os resultados indicaram um bom ajuste com coeficiente de determinação superior a 0,99 para todos os dados. A partir dos parâmetros do modelo, foi possível estimarem-se os valores da taxa de crescimento máxima e a duração da fase lag, os quais podem fornecer informações importantes sobre o comportamento do microrganismo estudado.
microbiologia preditiva; produtos lácteos; segurança alimentar
ORIGINAL
Mathematical modeling of microbial growth in milk
Modelagem matemática do crescimento de populações de microrganismos no leite
Jhony Tiago Teleken; Weber da Silva Robazza* * Corresponding author ; Gilmar de Almeida Gomes
Departamento de Engenharia de Alimentos, Centro de Educação Superior do Oeste, Universidade do Estado de Santa Catarina - UDESC, CP 45, CEP 89801-973, Chapecó, SC, Brazil, e-mail: wrobazzi@yahoo.com.br
ABSTRACT
A mathematical model to predict microbial growth in milk was developed and analyzed. The model consists of a system of two differential equations of first order. The equations are based on physical hypotheses of population growth. The model was applied to five different sets of data of microbial growth in dairy products selected from Combase, which is the most important database in the area with thousands of datasets from around the world, and the results showed a good fit. In addition, the model provides equations for the evaluation of the maximum specific growth rate and the duration of the lag phase which may provide useful information about microbial growth.
Keywords: predictive microbiology; dairy products; food safety.
RESUMO
Neste trabalho, um modelo matemático que descreve o crescimento de populações de microrganismos no leite foi desenvolvido, aplicado e validado. Para este fim, foi proposto um sistema de duas equações diferenciais de primeira ordem, as quais descreveram hipóteses físicas do crescimento de populações. O modelo foi aplicado para dados de crescimento de cinco diferentes microrganismos em produtos lácteos retirados da Combase, a qual contém uma grande quantidade de dados referentes ao crescimento de microrganismos nos mais diversos alimentos, e os resultados indicaram um bom ajuste com coeficiente de determinação superior a 0,99 para todos os dados. A partir dos parâmetros do modelo, foi possível estimarem-se os valores da taxa de crescimento máxima e a duração da fase lag, os quais podem fornecer informações importantes sobre o comportamento do microrganismo estudado.
Palavras-chave: microbiologia preditiva; produtos lácteos; segurança alimentar.
1 Introduction
Milk is defined as the result of milking process conducted in hygienic conditions of healthy cows (BRAZIL, 2002). It is a good source of nutrients such as proteins, vitamins, and mineral salts not only for mammals but also for a number of microorganisms which can grow in milk.
Due to its chemical composition, milk is highly nutritious, possesses a neutral or slightly acid pH and high moisture content, and therefore allows the growth of a wide range of microorganisms (FRANCO; LANDGRAF, 2007). This microbial growth induces changes in the taste and odor of milk such as sour, putrid, bitter, malty, fruity, rancid, and unclean. During milking, microorganisms can enter the milk from the skin of the teats, which are often contaminated by dung, soil, or dust. Appropriate housing and care of the cows is an essential measure to promote clean udders (SANTOS; FONSECA, 2001).
The control of the processing, packaging, distribution, and storage conditions is of major significance for the safety assurance of pasteurized milk. During these stages, dairy products may become potentially unsafe due to presence of pathogenic microorganisms (FRANCO; LANDGRAF, 2007). Consequently, the presence of pathogens should be continuously monitored during the transportation of raw milk until the dairy plant. However, this task is virtually impossible to be accomplished because the traditional approach of enumerating microbes in these different stages of food processing, is slow and expensive. Therefore, classical microbial evaluation of especially perishable foods is of limited value for predictive prognoses since these foods are sold or eaten before the results of microbiological tests are available.
An alternative approach is to rely on the hypothesis that some controlling factors of microbial growth such as temperature, pH, and water activity can be measured and modeled, and the result indicates how much growth can be attributed to those factors. If the differences between the calculated and observed responses are significant, other factors have to be taken into account (NAKASHIMA; ANDRÉ; FRANCO, 2000). The models allow the prediction of microbial safety or shelf life of products, the detection of critical parts of the production and distribution process, and the optimization of production and distribution chains (ZWIETERING et al., 1990). One important point that must be considered in modeling microbial growth is the duration of the lag and exponential phases. After these stages of microbial growth, spoilage is observed for most food products (NAKASHIMA; ANDRÉ; FRANCO, 2000).
Predictive microbiology is an area of food microbiology which has come to be known in the last two decades, and in the last ten years, hundreds of papers have been published with the keyword predictive microbiology. It puts emphasis on the need to describe the microbial responses to different food environments by mathematical models. The most commonly used models are the modified logistic model (GIBSON; BRATCHELL; ROBERTS, 1987), the modified Gompertz model (GIBSON; BRATCHELL; ROBERTS, 1987), and the Baranyi model (BARANYI et al., 1993; BARANYI; ROBERTS, 1994).
These and other mathematical models have been extensively used to describe the growth and inactivation of many microorganisms exposed to different environmental conditions in dairy products. For instance, a recent study has described how predictive modeling can assist in minimizing the growth of Bacillus cereus spores in farm tank milk (VISSERS et al., 2007). Chen and Hoover (2003) modeled the combined effect of high hydrostatic pressure and mild heat on the inactivation kinetics of Listeria monocytogenes Scott A in whole milk. Guan, Chen and Hoover (2005) studied the influence of high hydrostatic pressure on the inactivation of Salmonella typhimurium DT 104 in UHT whole milk. Zwietering et al. (1996) estimated the occurrence of Bacillus cereus in pasteurized milk at the point of consumption. In another paper, Chen (2007) used mathematical functions to model pressure inactivation of seven foodborne pathogens in ultra high-temperature (UHT) whole milk. Le Marc, Valík and Medved'ová (2009) studied the competitive growth of a starter culture of lactic acid bacteria and Staphylococcus aureus in milk, while Fujikawa and Morozumi (2006) modeled Staphylococcus aureus growth and enterotoxin production in liquid milk. In addition, Ndagijimana et al. (2008) evaluated the growth of a mould in yoghurt. Recently, a review provided an overview of the interactions between different modeling approaches and the use and applications of predictive microbiology techniques for the control of dairy product manufacture throughout the supply chain (ROUPAS, 2008).
The main objective of this paper was to propose and evaluate a mathematical model that describes microbial growth in dairy products. In order to test the ability of the model to deal with experimental data, five different datasets of microbial growth in dairy products were selected from Combase (www.combase.cc), which is the most important database in the area. The parameters obtained were used to estimate the duration of the lag and exponential phases of the microorganisms studied.
2 Materials and methods
2.1 Model description
A number of mathematical functions have been proposed which describe sigmoid curves and have been used to model the growth of microbial curves. In this study, a system composed by two differential equations was employed. The first differential equation consists of the most elementary model building block describing microbial evolution (VAN IMPE et al., 2005) and is written as:

where N(t) represents the cell density of microorganisms and µ(N) defines its specific growth rate. The second differential equation describes the density dependence of the specific growth rate. The model is based on the assumption that µ(N) is a decreasing function of the population, due to accumulation of waste metabolites within the environment. It is proposed in Equation 2 that the decrease obeys a power law.

where α is a positive parameter, which is assumed to depend only on the environmental variables and not on the particular microorganism under consideration. The parameter m is assumed to depend only on the microorganism and not on the environmental variables.
The following analytical solution can be derived for the model composed by Equations 1 and 2 with the initial conditions N(0) = N0 and µ(N0) = µ0:

Model simulations were performed while varying only the parameters m and α and keeping the other two constant. Results are shown in Figure 1. It can be seen that the maximum population attained during growth, Nf, is independent of m. This parameter affects only the duration of the exponential phase. It is observed that high values of m decreases the duration of the exponential phase.
As previously mentioned, the value of Nf is not affected by the parameter m. Actually, the main parameter influencing the asymptote of the curve is α. Therefore, it should be possible to insert Nf explicitly in Equation 3 in replacement of the parameter α. Using this procedure, it can be shown that both Equations 4 and 5 hold:

Equation 5 expresses the microbial load, N(t), as a function of population parameters as the initial population, N0, and the final population, Nf. It should be noted that when m = -1, Equation 5 is similar to a re-parameterized version of the Gompertz Equation, and when m = 0, it is similar to a re-parameterized version of the Logistic Equation. It can be shown that Equation 5 is a re-parameterized version of the Richards growth model (RICHARDS, 1959). Its application is useful for static environmental conditions (e.g. constant temperature and pH). When dealing with dynamic conditions, such as variable temperature, Equation 3 should be used, and the square root dependence of growth rate on temperature (RATKOWSKY et al. 1982, 1983) should be explicitly included in the parameter α, which is assumed to be dependent on environmental parameters. In this study, it was considered only isothermal growth, and Equation 5 was fitted to experimental data. In addition, the population, N(t), was replaced by log N(t), like in the modified Gompertz equation.
2.2 Experimental data
Experimental data of growth of five different microorganisms in dairy products were taken from Combase (www.combase.cc). Datasets used in this study can be obtained using the following Id codes in the database:
Listeria monocytogenes: Buchanan_91a
Pseudomonas: AFSCE
Yersinia enterocolitica: FSA-CCFRA
Shigella flexneri: Zaika_98
Bacillus cereus: STU-BA
The fitting process was conducted using the computer software Origin 6.0. The fitted parameters were used to determine the maximum growth rate, µmax, of each microorganism. This parameter corresponds to the point of inflection of the curve described by Equation 5 and is given (with m '" -1) by:

A parameter which may be useful to the food industry is the time taken to initial population increase β times, tβ, (e.g., the doubling time is obtained by using β = 2). This parameter can be deduced from Equation 5 and is written as (with m -1):
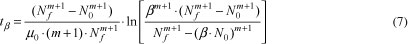
Another important parameter to food microbiologists is the duration of the lag phase, tlag. An important point to be addressed is that its own definition is somewhat arbitrary. As a result, different definitions of this parameter can be found in the literature. One of the initial definitions of tlag was obtained using the time for the initial population density to increase twofold (BUCHANAN; SOLBERG, 1972) (i.e., β = 2 in Equation 7). A widespread definition consists in quantifying tlag as the time obtained by extrapolating the tangent at the exponential part of the growth curve, back to the inoculum level (SWINNEN et al., 2004; RODRIGUES, 2005), as can be seen in Figure 2.
Some authors sought a more rigorous approach and defined the end of the lag phase, tlag, as the point of inflection on the rising part of the growth curve, which can be interpreted as the point of maximum acceleration on growth (BUCHANAN; CYGNAROWICZ, 1990). The time corresponding to this point can be read from the graph or can be solved mathematically by equating the third derivative of Equation 5 to zero. There is a second point on the curve which can be interpreted as the point of maximum deceleration of growth and is considered in this study as the end of the exponential phase, texp. This suggests that the curve of acceleration growth can be used to calculate the duration of the exponential growth phase by determining the difference in time between the minimum and maximum points (see Figure 3). This procedure was used in this study.
The calculations comprised the following steps:
1) Fit of experimental data selected from Combase using the curve-fitting software Origin 6.0.
2) Use of the fitted parameters to calculate µmax using Equation 6.
3) Use of the fitted parameters to calculate tβ for different values of β using Equation 7.
4) Use of the fitted parameters to plot the acceleration growth curve, , using the mathematical software Mathcad 2000. This curve was used to calculate tlag and texp.
5) Determination of the parameter A defined as A = log Nf -log N0, which corresponds to the logarithmic growth of the population.
3 Results and discussion
3.1 Results
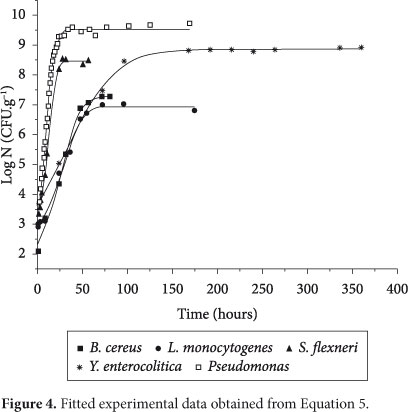
Figure 4 shows fitted curves for the five microorganisms used in this paper. As can be seen, the determination coefficient was higher than 0.99, which indicates a good fit.
The results obtained are summarized in Tables 1, 2, and 3 . Table 1 presents fitted parameters using Equation 5 for each microorganism. Table 2 presents important biological parameters ( µmax, A, tlag, and texp), which were derived following the procedure described in Section 3. Finally, Table 3 shows the results obtained for the parameter tβ using Equation 7. The following values of β were used: 1.1 (10% rise of initial population); 1.25 (25%); 1.5 (50%); 1.75 (75%); 2 (100%); 2.25 (125%), and 2.5 (150%).
3.2 Discussion
As can be seen in Figure 4, the lag phase for some microorganisms is not sharply present. However, the procedure adopted in this study allows explicit calculation of tlag, and, as can be seen in Table 2, the values obtained for both the duration of the lag phase and the duration of the exponential phase were consistent with a visual analysis of Figure 4: higher values of µmax were observed for Pseudomonas and Shigella flexneri; higher values of texp were observed for Yersinia enterocolitica and Listeria monocytogenes; and higher values of tlag were observed for Listeria monocytogenes and Bacillus cereus.
In addition, values of tβ may be very useful for estimating the shelf-life of food products, and this parameter should be taken into account when a critical level of microorganisms to food safety is to be considered. The results obtained for this parameter were close to those obtained for Zwietering et al. (1996), which estimated the storage time of Bacillus cereus in pasteurized milk (giving the level of log(N) as 5) at 12 °C as being 1.2 days (tβ = 28 hours in Table 3 ). Wu et al. (2002) obtained experimentally the value of 24 hours for a 5.67 increase of Shigella flexneri in a reconstituted infant formula used to replace breast milk for infants 0.5 months to one year of age, which is lower than the value that would be obtained using Table 3 . Gougouli, Angelidis and Koutsoumanis (2008), in a study conducted with ice-creams using the Baranyi model, obtained values of µmax for the growth of Listeria monocytogenes at different temperatures ranging between 0.016/h to 0.146/h, which is consistent with the results of this study. Similar behavior was observed for Duyvestein et al. (2001), who calculated µmax for total aerobic and psychrotrophic bacteria in milk ranging between 0.024/h and 0.108/h. Conte et al. (2007) used a new version of the modified Gompertz model to estimate the shelf-life of mozzarella cheese and their results for µmax and tlag were higher than those obtained in this study. It should be noted that comparing directly results obtained in this research with other studies is not an easy task because the parameters are strongly dependent on environmental conditions and the strain of the microorganism being studied. However, some insights about the kinetic behavior of pathogen microorganisms in milk can be provided.
4 Conclusions
A mathematical model that describes microbial growth curves in food products was presented. Published data from growth of five different microorganisms in dairy products were fitted with the model, and the results showed good agreement between theory and experiment. In addition to other models found in the literature, the model developed in this study furnishes estimates of biological parameters such as the duration of the lag phase, the duration of the exponential phase, and the maximum specific growth rate. In the present study, it was proposed the use of a new parameter related to the amount of time it takes a population to increase to a given amount, which may be useful to the food industry. In order to test the ability of the model to deal with new situations that were not tested in the derivation of the model, such as time-varying temperature conditions, further studies are necessary. Currently, the model is being adapted to reproduce dynamic temperature conditions.
Received 22/12/2009
Accepted 3/11/2010 (004597)
- BARANYI, J.; ROBERTS, T. A. A dynamic approach to predicting bacterial growth in food. International Journal of Food Microbiology, v. 23, p. 277-294, 1994. http://dx.doi.org/10.1016/0168-1605(94)90157-0
- BARANYI, J.; ROBERTS, T. A.; MCCLURE, P. A non-autonomous differential equation to model bacterial growth. Food Microbiology, v. 10, p. 43-59, 1993. http://dx.doi.org/10.1006/fmic.1993.1005
- BRAZIL. Instrução Normativa nº 51, de 18 de setembro de 2002. Regulamento Técnico de Produção, Identidade e Qualidade de Leite Tipo A, Tipo B, Tipo C e Cru. Diário Oficial da República Federativa do Brasil, Brasília, DF, 29 set. 2002. Seção 1, p. 13.
- BUCHANAN, R. L.; CYGNAROWICZ, M. L. A mathematical approach toward defining and calculating the duration of the lag phase. Food Microbiology, v. 7, p. 237-240, 1990. http://dx.doi.org/10.1016/0740-0020(90)90029-H
- BUCHANAN, R. L.; SOLBERG, M. Interaction of sodium nitrite, oxygen and pH on growth of Staphylococcus aureus Journal of Food Science, v. 37, p. 81-85, 1972. http://dx.doi.org/10.1111/j.1365-2621.1972.tb03391.x
- CHEN, H. Use of linear, Weibull, and log-logistic functions to model pressure inactivation of seven foodborne pathogens in milk. Food Microbiology, v. 24, p. 197-204, 2007. PMid:17188197. http://dx.doi.org/10.1016/j.fm.2006.06.004
- CHEN, H.; HOOVER, D. G. Modeling the combined effect of high hydrostatic pressure and mild heat on the inactivation kinetics of Listeria monocytogenes Scott A in whole milk. Innovative Food Science & Emerging Technologies, v. 4, p. 25-34, 2003. http://dx.doi.org/10.1016/S1466-8564(02)00083-8
- CONTE, A. et al. Active Packaging Systems to Prolong the Shelf Life of Mozzarella Cheese. Journal of Dairy Science, v. 90, p. 2126-2131, 2007. PMid:17430909. http://dx.doi.org/10.3168/jds.2006-709
- DUYVESTEIN, W. S.; SHIMONI, E.; LABUZA, T. P. Determination of the End of Shelf-life for Milk using Weibull Hazard Method. Lebensmittel-Wissenschaft und-Technologie - Food Science and Technology, v. 34, p. 143-148, 2001.
- FRANCO, B. D. G. M.; LANDGRAF, M. Microbiologia dos alimentos São Paulo: Atheneu, 2007. 182 p.
- FUJIKAWA, H.; MOROZUMI, S. Modeling Staphylococcus aureus growth and enteroxin production in milk. Food Microbiology, v. 23, p. 260-267, 2006. PMid:16943012. http://dx.doi.org/10.1016/j.fm.2005.04.005
- GIBSON, A. M.; BRATCHELL, N.; ROBERTS, T. A. The effect of NaCl and temperature on the rate and extent of growth of Clostridium botulinum type A in pasteurized pork slurry. Journal of Applied Bacteriology, v. 62, p. 479-490, 1987. http://dx.doi.org/10.1111/j.1365-2672.1987.tb02680.x
- GOUGOULI, M.; ANGELIDIS, A. S.; KOUTSOUMANIS, K. A Study on the Kinetic Behavior of Listeria monocytogenes in Ice Cream Stored Under Static and Dynamic Chilling and Freezing Conditions. Journal of Dairy Science, v. 91, p. 523-530, 2008. PMid:18218738. http://dx.doi.org/10.3168/jds.2007-0255
- GUAN, D.; CHEN, H.; HOOVER, D. G. Inactivation of Salmonella typhimurium DT 104 in UHT whole milk by high hydrostatic pressure. International Journal of Food Microbiology, v. 164, p. 145-153, 2005. PMid:16099523. http://dx.doi.org/10.1016/j.ijfoodmicro.2005.01.014
- LE MARC, Y.; VALÍK, L.; MEDVED'OVÁ, A. Modelling the effect of the starter culture on the growth of Staphylococcus aureus in milk. International Journal of Food Microbiology, v. 129, p. 306-311, 2009. PMid:19157613. http://dx.doi.org/10.1016/j.ijfoodmicro.2008.12.015
- NAKASHIMA, S. M. K.; ANDRÉ, C. D. S.; FRANCO, B. D. G. M. Revisão: Aspectos Básicos da Microbiologia Preditiva. Brazilian Journal of Food Technology, v. 3, p. 41-51, 2000.
- NDAGIJIMANA, M. et al. Growth and metabolites production by Penicillium brevicompactum in yoghurt. International Journal of Food Microbiology, v. 127, p. 276-283, 2008. PMid:18783842. http://dx.doi.org/10.1016/j.ijfoodmicro.2008.07.019
- RATKOWSKY, D. A. et al. Relationship Between Temperature and Growth Rate of Bacterial Cultures. Journal of Bacteriology, v. 154, n. 1, p. 1222-1226, 1982.
- RATKOWSKY, D. A. et al. Model for Bacterial Culture Growth Rate Throughout the Entire Biokinetic Temperature Range. Journal of Bacteriology, v. 154, n. 3, p. 1222-1226, 1983. PMid:6853443. PMCid:217594.
- RICHARDS, F. J. A flexible growth function for empirical use. Journal of Experimental Botany, v. 10, p. 290-300, 1959. http://dx.doi.org/10.1093/jxb/10.2.290
- RODRIGUES, R. C. Condições de Cultura para a Produção de Poli (3-Hidroxibutirato) a partir de Resíduos de Indústrias de Alimentos 2005. 100 f. Dissertação (Mestrado em Engenharia de Alimentos)-Faculdade de Engenharia de Alimentos, Universidade Federal de Santa Catarina, Florianópolis, 2005.
- ROUPAS, P. Predictive modelling of dairy manufacturing processes. International Dairy Journal, v. 18, p. 741-753, 2008. http://dx.doi.org/10.1016/j.idairyj.2008.03.009
- SANTOS, M. V.; FONSECA, L. F. L. Importância e efeito de bactérias psicrotróficas sobre a qualidade do leite. Revista Higiene Alimentar, v. 15, n. 82, p. 13-19, 2001.
- SWINNEN, I. A. M. et al. Predictive modelling of the microbial lag phase: a review. International Journal of Food Microbiology, v. 94, p. 137-159, 2004. PMid:15193801. http://dx.doi.org/10.1016/j.ijfoodmicro.2004.01.006
- VAN IMPE, J. F. et al. Towards a novel class of predictive microbial growth models. International Journal of Food Microbiology, v. 100, p. 97-105, 2005. PMid:15854696. http://dx.doi.org/10.1016/j.ijfoodmicro.2004.10.007
- VISSERS, M. M. M. et al. Predictive Modeling of Bacillus cereus spores in farm tank milk during grazing and housing periods. Journal of Dairy Science, v. 80, p. 281-292, 2007. http://dx.doi.org/10.3168/jds.S0022-0302(07)72629-2
- WU, F. M. et al. Survival and growth of Shigella flexneri, Salmonella enterica serovar Enteridis, and Vibrio cholerae 01 in reconstituted infant formula. American Journal of Tropical Medicine and Hygiene, v. 66, p. 782-786, 2002. PMid:12224592.
- ZWIETERING, M. H.; DE WIT, J. C.; NOTERMANS, S. Application of predictive microbiology to estimate the number of Bacillus cereus in pasteurized milk at the point of consumption. International Journal of Food Microbiology, v. 30, p. 55-70, 1996. http://dx.doi.org/10.1016/0168-1605(96)00991-9
- ZWIETERING, M. H. et al. Modeling of the Bacterial Growth Curve. Applied and Environmental Microbiology, v. 56, n. 6, p. 1875-1881, 1990. PMid:16348228. PMCid:184525.

Publication Dates
-
Publication in this collection
06 Feb 2012 -
Date of issue
Dec 2011
History
-
Received
22 Dec 2009 -
Accepted
03 Nov 2010