Abstracts
The DNA extraction is a critical step in Genetically Modified Organisms analysis based on real-time PCR. In this study, the CTAB and DNeasy methods provided good quality and quantity of DNA from the texturized soy protein, infant formula, and soy milk samples. Concerning the Certified Reference Material consisting of 5% Roundup Ready® soybean, neither method yielded DNA of good quality. However, the dilution test applied in the CTAB extracts showed no interference of inhibitory substances. The PCR efficiencies of lectin target amplification were not statistically different, and the coefficients of correlation (R²) demonstrated high degree of correlation between the copy numbers and the threshold cycle (Ct) values. ANOVA showed suitable adjustment of the regression and absence of significant linear deviations. The efficiencies of the p35S amplification were not statistically different, and all R² values using DNeasy extracts were above 0.98 with no significant linear deviations. Two out of three R² values using CTAB extracts were lower than 0.98, corresponding to lower degree of correlation, and the lack-of-fit test showed significant linear deviation in one run. The comparative analysis of the Ct values for the p35S and lectin targets demonstrated no statistical significant differences between the analytical curves of each target.
DNA extraction; genetically modified organisms; GMO; food analysis; real-time PCR; linearity
A extração de DNA é uma etapa crítica na análise de organismos geneticamente modificados em alimentos por PCR em tempo real. Neste trabalho, os métodos CTAB e DNeasy forneceram preparações de DNA em quantidade e com qualidade a partir de amostras de proteína texturizada de soja, fórmula infantil e extrato de soja. Em relação ao Material de Referência Certificado contendo 5% de soja RoundupReady® , nenhum dos métodos forneceu DNA de boa qualidade. Entretanto, o teste de diluição realizado nos extratos de CTAB não demonstrou interferência de substâncias inibidoras. As eficiências das amplificações do alvo lectin não foram estatisticamente diferentes e os coeficientes de correlação (R²) demonstraram alto grau de correlação entre o número de cópias e os valores de Ct. A ANOVA demonstrou ajuste das curvas de regressão e ausência de desvios significativos. As eficiências das amplificações do alvo p35S, utilizando extratos DNeasy, não foram estatisticamente diferentes e os valores de R² ficaram acima de 0,98, sem desvios de linearidade. Dois valores de R², utilizando extratos CTAB, foram menores que 0,98, correspondendo a menor grau de correlação edesvio de linearidade em uma corrida. A análise comparativa dos Cts dos alvos p35S e lectin não demonstrou diferenças significativas entre as curvas analíticas da amplificação de cada alvo.
extração de DNA; organismos geneticamente modificados; OGM; análise de alimentos; PCR em tempo real; linearidade
Use of real-time PCR to evaluate two DNA extraction methods from food
Utilização da técnica de PCR em tempo real para avaliação de dois métodos de extração de DNA a partir de alimentos
Maria Regina Branquinho* * Corresponding author ; Renata Trotta Barroso Ferreira; Paola Cardarelli-Leite
Instituto Nacional de Controle de Qualidade em Saúde, Fundação Oswaldo Cruz - FIOCRUZ, Av. Brasil, 4365, Manguinhos, CEP 22045-900, Rio de Janeiro, RJ, Brasil, e-mail: regina.branquinho@incqs.fiocruz.br
ABSTRACT
The DNA extraction is a critical step in Genetically Modified Organisms analysis based on real-time PCR. In this study, the CTAB and DNeasy methods provided good quality and quantity of DNA from the texturized soy protein, infant formula, and soy milk samples. Concerning the Certified Reference Material consisting of 5% Roundup Ready® soybean, neither method yielded DNA of good quality. However, the dilution test applied in the CTAB extracts showed no interference of inhibitory substances. The PCR efficiencies of lectin target amplification were not statistically different, and the coefficients of correlation (R2) demonstrated high degree of correlation between the copy numbers and the threshold cycle (Ct) values. ANOVA showed suitable adjustment of the regression and absence of significant linear deviations. The efficiencies of the p35S amplification were not statistically different, and all R2 values using DNeasy extracts were above 0.98 with no significant linear deviations. Two out of three R2 values using CTAB extracts were lower than 0.98, corresponding to lower degree of correlation, and the lack-of-fit test showed significant linear deviation in one run. The comparative analysis of the Ct values for the p35S and lectin targets demonstrated no statistical significant differences between the analytical curves of each target.
Keywords: DNA extraction; genetically modified organisms; GMO; food analysis; real-time PCR; linearity.
RESUMO
A extração de DNA é uma etapa crítica na análise de organismos geneticamente modificados em alimentos por PCR em tempo real. Neste trabalho, os métodos CTAB e DNeasy forneceram preparações de DNA em quantidade e com qualidade a partir de amostras de proteína texturizada de soja, fórmula infantil e extrato de soja. Em relação ao Material de Referência Certificado contendo 5% de soja RoundupReady® , nenhum dos métodos forneceu DNA de boa qualidade. Entretanto, o teste de diluição realizado nos extratos de CTAB não demonstrou interferência de substâncias inibidoras. As eficiências das amplificações do alvo lectin não foram estatisticamente diferentes e os coeficientes de correlação (R2) demonstraram alto grau de correlação entre o número de cópias e os valores de Ct. A ANOVA demonstrou ajuste das curvas de regressão e ausência de desvios significativos. As eficiências das amplificações do alvo p35S, utilizando extratos DNeasy, não foram estatisticamente diferentes e os valores de R2 ficaram acima de 0,98, sem desvios de linearidade. Dois valores de R2, utilizando extratos CTAB, foram menores que 0,98, correspondendo a menor grau de correlação edesvio de linearidade em uma corrida. A análise comparativa dos Cts dos alvos p35S e lectin não demonstrou diferenças significativas entre as curvas analíticas da amplificação de cada alvo.
Palavras-chave: extração de DNA; organismos geneticamente modificados; OGM; análise de alimentos; PCR em tempo real; linearidade.
1 Introduction
The GMO analysis is based on both the detection of new proteins resulting from genetic modification and DNA sequences. Among the DNA sequences detection methods, PCR (qualitative PCR, end-point quantitative PCR, and quantitative real-time PCR) has been generally accepted by the regulatory authorities. Real-Time PCR is a powerful tool for GMO quantification in food, but it is influenced by factors such as sampling, DNA extraction methods, presence of PCR inhibitors, degree of DNA degradation, and plant genome.
DNA extraction is the first and a critical step in GMO food analysis based on PCR, and factors such as sampling methods, sample size, type of matrix and inhibitors can affect the quantity and quality of DNA extracted from grain/seed, food, and feed samples (DEMEKE; JENKINS, 2010). Since many extraction methods can result in DNA showing different levels of purity and final yield, the quality of final results can be substantially affected (OLEXOVÁ; DOVIČOVIČOVÁ; KUCHTA, 2004). Therefore, the aim of a DNA extraction procedure is to provide DNA of suitable quality and quantity for subsequent analyses.
Many studies have been published to determine the more appropriate extraction method for each food matrix in order to minimize the influence of the extraction in the variability of DNA amplification, mainly in the quantification of low copy number target using real time PCR (CANKAR et al., 2006; CORBISIER et al., 2007; FERRARI et al., 2007; PEANO et al., 2004; SMITH; MAXWELL; DE BOER, 2005; SMITH; MAXWELL, 2007; ZIMMERMANN; LÜTHY; PAULI, 1998).
The most widely used DNA extraction methods are the detergent-based methods and the commercial kits that use silica-based columns or magnetic beads. Among the former, the cetyltrimethylammonium bromide (CTAB) extraction method has been considered efficient for a large range of plant-derived foods, especially due to separation of polysaccharides from DNA. It was originally described by Doyle and Doyle (1987), and some variations of this method have been proposed to improve the DNA quality depending upon the sample matrix (DEMEKE; JENKINS, 2010).
Currently, a large number of commercial kits are available for DNA extraction from different matrices, but only a limited number can be used for the isolation of DNA from processed food products (GRYSON; MESSENS; DEWETTINCK, 2004).
Brazilian regulation requires the labeling of food containing 1% (10 g.kg-1) threshold of genetically modified organisms (GMO) (BRASIL, 2003). There are some published studies about the detection and quantification of the amount of transgenic material present in Brazilian processed food (BRANQUINHO; FERREIRA; CARDARELLI-LEITE, 2010; BROD et al., 2007; BROD; ARISI, 2008; CARDARELLI et al., 2005; DINON; DE MELO; ARISI, 2008, DINON, 2010; FERREIRA; BRANQUINHO; CARDARELLI-LEITE, 2009; GREINER; KONIETZNY, 2008; MARCELINO; GUIMARÃES; BARROS, 2007), but none of these products that contain modified GMO above the threshold level had been appropriately labeled, reinforcing the need for continous analyses in processed food products.
The DNA extraction method used in GMO detection/quantification routine analyses in the National Institute for Quality Control in Health (INCQS) is the CTAB method based on Lipp et al. (1999) with the withdraw of the final ethanol wash step. In this study, the CTAB method and the DNeasy® Plant Mini kit method (Qiagen) were compared in terms of concentration, yield, and purity considering samples derived from soybean produced by different food processing treatments. The performance of these two extraction methods in the amplification of lectin and p35S targets were assessed through the PCR efficiency and the linearity of the calibration curves in order to evaluate the proposed modifications in the CTAB method and to select the best protocol.
2 Materials and methods
2.1 Samples and sample preparation
Three food samples derived from soybean produced by different food processing treatment - Texturized Soy Protein (TSP), infant formula, and powdered soy milk - and a Certified Reference Material (CRM), consisting of dried soybean powder with 5 and 0% Roundup Ready® soybean, were used in this study.
A total of 1 kg of processed samples consisting of 2-5 packages were ground in an M20 mill (IKA Works, Inc., Wilmington, CA, USA) under carefully controlled conditions to avoid cross-contamination among samples.
2.2 DNA extraction methods
The CTAB method, based on Lipp et al. (1999) with some modifications as described in Cardarelli et al. (2005), and the DNeasy® Plant Mini kit method (Qiagen), according to the manufacturer's procedure, were compared. DNA was extracted in duplicate in four different days.
CTAB method: a portion of 100 mg of the sample homogenate and 50 mg of 5% CRM was transferred to 1.5 mL sterile vials followed by addition of 1000 µL CTAB extraction buffer (0.1 M Tris-HCl, 20 g.L-1 CTAB, 1.4 M NaCl, 20 mM Na2 EDTA, pH 8.0) and mixed. After incubation at 65 °C for 60 minutes, with occasional stirring, the suspension was centrifuged for 10 minutes at 14000 xg, and 500 µL of the upper layer were transferred to a new tube and extracted with 200 µL of chloroform, stirred, and centrifuged for 10 minutes at 14000 xg. The supernatant was transferred to a new tube, mixed with double volume of CTAB precipitation solution (5 g.L-1 CTAB, 0.04 M NaCl), and incubated for 60 minutes at room temperature. After centrifugation for 10 minutes at 14000 xg, the supernatant was discarded and the precipitate was dissolved in 350 µL 1.2 M NaCl, and 350 µL of chloroform was added. The mixture was mixed for 30 seconds and then centrifuged for 10 minutes at 14000 xg until the phases separated. The upper layer (aqueous phase) was mixed with the same volume of isopropanol and left at -20 °C overnight. After centrifugation for 10 minutes at 14000 xg at 4 °C, the precipitate DNA was hydrated in 100 µL of DNA grade water, left at 4 °C overnight, and resuspended with light agitation and stored at -20 °C.
DNeasy® Plant Mini kit method: a portion of 100 mg of the sample homogenate and 50 mg of 5% CRM were added of 400 µL of buffer AP1 and 4 µL of RNase A stock solution (100 mg.mL-1) and vortexed vigorously. After incubation at 65 °C for 10 minutes, with occasional stirring, 130 µL of buffer AP2 were added to the lysate, mixed, and incubated for 5 minutes on ice. The lysate was pipetted into the QIAshredder mini spin column tube and centrifuged for 2 minutes at 20000 xg. The flow-through fraction was transfered to a new tube without disturbing the cell-debris pellet; 1.5 volumes of Buffer AP3/E was added and mixed by pipetting. 650 µL of mixture were then pipetted into the DNeasy mini spin column, centrifuged for 1 minute at 6000 xg, and the flow-through was discarded. This step was repeated once. The column was added with 500 µL of Buffer AW, centrifuged for 1 minute at 6000 xg, and a second portion of 500 µL of Buffer AW was added and centrifuged for 2 minutes at 20000 xg to dry the membrane. The column was transferred to a 1.5 mL microcentrifuge tube, 100 µL of Buffer AE were pipetted onto the DNeasy membrane, and then centrifuged for 1 minute at 6000 xg to elute. The DNA suspension was stored at -20 °C.
Genomic DNA was subjected to electrophoresis on a 0.8% agarose gel containing ethidium bromide in TBE buffer (10 nM Tris, 2.75 g boric acid.L-1, 1 nM Na2 EDTA) at a constant voltage (80 V for 30 minutes).
2.3 DNA concentration, yield and purity
The DNA concentrations were estimated by measuring the absorbance at 260 nm (A260) and 280 nm (A280) in the Gene Quant pro spectrophotometer (Amersham Bioscience, Piscataway, NJ, USA). Purity was determined by calculating the ratio of absorbance at 260 nm and absorbance at 280 nm (A260/A280) and the ratio at 260 nm and 230 nm (A260/A230).
2.4 Duplex real-time PCR
A duplex reaction was performed using the TaqMan® GMO 35S Soy detection kit for amplification of the soybean lectin (Le 1) gene target and the p35S target in the same tube (APPLIED..., 2001). Reactions were carried out in 96-well microtiter plates in a total volume of 25 µL containing 22 µL master mix, 0.5 µL ampliTaq Gold® polymerase, and 2.5 µL DNA, and they were run on the ABI Prism® 7500 Sequence Detection System (Applied Biosystems, Foster City, CA, USA) according to the following thermal cycling protocol: initial step at 94 °C for 9 minutes and 45 cycles at 95 °C for 20 seconds and 60 °C for 1 minute. All products and reagents were purchased from Applied Biosystems.
2.5 Verification of the absence of inhibitory substances in CTAB-extracted DNA
The absence of inhibitory substances was demonstrated by the lectin gene (Le 1) amplification in two CTAB-extracted DNA from 0% CRM and three CTAB-extracted DNA from non-GM soybean. The DNA concentration was adjusted to 40 ng.µL-1, the so-called "undiluted" sample, and from this sample a fourfold dilution series was prepared with water (1:4, 1:16, 1:64, and 1:256). All DNA dilutions were run in duplicate. To assess the presence of inhibitors, the Ct values of the diluted samples are plotted against the logarithm of the dilution factor, and an equation is calculated by linear regression. The Ct value for the "undiluted" sample extrapolated from the the linear regression line is compared with the measured Ct for the same sample and the difference (∆Ct) between the measure Ct and the extrapolated Ct value should be within 0.5. Other criteria were the slope of the regression and the linearity (EUROPEAN..., 2008).
2.6 Evaluation of DNA extraction methods on real time PCR
The evaluation was carried out by comparing three calibration curves using the DNA from 5% CRM extracted by CTAB and DNeasy kit methods, diluted with purified water, on the basis of the soybean genomic size (1C) (BENETT; LEITCH, 2004), to obtain approximately 132800, 33200, 8300, 2075, 1037, 520, and 260 copies of lectin and 66400, 1660, 415, 100, 50, and 25 copies of p35S per 25 µL volume of PCR reaction. Each dilution was analyzed in triplicate. The copy numbers and Ct values measured in the last five concentrations of each curve were submitted to Cochran test to check the uniformity of the variances. The values of PCR efficiencies, slope, and correlation coefficient (R2) obtained in all runs for both lectin and p35S targets were evaluated and analysis of variance (ANOVA α = 0.05) was applied to estimate regression parameters (slope, linear, and correlation coefficient). F statistic (α = 0.05) was applied to verify the slope significance and deviations from linearity (lack-of-fit, α = 0.05) of each curve over the concentration range evaluated. The efficiency of the PCR reaction was calculated by the formula from Bustin and Nolan (2004): E = [10(-1/ slope) -1] × 100.
The comparative analysis of the Ct values for both the p35S and lectin genes obtained in the amplification of serial dilutions of DNA extracted with CTAB and DNeasy kit methods was performed using ANOVA (α = 0.05) using the Snedecor distribution.
3 Results and discussion
3.1 DNA concentration, yield and purity
In this study, the CTAB method, with some modifications, and the DNeasy® Plant Mini kit method (Qiagen) were compared.
The CTAB method has been widely used to extract DNA from leaves, seeds/crops, and processed food/feed (INTERNATIONAL..., 2005), and it is based on thermal lysis in the presence of the anionic detergent cetyltrimethyl ammonium bromide followed by several extraction and purification steps with chloroform/isopropanol and ethanol in order to remove contaminants, such as polysaccharides, polyphenols, and proteins. The used method in this work was based on the modifications proposed by Lipp et al. (1999) without the ethanol wash step.
The DNeasy® Plant Mini kit method has been used to extract DNA from different food matrices. The samples are lysed by a buffer containing RNase A, and cell debris and salt precipitates are removed by a spin through the QIAshredder spin column. Binding buffer and ethanol are added to the cleared lysate to promote binding of the DNA to the DNeasy membrane. DNA binds to the membrane while contaminants such as proteins and polysaccharides are removed by two wash steps, and then DNA is eluted in a low-salt buffer.
The quantity and quality of the DNA extracted from food samples are mostly influenced by many factors such as sampling techniques, sample size, matrix type, inhibitors substances, the grade of damage, and the fragment length of the DNA. These factors depend on the sample itself, the food processing, and the physical and chemical parameters of the extraction methods.
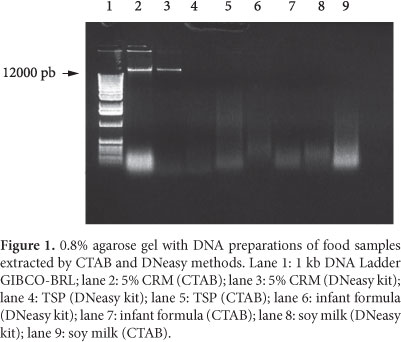
A preliminary analysis for the quality was performed by electrophoresis in 0.8% agarose gel (Figure 1). High molecular weight genomic DNA band (>12 kb) was present in the gel only when DNA was extracted from 5% MRC, which have been subjected to mechanical treatment. Some degree of contamination with RNA in prepared DNA with CTAB method was observed. The contamination was lower in DNA extracted with DNeasy kit method using RNase A treatment. The other matrices (TSP, infant formula, and soy milk) showed no fragments of 12 kb indicating that the DNA was degraded regardless of the level of processing of the samples.
The efficiency of the extraction methods was determined by the amount and quality of the DNA extracted from the samples using spectrophotometric measures. Values between 1.8 and 2.0 for A260/A280 indicate low level of contamination with protein and aromatic substances, and values above 2.0 for A260/A230 indicate absence of PCR inhibitors substances such as polysaccharides, salts, lipids, and phenolic compounds. The average values of A260/A280 and A260/A230 are shown in Table 1.
The values of A260/A280 showed that both methods provided a good DNA quality for all food samples despite of the type of sample processing. Nevertheless, the CTAB method gave values slightly below 1.8 for 5% CRM, indicating that traces of protein materials could still be present.
The values of A260/A230 showed no difference between the extraction methods of TSP and soy milk, providing a good DNA quality. With regard to the infant formula, the CTAB method gave a better DNA quality than the DNeasy method contradicting studies that show that silica based methods are more efficient at removing inhibitors substances (DI BERNARDO et al., 2007). In relation to 5% CRM, prepared by griding and mixing of the soybean grains, neither CTAB nor DNeasy method yielded DNA preparations of good quality. An explanation could be the failure of the extraction methods to compensate for the high lipid content of the soybean grains. Moreover, the absence of ethanol wash step, important to remove CTAB residues, may have contributed to the low DNA quality. Corbisier et al. (2007) compared four extractions methods, including CTAB and DNeasy kit, in the extraction of Bt176 2% CRM. The CTAB-based method yielded the highest DNA template quantity and quality.
DNA extraction yield was determined measuring micrograms of DNA per 100 mg of sample (Figure 2). The DNeasy method provided the highest yield from TSP and soy milk. These results differ from other studies with high processed food samples that showed CTAB method providing higher yield (DI BERNARDO et al., 2007; SMITH; MAXWELL; DE BOER, 2005). The CTAB method gave the highest yield of DNA from 5% CRM but these results can be related to the presence of RNA molecules (RNA also absorbs at 260 nm) since there was no RNase A treatment for RNA removal. In the extraction of infant formula, the yield was the same with both methods.
Although the extraction method has significant influence in the quantity and quality of the DNA, Di Bernardo et al. (2007) showed that the adequacy of the method depends on the food matrix, and there is no suitable method to all samples. The choice of the method depends on the presence and kind of inhibitors, degree of degradation, and quantity of DNA in the sample.
3.2 Verification of absence of inhibitory substances
The low values of A260/A230 ratios of DNA preparations obtained using the CTAB method from 5% CRM indicated that inhibitors substances could be present and reduce the efficiency of real-time PCR. To assess the presence of inhibitors in CTAB-extracted DNA, successive dilutions of two DNA extractions from non-GM soy (DNA 1 and 2) and three DNA extractions from 0% CRM (DNA 3, 4, and 5) were performed. The DNA concentration was adjusted to 40 ng.µL-1 and diluted 1:4 up to 1:256. The difference (∆Ct) between the measured Ct and the extrapolated Ct value was calculated, and the slope and coefficient of correlation (R2) of the of lectin amplification curves were used as other criteria to be met (EUROPEAN..., 2008; ŽEL et al., 2008).
The results reported in Table 2 showed no evidence of the presence of PCR inhibitors since all ∆Ct values are <0.5. Futhermore, the slope of the regression line ranged from -3.6143 to -3.4565 indicating excellent PCR efficiences and the linearity, measured by the coefficient of correlation, was above 0.98 in all runs. The combination of these results allowed us to conclude that the CTAB method provided DNA extracts that fit for purpose of real-time PCR.
3.3 Evaluation of DNA extraction methods on real time PCR
In addition to DNA quantity and good quality being essential to achieve a reliable quantification by real-time PCR, the PCR efficiency is an important feature in the reability of the results. Therefore, the PCR efficiency and the linearity of the calibration curves were used to evaluate the performance of CTAB and DNeasy extraction methods in the quantification of lectin and p35S targets. Certified Reference Material was used for this assessment since it is an unprocessed sample with defined particle size.
This evaluation was carried out through the parameters of three calibration curves using 5% CRM extracted on different days using CTAB and DNeasy methods diluted to obtain approximately 132800, 33200, 8300, 2075, 1037, 520 and 260 copies of lectin and 66400, 1660, 415, 100, 50 and 25 copies of p35S per 25 µL volume of PCR reaction. Each dilution was analyzed in triplicate in each run.
The coefficient of correlation (R2), angular coefficient (slope), and efficiency of real-time PCR amplification are shown in Table 3.
The data obtained with the amplification of the last five concentrations of lectin target (132800, 33200, 8300, 2075, 1037, 520, and 260 copies) and p35S (66400, 1660, 415, 100, 50, and 25 copies) were analyzed using the Cochran test (p > 0.05) for checking the uniformity of the variances of each curve. The test demonstrated homocedasticity.
The slope of the calibration curves indicates the amplification efficiency and the optimal value of -3.324, which corresponds to 100% efficiency (EUROPEAN..., 2008). The average PCR efficiencies of 92% for the lectin target using DNA extracted by CTAB method and of 93% using DNA extracted by DNeasy method are not statistically different from each other (p > 0.05). Regarding to the 35S target, the average PCR efficiencies of 95% using DNA extracted by CTAB method are not statistically different (p > 0.05) from the average PCR efficiency of 93% using DNeasy extracts.
Smith and Maxwell (2007) compared real-time PCR efficiences of invr1 gene amplification using DNA extracted using four different methods from corn flour, and observed that DNeasy extracts displayed higher efficiency than CTAB extracts.
The coefficients of correlation of the calibration curves for the lectin target using DNA extracted by CTAB and DNeasy kit methods ranged from 0.9878 and 0.9982, higher than the minimun acceptable coefficient of 0.98 (EUROPEAN..., 2008), demonstrating high degree of correlation between the lectin copy numbers, and Ct. ANOVA (α = 0.05) showed suitable adjustment of the regression and absence of significant linear deviations (lack-of-fit test) over the concentration range evaluated.
As for the p35S target amplification curves, all the coefficients of correlation using DNA extracted by DNeasy kit were above 0.98, and no significant linear deviations was observed. Two out of three R2 values using DNA extracted by CTAB method were lower than 0.98, corresponding to lower degree of correlation between the target copy numbers and Ct. The lack-of-fit test (α = 0.05) showed the presence of significant linear deviation in only one run. An explanation may be the presence of impurities that could be interfering with p35S target amplification.
The comparative analysis of the Ct values for the p35S and lectin targets obtained in the amplification of serial dilutions of DNA extracted with CTAB and DNeasy kit methods was performed using ANOVA (α = 0.05) and showed no statistically significant differences between the analytical curves of each target.
The effect of five DNA extractions methods on the real-time PCR efficiency for RR soybean 5% CRM quantification was studied by Cankar et al. (2006). The results demonstrated that the efficiency of the DNeasy kit, CTAB, and CTAB without proteinase K and RNase A and GENESpin kit methods were close to 100%, and no statistically significant differences (p > 0.05) between the amplification of lectin, p35S, tNOS, and RR soybean targets was observed. The dispersion of efficiency values were higher for the Wizard extracts.
4 Conclusions
The CTAB and DNeasy kit methods were efficient providing good quality and quantity DNA preparations from texturized soy protein, infant formula, and soymilk samples. With regard to the 5% CRM, neither CTAB nor DNeasy kit methods yielded DNA extracts of good quality, suggesting that inhibitory substances of real-time PCR could be present. However, the dilution test applied in the CTAB extracts showed no interference of these substances, demonstrating DNA preparations that fit for purpose of real-time PCR.
The average PCR efficiencies for the lectin target using DNA extracted by both extraction procedures were not statistically different from each other. The coefficients of correlation of the calibration curves demonstrated high degree of correlation between the lectin copy numbers, and Ct. ANOVA (α = 0.05) showed suitable adjustment of the regression and absence of significant linear deviations over the concentration range evaluated.
With regard to the 35S target, the average PCR efficiencies were not statistically different and no significant linear deviations was observed in DNeasy kit extracts. Two out of three R2 values using DNA extracted by CTAB method were lower than 0.98, corresponding to lower degree of correlation, and the lack-of-fit test (α = 0.05) showed presence of significant linear deviation in only one run.
Despite the lower degree of correlation in some CTAB extracts, the comparative analyses of the Ct values for the p35S and lectin targets showed no statistically significant differences between the analytical curves of each target. These results demonstrated that either the CTAB or DNeasy® kit method were efficient providing DNA from food samples with different degree of processing, indicating that both methods are suitable for quantification.
Acknowledgements
The authors wish to express their gratitude to Sérgio Alves da Silva for providing statistical support and to the Strategic Program of Support to Health Research - PAPES V/FIOCRUZ (403624/2008-8) and National Agency for Sanitary Surveillance (ANVISA) for the financial support.
Received 16/7/2010
Accepted 18/10/2011 (004927)
- APPLIED BIOSYSTEMS. TaqMan® Genetically Modified Organism (GMO) Detection Kit. User's Guide U.S.: Applera Corporation, 2001. P/N 4327687 rev. A.
- BENETT, M. D.; LEITCH, I. J. Plant DNA c-values databases of the royal botanic garden Kew, 2004. Disponível em: <http://www.rbgkew.org.uk>. Acesso em: Dec., 2009.
- BRANQUINHO, M. R.; FERREIRA, R. T. B.; CARDARELLI-LEITE, P. Survey of compliance with labeling legislation in food containing GMOs in Brazil. Journal of Food Composition and Analysis, v. 23, p. 220-225, 2010. http://dx.doi.org/10.1016/j.jfca.2009.09.004
- BRASIL. Decreto nº 4680, de 24 de abril de 2003. Regulamenta o direito à informação, assegurado pela Lei no 8.078, de 11 de setembro de 1990, quanto aos alimentos e ingredientes alimentares destinados ao consumo humano ou animal que contenham ou sejam produzidos a partir de organismos geneticamente modificados, sem prejuízo do cumprimento das demais normas aplicáveis. Diário Oficial da República Federativa do Brasil, Brasília, DF, 24 de abr. 2003. Disponível em: http://www.anvisa.gov.br/e-legis Acesso em: 10 set. 2009.
- BROD, F. C. A.; ARISI, A. C. M. Quantification of Roundup Ready® soybean in Brazilian soy-derived foods by real-time PCR. International Journal of Food Science and Technology, v. 43, p. 1027-1032, 2008. http://dx.doi.org/10.1111/j.1365-2621.2007.01556.x
- BROD, F. C. A. et al. Nested PCR detection of genetically modified soybean in soybean flour, infant formula and soymilk. LWT Food Science and Technology, v. 40, p. 748-751, 2007. http://dx.doi.org/10.1016/j.lwt.2005.12.009
- BUSTIN, R.; NOLAN, T. Analysis of m RNA expression by Real-time PCR. In: Real-time PCR: an essential guide. Norfolk : Horizon Bioscience, 2004. p. 125-184.
- CANKAR, K. et al. Critical points of DNA quantification by real-time PCR - effects of DNA extraction method and sample matrix on quantification of genetically modified organisms. BMC Biotechnology, v. 6, p. 37-51, 2006. http://dx.doi.org/10.1186/1472-6750-6-37
- CARDARELLI, P. et al. Detection of GMO in food products in Brazil: the INCQS experience. Food Control, v. 16, p. 859-866, 2005. http://dx.doi.org/10.1016/j.foodcont.2004.07.010
- CORBISIER, P. et al. Toward metrological traceability for DNA fragment ratios in GM quantification. 1. Effect of DNA extraction methods on the quantitative determination of Bt 176 corn by Real-Time PCR. Journal of Agriculture and Food Chemistry, v. 55, p. 3249-3257, 2007. PMid:17407305. http://dx.doi.org/10.1021/jf062931l
- DEMEKE, T.; JENKINS, G. R. Influence of DNA extraction methods, PCR inhibitors and quantification methods on real-time PCR assay of biotechnology-derived traits. Analytical and Bioanalytical Chemistry, v. 396, n. 6, p. 1977-1990, 2010. PMid:19789856. http://dx.doi.org/10.1007/s00216-009-3150-9
- DINON, A. Z.; DE MELO, J. E.; ARISI, A. C. M. Monitoring of MOM810 genetically modified maize in foods in Brazil from 2005 to 2007. Journal of Food Composition and Analysis, v. 21, p. 515-18, 2008. http://dx.doi.org/10.1016/j.jfca.2008.04.008
- DINON, A. Z. et al. Monitoring of GMO in Brazilian processed meat and soy-based products from 2007 to 2008. Journal of Food Composition and Analysis, v. 23, p. 226-229, 2010. http://dx.doi.org/10.1016/j.jfca.2009.12.002
- DI BERNARDO, G. et al. Comparative evaluation of different DNA extraction procedures from food samples. Biotechnology Progress, v. 23, p. 297-301, 2007. PMid:17286386. http://dx.doi.org/10.1021/bp060182m
- DOYLE, J. J.; DOYLE, J. L. A rapid DNA isolation procedure from small quantities of fresh leaf tissues. Phytochem Bull, v. 19, p. 11-15, 1987.
- EUROPEAN NETWORK OF GMO LABORATORIES - ENGL. Definition of minimum performance requirements for analytical methods of GMO testing Version October 13, 2008. Disponível em: <http://gmo-crl.jrc.ec.europa.eu>
- FERRARI, C. S. et al. Evaluation of polymerase chain reaction and DNA isolation protocols for detection of genetically modified soybean. International Journal of Food Science and Technology, v. 42, p. 1249-1255, 2007. http://dx.doi.org/10.1111/j.1365-2621.2006.01405.x
- FERREIRA, R. T. B.; BRANQUINHO, M. R.; CARDARELLI-LEITE, P. Soja geneticamente modificada em alimentos contendo farinha e preparados à base de farinha de trigo. Detecção e adequação à legislação de rotulagem. Brazilian Journal of Food Technology, v. 12, n. 3, p. 241-248, 2009. http://dx.doi.org/10.4260/BJFT2009800900018
- GREINER, R.; KONIETZNY, U. Presence of genetically modified maize and soy in food products sold commercially in Brazil from 2000 to 2005. Food Control, v. 19, p. 499-505, 2008. http://dx.doi.org/10.1016/j.foodcont.2007.05.016
- GRYSON, N.; MESSENS, K.; DEWETTINCK, K. Evaluation and optimisation of five different extraction methods for soy DNA in chocolte and biscuits. Extraction of DNA as a first step in GMO analysis. Journal of the Science of Food and Agriculture, v. 84, p. 1357-1363, 2004. http://dx.doi.org/10.1002/jsfa.1767
- INTERNATIONAL ORGANIZATION FOR STANDARDIZATION - ISO. ISO 21571:2005 Foodstuffs: Nucleic acid based methods of analysis of genetically modified organisms and derived products - information to be supplied and procedure for the addition of methods to ISO 21569, ISO 21570 or ISO 21571. Switzerland: ISO, 2005. 18 p.
- LIPP, M. et al. IUPAC collaborative trial study of a method to detect genetically modified soy beans and maize in dried powder. Journal of AOAC International, v. 82, n. 4, p. 923-928, 1999.
- MARCELINO, F. C.; GUIMARÃES, M. F. M.; BARROS, E. G. Detecção e quantificação de alimentos geneticamente modificados: o panorama brasileiro. Revista Ceres, v. 54, n. 313, p. 240-250, 2007.
- OLEXOVÁ, L.; DOVIČOVIČOVÁ, L.; KUCHTA, T. Comparision of three types of methods for the isolation of DNA from flours, biscuits and instant paps. European Food Research and Technology, v. 218, p. 390-393, 2004. http://dx.doi.org/10.1007/s00217-004-0872-y
- PEANO, C. et al. Qualitative and quantitative evaluation of the genomic DNA extract from GMO and non-GMO foodstuffs with four different extraction methods. Journal of Agriculture and Food Chemistry, v. 52, p. 6962-6968, 2004. http://dx.doi.org/10.1021/jf040008i
- SMITH, D. S.; MAXWELL, P. W.; DE BOER, S. H. Comparision of several methods for the extraction of DNA from potatoes and potato-derived products. Journal of Agriculture and Food Chemistry, v. 53, p. 9848-9859, 2005. PMid:16366665. http://dx.doi.org/10.1021/jf051201v
- SMITH, D. S.; MAXWELL, P. W. Use of quantitative PCR to evaluate several methods for extracting DNA from corn flour and cornstarch. Food Control, v. 18, p. 236-242, 2007. http://dx.doi.org/10.1016/j.foodcont.2005.10.001
- ŽEL, J. et al. Method validation and quality management in the flexible scope of accreditation: an example of laboratories testing for genetically modified organisms. Food Analytical Methods, v. 1, p. 61-72, 2008. http://dx.doi.org/10.1007/s12161-008-9016-5
- ZIMMERMANN, A.; LÜTHY, J.; PAULI, U. Quantitative and qualitative evaluation of nine different extraction methods for nucleic acids on soya bean food samples. Zeitschrift für Lebensmitteluntersuchung und-Forschung A, v. 207, p. 81-90, 1998.
Publication Dates
-
Publication in this collection
06 Feb 2012 -
Date of issue
Mar 2012
History
-
Received
16 July 2010 -
Accepted
18 Oct 2011