Abstracts
A method using Liquid Chromatography Tanden Mass Spectrometry (LC-MS/MS) with matrix-matched calibration curve was developed and validated for determining ochratoxin A (OTA) in green coffee. Linearity was found between 3.0 and 23.0 ng.g-1. Mean recoveries ranged between 90.45% and 108.81%; the relative standard deviation under repeatability and intermediate precision conditions ranged from 5.39% to 9.94% and from 2.20% to 14.34%, respectively. The limits of detection and quantification were 1.2 ng.g-1 and 3.0 ng.g-¹, respectively. The method developed was suitable and contributed to the field of mycotoxin analysis, and it will be used for future production of the Certified Reference Material (CRM) for OTA in coffee.
coffee; mycotoxin; validation; HPLC; MS
Um método utilizando Cromatografia Líquida de Alta Eficiência-Espectrometria de Massas Sequencial (CLAE-EM/EM) com curva de calibração em matriz foi desenvolvido e validado para a determinação de ocratoxina A (OTA) em café verde. A linearidade foi demonstrada entre 3,0 e 23,0 ng.g-1. As recuperações médias variaram entre 90,45% e 108,81%; o desvio padrão relativo sob condições de repetitividade e precisão intermediária foram de 5,39% e 9,94% e de 2,20% e 14,34%, respectivamente. Os limites de detecção e quantificação foram 1,2 ng.g-1 e 3,0 ng.g-, respectivamente. O método desenvolvido foi adequado, contribuiu para o campo de análises em micotoxinas e será usado para a futura produção de Material de Referência Certificado (MRC) para OTA em café.
café; micotoxinas; validação; CLAE; EM
Development and validation of a method for detection and quantification of ochratoxin A in green coffee using liquid chromatography coupled to mass spectrometry
Desenvolvimento e validação de metodologia na detecção e na quantificação de Ocratoxina A no café verde utilizando cromatografia líquida acoplada à espectrometria de massas
Raquel Duarte da Costa Cunha BandeiraI; Thaís Matsue UekaneI; Carolina Passos da CunhaI; Valnei Smarçaro da CunhaI; Janaína Marques RodriguesI; Ronoel Luiz de Oliveira Godoy II; Marcus Henrique Campino de la CruzIII
Irdbandeira@inmetro.gov.brII Embrapa Food Technology, Brazilian Agricultural Research Corporation, Ministry of Agriculture, Livestock and Food Supply EMBRAPA, Rio de Janeiro, RJ, Brazil
III National Institute for Quality Control of Health INCQS, Oswaldo Cruz Foundation FIOCRUZ, Rio de Janeiro, RJ, Brazil
ABSTRACT
A method using Liquid Chromatography Tanden Mass Spectrometry (LC-MS/MS) with matrix-matched calibration curve was developed and validated for determining ochratoxin A (OTA) in green coffee. Linearity was found between 3.0 and 23.0 ng.g-1. Mean recoveries ranged between 90.45% and 108.81%; the relative standard deviation under repeatability and intermediate precision conditions ranged from 5.39% to 9.94% and from 2.20% to 14.34%, respectively. The limits of detection and quantification were 1.2 ng.g-1 and 3.0 ng.g-1, respectively. The method developed was suitable and contributed to the field of mycotoxin analysis, and it will be used for future production of the Certified Reference Material (CRM) for OTA in coffee.
Keywords: coffee; mycotoxin; validation; HPLC; MS/MS.
RESUMO
Um método utilizando Cromatografia Líquida de Alta Eficiência-Espectrometria de Massas Sequencial (CLAE-EM/EM) com curva de calibração em matriz foi desenvolvido e validado para a determinação de ocratoxina A (OTA) em café verde. A linearidade foi demonstrada entre 3,0 e 23,0 ng.g-1. As recuperações médias variaram entre 90,45% e 108,81%; o desvio padrão relativo sob condições de repetitividade e precisão intermediária foram de 5,39% e 9,94% e de 2,20% e 14,34%, respectivamente. Os limites de detecção e quantificação foram 1,2 ng.g-1 e 3,0 ng.g-, respectivamente. O método desenvolvido foi adequado, contribuiu para o campo de análises em micotoxinas e será usado para a futura produção de Material de Referência Certificado (MRC) para OTA em café.
Palavras-chave: café; micotoxinas; validação; CLAE; EM/EM.
Introduction
Coffee is complex food matrix and it has an important role in the economy. Brazil is the third largest consumer of the coffee, according to data from the Brazilian Association of Coffee Industry (ASSOCIAÇÃO..., 2010).
Ochratoxin A (OTA) is classified by the International Agency for Research on Cancer (IARC) as a potent nephrotoxic and nephrocarcinogenic mycotoxin. It is produced by several Aspergillus and Penicillium specie and A. westerdijkiae, which is the most common species found in Brazilian coffee (84.0%) (NOONIM et al., 2008).
This mycotoxin has been found in food commodities such as cereals, oleaginous seeds, wine, meat, cocoa, spices, dried fruits, grapes, beer, green, roasted and instant coffee (ALMEIDA et al., 2007; BECKER et al., 1998; BRESH et al., 2000; BUCHELLI; TANIWAKI, 2002; BULLERMAN, 2003; FUJII et al., 2002, 2007; FURLANI; SOARES, 1999; GOLLUCKE et al., 2004; MASOUD; KALTOFT, 2006; MANTLE, 2002; PATEL et al., 1997; PRADO et al., 2000; POHLAND et al., 1992; SFORZA et al., 2006; STUDER-ROHR et al., 1995; TANIWAKI et al., 2003).
Once OTA has been formed, it survives most food-processing stages such as cooking, fermenting and roasting as in the case of coffee beans. It has been reported that 6.0% of the total human OTA intake corresponds to coffee (ASSOCIAÇÃO..., 2010; LOBEAU et al., 2005; NOBA et al., 2009).
No European Union limits have yet been set for green coffee. Therefore, some EU member states such as Czech Republic, Finland, Greece, Hungary, Italy, Portugal, Spain, and Switzerland set limits for OTA in green coffee ranging from 5 to 20 ng.g-1. In Brazil, the limit for OTA in green coffee is under discussion. The European Coffee Federation suggests that OTA contamination in green coffee of 15 ng.g-1 will result in a finished product that does not exceed the EU maximum limits (FOOD..., 2010).
Several methods have been described for determining OTA in food matrix such as thin layer chromatography, spectrofluorometry, enzyme-linked immunosorbent assay, high performance liquid chromatography and liquid chromatography-mass spectroscopy (ALMEIDA et al., 2007; MASOUD; KALTOFT, 2006; PRADO et al., 2000; GILBERT; ANKLAM, 2002; PARDO et al., 2004; AHMED et al., 2007; SUGITA-KONISH et al., 2006). Reviewing the process it can be said that: the toxin is usually extracted with water, organic solvents, salt aqueous solution and acids or several mixtures. The extract is usually purified using solid-phase extraction, immunoaffinity column, or a combination of both. In order to analyze OTA in coffee, it is important to have an adequate clean up to remove substances like lipids and pigments that could interfere in the analytical techniques (FUJII et al., 2007; VARGAS et al., 2005; VENTURA et al., 2003).
Validation procedures of analytical method are necessary for legislation implementation to show that the method produces reliable results and provide accurate and reproducible results, and they are also necessary for risk-assessment studies and monitoring (MONACI; PALMISANO, 2004). The absence of available Certified Reference Material (CRM) in coffee is also an issue related to the validation of methods since it ensures that reliable data are generated (GILBERT; ANKLAM, 2002; MONACI; PALMISANO, 2004).
Due to the importance of this mycotoxin as a contaminant in coffee and to the possible risks to human health, it is necessary to study and develop new analytical methods that will comply with the limits established.
The purpose of this study was to develop and validate a modern, practical, fast and efficient method for OTA determination in green coffee using matrix-matched calibration by Liquid Chromatography Tandem Mass Spectrometry (LC-MS/MS) with electrospray source using liquid-liquid extraction followed by a clean up with immunoaffinity column, according to the European Union decision 2002/657/EC and INMETRO´s document. This study is the first step in producing a Certified Reference Material (CRM) for OTA in food samples such as coffee.
Experimental
Material
Brazilian green coffee samples were harvested using the striping method and were classified as Coffea arabica cv. Mundo Novo and Coffea arabica cv. Catuaí were obtained in São Domingos das Dores, East of Minas Gerais. These samples were stored at room temperature in the laboratory until analysis.
The solvents and standards used were ochratoxin A (Sigma-Aldrich, St Louis, USA), sodium bicarbonate (Tedia, USA, 99.7%), potassium dihydrogen phosphate (Merck, Germany, 99.0%), anhydrous disodium hydrogen phosphate (Merck, Germany, 99.0%), sodium chloride (Spectrum, USA, 99.0%), potassium chloride (Merck, Germany, 99.5%), potassium dichromate (Merck, Germany, 99.5%), sulfuric acid (Merck, Germany, 97.0%), methanol HPLC grade (Tedia, USA, 99.9%), trifluoroacetic acid HPLC grade (Tedia, USA, 99.8%), acetone pesticide grade (Tedia, USA, 99.8%), glacial acetic acid (Tedia, USA, 99.9%), toluene HPLC grade (Tedia, USA, 99.8%), benzene (Merck, Germany, 99.5%), acetone A.C.S. grade (Tedia, USA, 99.8%), ethyl alcohol (Quimes, Brazil, 95.0%), sodium hypochlorite (Invema, Brazil, 12.0%) and alcaline extran (Merck, Germany). The Mill-Q water system (Millipore Inc., Paris, France, type I) was used, in which ultrapure water was generated by this system with conductivity under 0.056 mScm-1.
Saline phosphate buffer water solution (PBS) at pH 7 was used (0.020% potassium dihydrogen phosphate, 0.110% anhydrous disodium hydrogen phosphate, 0.800% sodium chloride and 0.020% potassium chloride).
The immunoaffinnity columns (IA) used were OchratestTM WB obtained from Vicam Inc. (Watertown, USA).
Standard solution
Stock standard and intermediate solution of OTA were prepared according to the recommendation of Official Methods of Analysis of AOAC International in a mixture of toluene and glacial acetic acid (99:1) resulting in final concentration of 200 mg.mL-1 and 40 mg.mL-1, respectively (ASSOCIATION..., 2005). Both of them were stored in a freezer at -18 ºC.
The working standard solution of 100.0 ng.g-1 for OTA was prepared by weighing out an appropriate mass of the intermediate solution as follows. In a 4.0 mL glass flask, previously tared, a mass of 0.14748 g of intermediate solution was weighed. In a 250 mL amber bottle, previously tared, 100.096 g of mobile phase was weighed. Next, the 4.0 mL flask with the previously weighed solution was carefully inserted into the bottle containing the mobile phase, and homogenization was performed to obtain a final solution.
Extraction procedure
The sample preparation procedure was based on Pittets study (PITTET et al., 1996). An aliquot of 25.0 g of green coffee samples was weighed into a 250 mL amber glass flask and fortified with work standard solution and kept at room temperature overnight. Then it was transferred quantitatively with 190.0 g of a mixture of methanol: aqueous sodium bicarbonate solution 3.0% (1:1) and mixed in a blender for 5 minutes at low speed. The homogenate sample was filtered under vacuum using a fiberglass (Whatman, EUA) membrane.
For further purification, the ochratest immunoaffinity column (IA) was left to room temperature prior to being connected to a vacuum Manifold Vac Elut 20 (Varian, Walnut, USA) and attached a 60.0 mL syringe on the top of the column. A 4.6 g aliquot of the filtrate was weighed into a 100.0 mL volumetric flask, diluted with a saline phosphate buffer and homogenized. This extract was eluted into the IA column at a flow rate of 2.0-3.0 mL.min-1. After that, the IA column was washed with 10.0 mL of Milli-Q water at the same flow rate and then it was vacuum-dried for 30 seconds. An aliquot of 4.0 mL of methanol HPLC was added and then there was a 3 minutes wait to allow the solvent to permeate the gel before elution step. The OTA was collected in a test tube. The solvent was removed under nitrogen stream at 37 ºC. Finally, the extract was reconstituted with 1.0 g of mobile phase and homogenized in a vortex (Phoenix, USA).
Calibration curve
After method´s optimization, two calibration curves were constructed: one with a matrix (fortified samples) and the other without a matrix. Both of them were prepared from gravimetric dilution at five levels (3.0; 8.0; 13.0; 18.0 and 23.0 ng.g-1).
The standard calibration curve was prepared by adding an OTA standard solution (100.0 ng.g-1) to the mobile phase to obtain the five concentration levels. On the other hand, the matrix-matched standard curve was prepared by adding the same standard solution to the green coffee samples (matrix-matched standard curve). Each concentration level was injected in triplicate.
Liquid Chromatography Tanden Mass Spectrometry (LC-MS/MS)
Chromatographic separations were performed on a Synergi Hydro C18 column (75 mm × 2.0 mm i.d.; 4 mm, Phenomenex, Torrance, California, USA) with a Security guard cartridge (KJO-4282, AQ C18, 4 × 2.0 mm) at 25 ºC. The mobile phase was obtained by two solvents, solvent A was 0.05% trifluoracetic acid in water and solvent B was 0.05% trifluoracetic acid in methanol at flow rate of 0.3 mL.min-1 using isocratic elution (20:80). The mobile phase was filtered with a LCR PTFE membrane 0.45 mm (Millipore, EUA) and degassed by ultrasonic bath Model USC 1400 (Unique, Brasil). The injection volume was 50 mL. Two mobile phase pumps (Prostar 210), an on-line degasser, an automatic sampler (Pro Star410) and a column oven (Prostar) were used.
The MS/MS was performed on a triple-stage quadrupole 1200 L (Varian, Walnut, CA, USA) equipped with an electrospray interface (ESI) operating in a positive mode. The mass spectrometer was optimized for OTA by direct infusion of standard solution (10.0 mg mL-1). The optimized parameters were: needle voltage 5000 V, capillary voltage 50 V, drying gas temperature 340 ºC and pressure 21 psi, nebulizing gas pressure 40 psi, shield voltage 600 V, detector voltage 1600 V and housing temperature 40 ºC. High purity nitrogen and argon were used as nebulizer gas and collision gas, respectively.
Validation
The parameters selected for method validation were Linearity, Specificity, Accuracy, Limit of Detection and Quantification and Precision. The validation parameters were based on INMETROs document (DOC-CGCRE-008) and on the European Union Commission Decision (EC-657/2002) (INSTITUTO..., 2010; EUROPEAN..., 2002)
All results were checked for the presence of outliers using the Grubbs test and any value considered outlier was excluded.
Specificity means the ability of a method to distinguish between the analytes measured and other substances, which can change according to the compound class or matrix. The presence of peaks that could interfere in the identification and quantification of OTA was verified by analyzing blank green coffee samples (ROGASTSKY; STEIN, 2005).
Any matrix effects may impair the quantification of target analytes in complex samples. The absolute matrix effect was calculated by comparing the slope of matrix-matched standard curve with the slope of the standard calibration curve.
The linearity of the method was obtained with the linear correlation coefficient (r) from the calibration curve. A reference value higher than 0.90 is recommended, according to the Inmetro´s document (INSTITUTO..., 2010).
For homoscedasticity, the results from the calibration curve were submitted to a Cochrans test evaluation to verify whether random signal measurement errors are constant and independent of the predictor value (CUADROS-RODRIGUEZ et al., 1998).
The limit of quantification (LOQ) was determined from the lowest concentration of the work range (3.0 ng.g-1). The chromatograms of samples that produced a signal-to-noise ratio equal to ten were considered as the LOQ. For confirmation purposes, three roasted coffee samples were spiked with OTA at the same concentration level and the signal-to-noise ratio was calculated.
The limit of detection (LOD) was calculated from the Limit of Quantification according to Equation 1 shown below.

Accuracy was expressed by trueness and precision. Trueness means the closeness of agreement between the average value obtained from a large series of test results and an accepted reference value. When no Certified Reference Material (CRM) is available, it is acceptable that trueness of measurements is assessed through recovery of additions of known amounts of the element to the unknown samples (EUROPEAN..., 2002; AMÉZQUETA et al., 2004).
The recovery of OTA in green coffee was obtained from spiked samples of green coffee at three levels of contamination (5.0, 13.0 and 20.0 ng.g-1). The calculated concentration in the green coffee was compared with the theoretical concentration using Equation 2. The acceptance criterion is a recovery between 70 and 110% according to Codex Alimentarius Commission (CODEX..., 2006).

C1 = concentration determined on green spiked sample;
C2 = concentration determined on blank sample;
C3 = concentration added to the sample.
Precision was expressed by repeatability and intermediate precision by the Relative Standard Deviation. Repeatability (RSDr %) was obtained from analyses conducted by the same analyst on the same day and intermediate precision (RSDR %) was obtained by a different condition (different analyst on different days). According to the Codex Alimentarius Commission, the acceptance criterion is equal or lower than 20% for RSDr and equal or lower than 30% for RSDR. Furthermore, the intermediate precision was also assessed by the F-test and Student t test for analysis of variance and averages at the same concentration used for recovery (CODEX..., 2006).
Results and discussions
Electrospray was used because it is considered a mild ionization method that generally produces quasi-molecular ions with little fragmentation. These characteristics agree reasonably well with the LC/Fluorescence detection obtained for complex matrices (LAU et al., 2000).
First, the Selective Ion Monitoring Method (SIM) was tested and good results were obtained. However, in the working range of the calibration curve the ions monitored were not well observed due to noise and poor peak resolution. Thus, the SIM was not used for further development and method validation for OTA analysis (data not shown).
Therefore, the standard solution breakdown curves were obtained by direct infusion of OTA and precursor-to-product ions in the positive electrospray mass spectra (ESI MS). They were observed and used for the Selective Reaction Monitoring (SRM) method using the protonated molecule [M+H]+ m/z 404, presented in Figure 1. After analysis of the breakdown curves, precursor-to-product transitions were obtained for the performance of the SRM method.
The European Union Commission Decision (EC-657/2002) states that confirmatory methods for residue analysis should provide information about the chemical structure of the analyte (EUROPEAN..., 2002). Liquid chromatography coupled with a mass spectrometry detector requires four identification points that can be accomplished by monitoring one precursor ion and two product ionsThe method developed and validated in this study monitored two ions according to their collision energies: m/z 404 > 239 (-20.5 V) and m/z 404 > 358 (-10.5 V) for quantification and confirmation of OTA. The product ion showing the highest intensity was used for quantification, m/z 239, which corresponds to the loss of phenylalanine for OTA (BECKER et al., 1998).
Validation
The experimental results were checked for the presence of outliers using Grubbs test before the validation process, and none of the results were considered an outlier.
Linearity
The analytical procedure was considered to be linear for the working range of the calibration curve, and the correlation coefficient (r) values were higher than those recommended with reference value of 0.90 according to the Inmetro´s document (INSTITUTO..., 2010). The method presented a correlation coeficiente (r) of 0.99845 and 0.98188 for standard solution and matrix-matched calibration of OTA, respectively. Figure 2 shows the results of the regression parameters of the OTA standard solution and matrix-matched calibration curves.
The matrix-matched calibration curve showed a random pattern of residues in the working range (Figure 3), confirming the linearity of the method.
The value of Cochrans test results was Ccalc (0.54280) lower than the value of Ctab (0.68380) for the five levels of matrix-matched calibration curve with three replicates, proving homoscedasticity.
Specificity
Figure 4 shows a chromatogram of spiked green coffee at 3.0 ng.g-1 and an example of blank green coffee. No interference from the matrix around the retention time of OTA was observed; thus the method is considered specific for this analysis.
Matrix effect
Comparing the slope values of both calibration curves, it can be observed that the values are different indicating significant differences between the calibration curves of matrix and solvent. This means that there is a matrix effect on the response to the linearity. In this case, all subsequent validation parameters were accomplished using a matrix-matched calibration curve.
In order to avoid a matrix effect on the response to the linearity, an addition of isotopically labelled standard can be used. The use of this substance is useful for the correction of signal deviation because it has the same chemical properties and the same retention times as those of non-labeled substances. However, isotopically labeled internal standards may not be available for some analytes due to difficulties associated with synthesis and/or cost, and they were not used in this study.
Limit of Quantification (LOQ) and Limit of Detection (LOD)
For the green coffee sample, the limit of quantification (LOQ) was 3.0 ng.g-1, which is the first concentration of the calibration curve. The Limit of detection (LOD) of OTA was 1.2 ng.g-1. The LOQ value was higher than that determined using other methods in the literature (VENTURA et al., 2003; DIAZ et al., 2004). The LOD value was lower than that reported by other authors using HPLC-FLD methods (FURLANI; SOARES, 1999; LEONI et al., 2001). Furthermore, LC-ESI-MS/MS is especially helpful in confirming doubtful OTA positive results and the coelution problem of interfering compounds can be overcome by structural information provided by these techniques rather than those obtained by LC with Fluorescence detection.
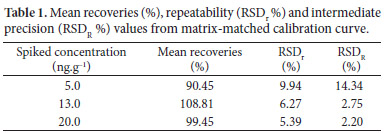
Accuracy
The trueness values obtained in the present study for different concentrations of OTA ranged between 90.45% and 108.81% and they are in accordance to Codex Alimentarius Commission for a contamination level less than 10.0 ng.g-1 (CODEX..., 2006). Table 1 shows recoveries values, which were considered satisfactory for green coffee samples in all fortification levels and are similar to those obtained with fluorescence detection methods currently in use, such as Enterwilse et al. (2001) (65-97%) and Pittet et al. (1996) (89‑100%) (PITTET et al., 1996; ENTERWILSE et al., 2001). On the other hand, this method presents recovery values higher than those reported by Ahmed et al. (2007), 73-86%; Ventura et al. (2003), 82%; Sibanda et al. (2002), 72-84% and Gilbert and Anklam (2002), 85%.
All RSDr values are within acceptable levels for repeatability, ranging between 5.39% and 9.94% and are lower than 20% according to the Codex Alimentarius Commission (CODEX..., 2006). The RSDR values for intermediate precision, ranging between 2.20 and 14.34 are lower than 30%; both RSDr and RSDR were better than the values obtained by Gilbert and Anklam (2002) and by Enterwilse et al. (2001). According to F-test and t test, intermediate precision was equivalent since the Fcal values (1.33175) were lower than the Ftable values (19.000) for OTA, so it can be concluded that the two analysts are not significantly different from each other, and the method has adequate intermediate precision.
Conclusions
The SRM method proved better than the SIM method because of the difficulty to obtain resolved peaks for quantification in the working range of the calibration curve.
The LC-ESI-MS/MS in combination with the SRM is a very sensitive and useful method for the determination of OTA in foods, especially in green coffee with several advantages when compared to the established methods since it presents the possibility of providing structural information to confirm doubtful OTA positive results.
The developed and validated method for identification and quantification of OTA in green coffee is accurate and sensitive. Linearity was demonstrated for contaminations levels between 3.0 and 23.0 ng.g-1. The validation parameters measured are within acceptable limits and were considered satisfactory. The detection limit of the method (1.2 ng.g-1) is sufficiently low for surveillance purposes. The method can be used to determine OTA content in soluble and roasted coffee samples.
The method presented shows an extremely useful and rapid clean-up for OTA in green coffee. This green coffee analysis by LC-ESI-MS/MS using the matrix-matched calibration method contributes to the field of mycotoxin analysis.
Acknowledgements
The authors are grateful for the financial support provided by CNPq, FINEP and INCQS/FIOCRUZ.
Received 25/1/2011
Accepted 26/7/2012
- AHMED N. E. et al. Evaluation of Methods Used To Determine Ochratoxin A in Coffee. Journal of Agricultural Food Chemistry, v. 55, p. 9576-9580, 2007. PMid:17941693.
- AMÉZQUETA, S. et al. Validation of a high-performance liquid chromatography analytical method for ochratoxin A quantification in cocoa beans. Food Additive and Contaminants, v. 21, p. 1096-1106, 2004. PMid:15764339. http://dx.doi.org/10.1080/02652030400019422
- ALMEIDA, A. P. et al. Ochratoxin A in Brazilian instant coffee. Brazilian Journal of Microbiology, v. 38, p. 300-303, 2007. http://dx.doi.org/10.1590/S1517-83822007000200022
- ASSOCIATION OF ANALYTICAL COMMUNITIES - AOAC INTERNATIONAL. Official Methods of Analysis of the AOAC International. 18th ed. Gaithersburg: AOAC International, 2005. chapt. 49, p. 58-65.
- ASSOCIAÇÃO BRASILEIRA DA INDÚSTRIA DE CAFÉ - ABIC: Disponível em: <http://www.abic.com.br>. Acesso em: 10 maio 2010.
» link - BECKER, M. et al. Column liquid chromatography-electrospray ionization-tandem mass spectrometry for the analysis of ochratoxin. Journal of Chromatography A, v. 818, p. 260-264, 1998. http://dx.doi.org/10.1016/S0021-9673(98)00594-9
- BRESH, M. et al. Ochratoxin A in coffee, tea and beer. Archiv für Lebensmittelhygiene, v. 51, p. 89-94, 2000.
- BUCHELLI, P.; TANIWAKI, M. H. Review: Research on the origin, and on the impact of post-harvest handling and manufacturing on the presence of ochratoxin in coffee. Food Additives Contaminants, v. 19, p. 655-665, 2002. PMid:12113660. http://dx.doi.org/10.1080/02652030110113816
- BULLERMAN, L. B. Mycotoxins. In: CABALLERO, B.; TRUGO, L. C.; FINGLAS, P. Encyclopedia of Food Sciences and Nutrition. 2nd ed. London: Academic Press, 2003. v. 6, p. 4080‑4108. http://dx.doi.org/10.1016/B0-12-227055-X/00821-X
- CODEX ALIMENTARIUS COMISSION. Joint FAO/WHO food standards programme: Discussion paper on Ochratoxin A in coffee. FAO, 2006. Committee on contaminants in food.
- CUADROS-RODRIGUEZ, L. et al. Ensuring both normality and homocedasticity of chromatographic data-ratios for internal-standard least-squares calibration. Chromatographia, v. 47, p. 550‑556, 1998. http://dx.doi.org/10.1007/BF02467494
- DIAZ, G. J. et al. Method validation for the determination of ochratoxin A in green and soluble coffee by immunoaffinity column cleanup and liquid chromatography. Mycotoxin Research, v. 20, p. 59‑67, 2004.
- ENTERWILSE, A. C. et al. Combined phenyl silane and immunoaffinity column cleanup with liquid chromatography for determination of ochratoxin A in roasted coffee: Collaborative study. Journal of AOAC International, v. 84, p. 444-450, 2001. PMid:11324609.
- EUROPEAN COMMUNITIES - EC. Commission Decision (EC) 2002/657/EC: Implementing Council Directive 96/23/EC concerning the performance of analytical methods and the interpretation of results. EC, 2002.
- FOOD AND AGRICULTURE ORGANIZATION OF UNITED NATIONS. Reducing OTA in coffee. Disponível em: <http://www.coffee-ota.org/faq.asp>. Accesso em: 10 jan. 2010.
- FUJII, S. et al. E Ocratoxina A em café: controle e metodologia analítica com ênfase a inovação no contexto de segurança alimentar. Seminário de Ciências Agrárias, v. 23, n. 2, p. 273-292, 2002.
- FUJII, S. et al. A comparison between enzyme immunoassay and HPLC for ochratoxin A detection in green, roasted and instant coffee. Brazilian Archives of Biology and Technology, v. 50, p. 349‑359, 2007. http://dx.doi.org/10.1590/S1516-89132007000200020
- FURLANI, R. P. Z.; SOARES, L. M. V. Avaliação de métodos para determinação de Ocratoxina A em cafés verdes e torrados. Revista do Instituto Adolfo Lutz, v. 58, p. 87-98, 1999.
- GILBERT, J.; ANKLAM, E. Validation of analytical methods for determining mycotoxins in foodstuffs. Trends in Analytical Chemistry, v. 21, p. 468-486, 2002. http://dx.doi.org/10.1016/S0165-9936(02)00604-0
- GOLLUCKE, A. P. B. et al. Survey on ochratoxin A in Brazilian green coffee destined for exports. Ciência e Tecnologia de Alimentos, v. 24, p. 641-645, 2004. http://dx.doi.org/10.1590/S0101-20612004000400027
- INSTITUTO NACIONAL DE METROLOGIA, NORMALIZAÇÃO QUALIDADE INDUSTRIAL- INMETRO. DOQ-CGCRE-008: Revisão 03. Orientação sobre validação de métodos de ensaios químicos. Rio de Janeiro, 2010.
- LAU, B. P. Y. et al. Quantitative determination of ochratoxin A by liquid chromatography/electrospray tandem mass spectrometry. Journal of Mass Spectrometry, v. 35, p. 23-32, 2000. http://dx.doi.org/10.1002/(SICI)1096-9888(200001)35:1<23::AID-JMS903>3.0.CO;2-B
- LEONI, L. A. B. et al. Ochratoxin A in brazilian green coffee. Ciência e Tecnologia de Alimentos, v. 21, p. 105-107, 2001. http://dx.doi.org/10.1590/S0101-20612001000100022
- LOBEAU, M. et al. Development of a new clean-up tandem assay column for the detection of ochratoxin A in roasted coffee Analytica Chimica Acta, v. 538, p. 57-61, 2005. http://dx.doi.org/10.1016/j.aca.2005.02.010
- MANTLE, P. G. Risk assessment and the importance of ocharatoxins. International Biodeterioration and Biodegradation, v. 50, p. 143‑146, 2002. http://dx.doi.org/10.1016/S0964-8305(02)00079-3
- MASOUD, W.; KALTOFT, C. H. The effects of yeasts involved in the fermentation of Coffea arabica in East Africa on growth and ochratoxin A (OTA) production by Aspergillus ochraceus. International Journal of Food Microbiology, v. 106, p. 229‑234, 2006. PMid:16213049. http://dx.doi.org/10.1016/j.ijfoodmicro.2005.06.015
- MONACI, L.; PALMISANO, F. Determination of OTA in foods: State-of-the-art and analytical challenges. Analytical and Bioanalytical Chemistry, v. 378, p. 96-103, 2004. PMid:14614589. http://dx.doi.org/10.1007/s00216-003-2364-5
- NOBA, S. et al. Determination of ochratoxin a in ready-to-drink coffee by immunoaffinity cleanup and liquid chromatography-tandem mass spectrometry. Journal of Agricultural Food Chemistry, v. 57, p. 6036-6040, 2009. PMid:19537783. http://dx.doi.org/10.1021/jf900546p
- NOONIM, P. et al. Isolation, identification and toxigenic potential of ochratoxin A-producing Aspergillus species from coffee beans grown in two regions of Thailand. International Journal of Food Microbiology, v. 128, p. 197-202, 2008. PMid:18819720. http://dx.doi.org/10.1016/j.ijfoodmicro.2008.08.005
- PARDO, E. et al. Occurrence of Ochratoxigenic Fungi and Ochratoxin A in Green Coffee from Different Origins. Food Science and Technology International, v. 10, p. 45-49, 2004. http://dx.doi.org/10.1177/1082013204041509
- PATEL, S. et al. Survey of ochratoxin A in UK retail coffees. Food Additives Contaminants, v. 14, p. 217-222, 1997. PMid:9135719. http://dx.doi.org/10.1080/02652039709374519
- PITTET, A. et al. Liquid chromatographic determination of OTA in pure and adultered soluble coffee using an immunoaffinity column clean up procedure. Journal of Agricultural Food Chemistry, v. 44, p. 3564-3569, 1996. http://dx.doi.org/10.1021/jf9602939
- POHLAND, A. E. et al. Ochratoxin A: a review. Pure and Applied Chemistry, v. 64, n. 7, p. 1029-1049, 1992. http://dx.doi.org/10.1351/pac199264071029
- PRADO, G. et al. Incidência de Ocratoxina A em café torrado e moído e em café solúvel consumido na cidade de Belo Horizonte, MG. Ciência e Tecnologia de Alimentos, v. 20, n. 2, p. 192-196, 2000.
- ROGASTSKY, E.; STEIN, D. Evaluation of Matrix Effect and Chromatography Efficiency: New parameters for Validation of Method Development. Journal of The American Society for Mass Spectrometry, v. 16, p. 1757-1759, 2005. PMid:16198119. http://dx.doi.org/10.1016/j.jasms.2005.07.012
- SFORZA, S. et al. Recent advances in mycotoxin determination in food and feed by hyphenated chromatographic techniques/ Mass spectrometry. Mass Spectrometry Reviews, v. 26, p. 54-76, 2006. PMid:15892148. http://dx.doi.org/10.1002/mas.20052
- SIBANDA, L. et al. Optimization of solid-phase clean-up prior to liquid chromatographic analysis of ochratoxin A in roasted coffee. Journal of Chromatography A, v. 959, p. 327-330, 2002. http://dx.doi.org/10.1016/S0021-9673(02)00408-9
- STUDER-ROHR, I. et al. The occurrence of ochratoxin A in coffee. Food and Chemical Toxicology, v. 33, n. 5, p. 341-355, 1995. http://dx.doi.org/10.1016/0278-6915(94)00150-M
- SUGITA-KONISH, Y. et al. The comparison of two clean-up procedures, multifunctional column and immunoaffinity column, for HPLC determination of ochratoxin A in cereals, raisins and green coffee beans. Talanta, v. 69, p. 650-655, 2006. PMid:18970617. http://dx.doi.org/10.1016/j.talanta.2005.10.036
- TANIWAKI, M. H. et al. The source of ochratoxin A in Brazilian coffee and its formatio n in relation to processing methods. International Journal of Food Microbiology, v. 82, p. 173-179, 2003. http://dx.doi.org/10.1016/S0168-1605(02)00310-0
- VARGAS, E. A. et al. Determination of ochratoxin A in green coffee by immunoaffinity column cleanup and liquid chromatography: collaborative study. Jo urnal of AOAC International, v. 88, n. 3, p. 773-779, 2005. PMid:16001851.
- VENTURA, M. et al. Analysis of ochratoxin A in coffee by solid-phase clean-up and narrow-bore liquid chromatography-fluorescence detector-mass spectrometry. Journal of Agricultural Food Chemistry, v. 51, p. 7564-7567, 2003. http://dx.doi.org/10.1021/jf034856+
Publication Dates
-
Publication in this collection
13 Nov 2012 -
Date of issue
Dec 2012
History
-
Received
25 Jan 2011 -
Accepted
26 July 2012