Abstract
Decreased gustatory and olfactory capacity is one of the problems caused by tobacco use. The objectives of this study were to determine the sensory profile of six grape nectar samples sweetened with different sweeteners and to verify the drivers of liking in two distinct consumer groups: smokers and nonsmokers. The sensory profile was constructed by twelve trained panelists using quantitative descriptive analysis (QDA). Consumer tests were performed with 112 smokers and 112 nonsmokers. Partial least squares regression analyses was used to identify the drivers of acceptance and rejection of the grape nectars among the two consumer groups. According to the QDA, the samples differed regarding six of the nineteen attributes generated. The absolute averages of the affective test were lower in the group of smokers; possibly because smoking influences acceptance and eating preferences, especially with regard to sweet foods. The results showed that the grape flavor was the major driver of preference for acceptance of the nectar, while astringency, wine aroma, bitterness and sweetness, and bitter aftertaste were drivers of rejection in the two groups of consumers, with some differences between the groups.
quantitative descriptive analysis; partial least squares regression; neotame; sucralose; sensory analysis; fruit nectar
RESEARCH PAPER
Sensory profile and drivers of liking for grape nectar among smoker and nonsmoker consumers
Cristiane Ramos VoorpostelI, * * Corresponding author ; Mariana Borges de Lima DutraII; Helena Maria André BoliniI
IDepartamento de Alimentos e Nutrição - DEPAN, Faculdade de Engenharia de Alimentos - FEA, Universidade Estadual de Campinas - UNICAMP, Campinas, SP, Brazil, e-mail: cristianerv@hotmail.com
IIInstituto Federal de Educação, Ciência e Tecnologia do Sul de Minas Gerais - IFSULDEMINAS, Campus Inconfidentes, Inconfidentes, MG, Brazil
ABSTRACT
Decreased gustatory and olfactory capacity is one of the problems caused by tobacco use. The objectives of this study were to determine the sensory profile of six grape nectar samples sweetened with different sweeteners and to verify the drivers of liking in two distinct consumer groups: smokers and nonsmokers. The sensory profile was constructed by twelve trained panelists using quantitative descriptive analysis (QDA). Consumer tests were performed with 112 smokers and 112 nonsmokers. Partial least squares regression analyses was used to identify the drivers of acceptance and rejection of the grape nectars among the two consumer groups. According to the QDA, the samples differed regarding six of the nineteen attributes generated. The absolute averages of the affective test were lower in the group of smokers; possibly because smoking influences acceptance and eating preferences, especially with regard to sweet foods. The results showed that the grape flavor was the major driver of preference for acceptance of the nectar, while astringency, wine aroma, bitterness and sweetness, and bitter aftertaste were drivers of rejection in the two groups of consumers, with some differences between the groups.
Keywords: quantitative descriptive analysis; partial least squares regression; neotame; sucralose; sensory analysis; fruit nectar.
1 Introduction
The market for non-alcoholic beverages is constantly increasing. The reason for this preference is the consumers' concern about healthy foods and beverages as part of the desire for health and fitness. Recently, society has shown a remarkable interest in the commercialization of juices and nectars in various forms (Carvalho et al., 2005). There is an incentive to produce grape juice because it has important nutritional properties (Burin et al., 2010) such as antioxidant activity due to the presence of phenolic compounds (Rizzon & Mielle, 2012).
Grape nectar is an unfermented beverage ready for consumption and is obtained from the dilution of fruit pulp in drinking water, with or without addition of sugars and acids. According to Brazilian law, grape nectar should contain at least 30% fruit pulp in its formulation (Brasil, 2003, 2004).
The use of non-nutritive sweeteners in foods and beverages has increased over the last 35 years (Anderson et al., 2012). These products are sugar substitutes and provide sweetness without contributing to energy intake (Blackburn et al., 1997). Non-nutritive sweeteners often have undesirable flavor characteristics, such as residual bitter or metallic tastes, which may limit their use in certain foods or beverages (Salminen & Halikainen, 1990). Several studies (Morais et al., 2014; Melo et al., 2009; Brito & Bolini, 2010; Cardoso & Bolini, 2008) have shown that sweeteners have different characteristics depending on the type of food or beverage they are added to, most likely due to the interaction of the sweetener molecules with other constituents present in the product. The physical and chemical composition of the medium in which the sweetener is dispersed, its concentration, the presence of other ingredients, the temperature of consumption, and the sensitivity of the panelists are important factors that affect the perception of flavor and intensity (Nabors, 2001).
Sensory analysis is the main technique used in product development and quality control to assess the flavor of food products and to verify the most suitable sweetener to substitute sucrose in the product of interest (Cardoso & Bolini 2008; Schiffman et al., 1995). A descriptive analysis provides a complete quantitative description of the sensory properties of a product, and when a consumer test is also performed, it serves as a basis to identify the most important attributes of a product that affect and direct consumer preference (Stone & Sidel, 2004). In this case, partial least squares regression analyses (PLSR) can be used to relate the results of a quantitative descriptive analysis and consumer preference data. By relating the sensory descriptive data and hedonic consumer responses, PLSR provide information about how the attributes can influence positively or negatively consumer preference for a given product (Hubert & Vanden Branden, 2003; Tenenhaus et al., 2005).
One of the health problems caused by tobacco use is the decrease in gustatory and olfactory capacity (Shiffman, 1999) caused by nicotine, an alkaloid substance that interferes with the anatomy of the taste buds (Tomassini et al., 2007). This interference contributes to the decrease of the basic perception of sweet, bitter, sour, and salty tastes (Sato et al., 2002; Mela 1989), and it affects preference and food intake (Grunberg, 1982). The World Health Organization (2008) estimated that one third of the adult population smokes, i.e., one billion and 200 million people.
The objective of this study was to evaluate the influence of different sweeteners on the sensory profile, acceptability, and drivers of preference for grape nectar amongst smoker and nonsmoker consumers.
2 Materials and methods
2.1 Material
Samples of grape nectar were prepared using whole grape juice with 14°Brix (Ebba S/A. Araguari), filtered water, sweeteners, and sucrose (União®). The sweeteners used in the preparation of the samples were sucralose (Niutang Chemical Company), neotame (Nutrasweet), aspartame (Clangmao), a 2:1 mixture of sodium cyclamate (Rainbow Rich), saccharin (Sweetmix), and stevia rebaudiana with 95% rebaudioside (Sweetmix).
2.2 Methods
Sample preparation
The optimal concentration of whole juice nectar was predetermined with 60 consumers of fruit juice using the just-about-right scale (Vivckers, 1988; Meilgaard et al., 2004) as 1:1 (whole grape juice 14°Brix:water).
The selection criterion of smoker tasters to perform the ideal sweetness test, magnitude estimation test, and acceptance test was done according to Pan American Health Organization, people are considered to be smokers if they have smoked more than 100 cigarettes or 5 packs of cigarettes in their entire life and currently smoke (Organización Panamericana de la Salud, 1995).
The ideal sweetness was previously determined by groups of smoking (n = 49) and nonsmoking consumers (n = 49) using the just-about-right scale (Vivckers, 1988; Meilgaard et al., 2004). The optimum sucrose concentration was 6.7% for smokers and 5.6% for nonsmokers.
Equivalent quantities of sweeteners to be added to samples of grape nectar were also previously determined by two groups, smokers and nonsmokers, using the method of magnitude estimation (Stone & Oliver, 1969).
Six samples were used in the tests with the nonsmoker assessors, one of them with 5.6% sucrose and the sweeteners with sweetness equivalence : 0.0307 % of aspartame, 0.0199 % of cyclamate/saccharin (2:1), 0.0009% of neotame, 0.0088% of sucralose and 0.0550% of stevia; and other six samples with 6.7% of sucrose were prepared to perform the sensory tests with smoker and the sweeteners with sweetness equivalence : 0.0368% of aspartame, 0.0241% of cyclamate/saccharin (2:1), 0.0010% of neotame, 0.0106% of sucralose and 0.0670% of stevia.
Nectar samples were prepared the laboratory on the day before the assay. Each sample was manually homogenized for 3 minutes. After preparation, the samples were maintained in a refrigerator at 6 ± 2ºC and served at a temperature of 10 ± 2°C.
2.3 Sensory profiling
A sensory profile of the six grape nectar samples was obtained using quantitative descriptive analysis (QDA), according to the method proposed by Stone & Sidel (2004). QDA was performed only with nonsmoker panelists since its objective was product characterization. The samples were prepared with optimum sucrose concentration 5.6% and sweeteners with sweetness equivalence previously determined by nonsmoker assessors.
Selection of the panelists
The panelists were pre-selected based on their discrimination capacity using the sequential analysis of Wald (Amerine et al., 1965). Triangular difference tests were performed with 26 candidates who analyzed three samples of grape nectar that differed with respect to sweetness at a level of 0.1% significance, obtained in the previous paired test. After pre-selection, 15 panelists were selected.
Development of the descriptive terminology
Using Kelly's repertory grid method (Moskowitz, 1983), the fifteen pre-selected panelists reviewed the six samples of grape nectar presented in pairs. The similarities and differences of the samples in relation to their appearance, aroma, flavor, and texture were evaluated. The panelists reached a consensus on the nineteen most important sensory attributes and their definitions and references of the maximum and minimum intensity to compose the analysis ballot.
Training and final panelist selection
Four training sessions were conducted for ten days, each lasting two hours. The panelists individually analyzed the attributes of the grape nectar samples and their identified references. Each panelist assessed the six samples in four replicates and on four different days. For this assessment, a 9-centimeter non-structured linear scale anchored with ''none" or ''weak", and ''strong" or "high", depending on the attribute, was used. The samples were presented monadically to the panelists in a balanced complete block design (MacFie et al., 1989). According to their discriminatory (p < 0.50) and repeatability capacity (p ˃ 0.05) (Damasio & Costell, 1991), twelve out of the fifteen panelists were selected to make up the final QDA team.
Sensory analysis
The tests were performed at the Laboratory of Sensory Science and Consumer Studies of the FEA/DEPAN, State University of Campinas. The samples were served in white plastic cups coded with three digit numbers and arranged on isothermal trays. The panelists performed the analyses in four replicates and on four different days in individual cabins with white light.
2.4 Analysis of acceptance
A total of 112 nonsmoker and 112 smoker consumers evaluated the grape nectar samples sweetened with different sweeteners. For the nonsmoker consumers, six different samples were prepared: one of them with 5.6% of sucrose (defined as ideal sweetness) and the other five in equi-sweetness concentration for each sweetener: aspartame, cyclamato/sacharyn 2:1, neotame, sucralose, and stevia with 95% stevioside. For the smoker consumers, the same procedure was applied but using sucrose concentration considered optimal for this group (6.7% of sucrose) and their equivalent amounts of sweeteners.The affective test was performed using 9-centimeter non-structured linear scales (Nabors, 2001) anchored at the extremes by "extremely dislike" and "extremely like". Aliquots of 25 ml of each sample were presented monadically to the consumers in a balanced complete block design (Walkeling & MacFie, 1995). The panelists were given water between samples to cleanse the palate. This research project was approved by the University of Campinas Research Ethics Committee, process number 12664713.0.0000.5404, in accordance with resolution 196/96 of the Brazilian health council.
2.5 Statistical analysis
QDA results were analyzed by ANOVA using two factors (panelist and sample) and their interaction, followed by Tukey's honestly significant difference (HSD) test.
QDA data were correlated with the data obtained in the analysis of acceptance for smoker and nonsmoker consumers using PLSR (Tenenhaus et al., 2005). Principal component analyses (PCA) was also performed with each sample of the descriptive quantitative analysis using the SAS software - version 8.2 (Statistical Analisys System Institute, 2012).
The acceptability results were analyzed by ANOVA, using two factors (consumer and sample), and Tukey's HSD average test. A t-test was performed for each sample and each attribute average to verify whether there was statistical difference (p ≥ 0.05) between smoker and nonsmoker acceptability results
The statistical analyses were performed using the SAS software - version 8.2) (Statistical Analisys System Institute. 2012) and XLSTAT for Windows version 2012.5 (XLSTAT, 2007), both licensed to the State University of Campinas.
3 Results and Discussion
3.1 Quantitative descriptive analysis
Table 1 shows the 19 descriptor terms generated by the panelists for the grape nectar. The results of the Tukey test for each grape nectar sample are shown in Table 2. The samples showed significant differences (p < 0.05) in six of the nineteen attributes in the descriptive test and the flavor descriptors were the attributes that changed the most as a function of the addition of sweeteners. In other fruit nectar studies (Brito & Bolini, 2010; Cardoso & Bolini, 2008), the replacement of sucrose with high intensity sweeteners caused more changes in the descriptive sensory profiles. It is likely that this did not happen in the present study because the samples had higher proportion of pulp (1:1) since an ideal dilution test was previously performed. In addition, the physicochemical properties of grape juice are different from those of other fruit juices.
The samples sweetened with cyclamate/saccharin 2:1 and aspartame had the highest averages for the presence of foam, differing from the other samples (p < 0.05). In a study performed by Cardoso & Bolini (2008) on peach nectar samples supplemented with sucrose and different sweeteners, there were no differences regarding color and brightness, and the sample containing sucrose showed the highest apparent viscosity.
The four descriptive terms for aroma did not differ (p ˃ 0.05), implying that the sweeteners used had little influence on the nectar aroma. Similar results were observed in for the aroma attribute in samples of mango nectars prepared with different sweeteners (Cadena et al., 2013).
For the descriptive term grape flavor, the samples sweetened with sucrose and stevia showed the highest and the lowest sensory scores, respectively, statistically differing from each other (p < 0.05). The bitter aftertaste and bitterness characteristics of the stevia sample were higher than that of the grape flavor, an important attribute for grape nectars. According to the results shown in Table 2, the descriptive terms bitterness, bitter aftertaste, and sweet aftertaste were influenced by the substitution of sucrose for sweeteners.
The intensity of the sweet aftertaste was higher in the sample prepared with neotame and did not differ statistically from the sample with stevia. The other samples did not differ statistically (p ˃ 0.05) regarding this attribute. The occurrence of a sweet aftertaste was reported by Cadena et al. (2013), when replacing sucrose with neotame in mango nectar. On a study on the sensory profiles of peach nectars sweetened with different sweeteners (Cardoso & Bolini, 2008), reported higher averages of this attribute were found in samples sweetened with stevia and aspartame when compared to the other sweeteners; nevertheless, this study did not use neotame as a sucrose substitute.
The grape nectar sample sweetened with stevia with 95% rebaudioside A showed the highest bitter taste and bitter aftertaste (Table 2), differing (p < 0.05) from the others. Lower bitterness was observed in the samples prepared with sucrose, sucralose, and aspartame. Several studies have shown similar results for stevia, indicating its bitter taste and bitter aftertaste (Melo et al., 2009; Brito & Bolini, 2010; Cardoso & Bolini, 2008). The occurrence of a bitter aftertaste was also reported by Cadena et al. (2013) in mango nectars sweetened with stevia.
The samples prepared with sucrose and neotame showed higher intensity for sweet taste; although they differed statistically (p < 0.05) only from the sample prepared with aspartame. Results contrary to those of the present study were observed in peach nectar (Cardoso & Bolini, 2008) and soluble coffee (Moraes, 2008), in which the highest sweetness was observed in samples sweetened with aspartame. Brito & Bolini (2010) observed higher sweetness intensity in samples of guava nectar sweetened with stevia.
The samples sweetened with sucrose and sucralose did not significantly differ (p> 0.05) with regard to any of the descriptive terms, indicating that these sweeteners have very similar sensory profiles to those of the grape nectar.
Therefore the replacement of sucrose with sucralose in this type of nectar appears to be promising.
There was no significant difference (p > 0.05) for the descriptive terms apparent viscosity and body of the grape nectar samples. In peach nectars, changes in the body attribute have been reported, while in guava nectars the presence of sweeteners in the formulation affected the grittiness and body attributes (Brito & Bolini, 2010; Cardoso & Bolini, 2008). In mango nectars with sweeteners, Cadena et al. (2013) did not find significant differences (p > 0.05) in terms of texture. In addition, there was no variation in the attribute of viscosity during the 120 days of storage time.
It is likely that physicochemical properties have contributed to the fact that the replacement of sucrose with sweeteners did not change the nectar texture.
The results of the QDA were subjected to a principal components analysis (PCA), which indicated similarities and differences between samples. The first and second components explained 44.84% of the variability between the samples; it is likely that this low percentage occurred because the samples did not change significantly in terms of sensory attributes due to the addition of sweeteners to replace sucrose. In Figure 1, the sucrose and sucralose samples are close to each other, indicating similarities between them. The stevia sample was characterized as bitter and astringent providing a bitterer and sweet aftertaste. The grape nectar samples sweetened with aspartame and cyclamate/saccharin are close to each other and were characterized by the presence of foam. The sample prepared with stevia is opposite and distant from the sucrose sample, indicating significant differences between these samples.
3.2 Acceptance test
Amongst the nonsmoking consumers (n=112), 59% were female and 41% were male. The participants were between 18-30 (92.8%) and 31-40 years old (7.2%). In the smokers' group (n = 112), 37.5% were female and 62.5% were male, and their ages ranged from 18-30 (84.2%) and from 31-40 (15.8%). In this group, the respondents had been active smokers for an average of 8.4 years and reported smoking currently an average of 9.5 cigarettes per day.
After performing the Tukey test for the two groups of consumers, it was possible to verify that the average acceptance for all attributes and all samples were lower between the smokers, but it was not possible to affirm whether the averages differed significantly between groups. Therefore, a t-test (t student) was performed using Microsoft Office Excel 2007. The results show that for the attributes appearance, aroma, texture, and global impression the means differ significantly (p < 0.05). For the flavor attribute, there was no significant difference (p ˃ 0.05) between the samples prepared with stevia and aspartame for the attribute flavor.
According to Tables 3 and 4, there was no significant difference (p > 0.05) in appearance and aroma between the grape nectar samples evaluated by both smokers and nonsmokers. For the flavor attribute, among the nonsmoking consumers, the sample prepared with sucrose showed higher sensory acceptance, and it did not differ from the sample sweetened with sucralose, while the lowest acceptance for this attribute was observed in the sample sweetened with stevia. The sample sweetened with sucrose was also the most accepted among smokers, and the sample sweetened with stevia was the least accepted, but the other samples did not differ (p ˃ 0.05) from the nectars sweetened with sucrose and stevia. There was little difference in acceptance for the attribute flavor among the smokers. The elevation of taste thresholds (lower sensibility to for detection and recognition) for the basic tastes for smokers has been demonstrated in some studies (Sato et al., 2002; Mela, 1989; Pavlos et al., 2009; Krut et al., 1961). It is possible that this lower sensibility most likely interfered with the perception of flavor and downplayed some of the differences between the samples caused by the sweeteners, thus making the smoker consumers to perceive less flavor changes caused by the addition of sweeteners.The samples sweetened with sucrose, sucralose, and cyclamate/saccharin had greater acceptance regarding overall impression by the group of nonsmoker consumers, and lower acceptance was observed for the sample prepared with stevia. Regarding the smokers' group, greater acceptance for overall impression was verified for the nectars containing sucrose, and it did not differ from the samples with aspartame, cyclamate/saccharin, and sucralose, and the lowest acceptance was observed for the nectar containing stevia. There was no significant difference (p > 0.05) in the overall acceptance for sucrose, sucralose, and cyclamate/saccharin (2:1) for both consumer groups; although, according to the QDA (Table 2), the cyclamate/saccharin sample had a different sensory profile compared to that of the sucrose and sucralose samples.
The lower sensory acceptance for overall impression for the samples sweetened with stevia and neotame can be attributed to their higher intensities of sweet aftertaste, bitter aftertaste, and bitter taste, which characterized these samples in the QDA, but they are not the sensory characteristics of grape nectar samples, and therefore they are not desirable.
According to Table 4, the results of the different attributes evaluated by smoker consumers had average scores below six. In the 9-point hedonic scale (Muñoz et al., 1992), a value of 6 was considered a score of commercial acceptance or a quality threshold.
The low overall acceptance of the grape nectar by the smokers is possibly related to the decreased pleasure of sweet taste among this group of consumers (Sato et al., 2002; Perkins et al., 1990). The distaste for sweet substances among smokers was described by Redington (1984) as one of the effects of tobacco on taste, and according to this author, this fact may affect food preferences of this group. Reduced consumption of primarily sweet foods was observed after administration of nicotine both in animals and humans (Grunberg, 1982). An increase in acceptance of sweet foods was verified by Rodin (1987) in former smokers, suggesting possible changes in the perception of tastes caused by nicotine.
3.3 Correlation between descriptive attributes and acceptance by the PLS
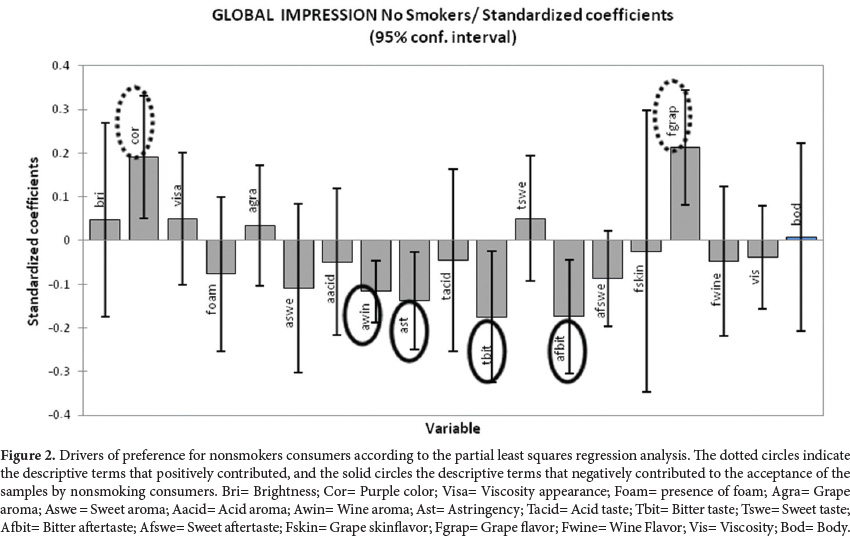
Figures2 and 3 show the correlation between the QDA results and hedonic responses for the overall impressions of the consumers and allow the identification of descriptive terms that positively and negatively affected the acceptance of nonsmoker (Figure 2) and smoker consumers (Figure 3 ) at a confidence interval of 95%. This correlation was determined using the partial least squares regression analysis (PLS) (Tenenhaus et al., 2005).
Color was a driver of positive preference for the grape nectar among the nonsmoking consumers. In the affective test for the appearance attribute, which in the case of juices is very closely related to color, higher averages (p < 0.05) were obtained for this group of consumers. Gössinger et al. (2008) demonstrated that color had a significant impact on the buying decision of strawberry nectars, which did not change as a function of the age, gender, or spending habits of consumers. Although nectars are sold in packages that do not allow the visualization of their color and therefore does not influence the first decision of the consumer, at the time of consumption, it becomes important and can determine next choices.
Grape flavor was a driver of positive preference for grape nectar in both consumer groups. In the QDA, the sample prepared with sucrose had the highest sensory score for this attribute, significantly different (p < 0.05) from that of the stevia sample, which showed the lowest average for the grape flavor. The attributes bitter taste and aftertaste, which characterized the sample sweetened with stevia, are undesirable in fruit nectars because these attributes reduce the perception of the fruit flavor changing the characteristics of the product.
The attributes wine aroma, astringency, bitterness, bitter aftertaste, and sweet aftertaste were drivers of preference that negatively contributed to the acceptance of grape nectars by smoker and nonsmoker consumers.
In the acceptance test, the samples sweetened with stevia had the lowest averages for the overall impression attribute for both consumer groups. The QDA results demonstrated that this sample was characterized by a bitter taste and both bitter and sweet aftertastes, descriptive terms considered as drivers of negative preference by consumers in the PLS regression although the sweet aftertaste was a negative driver of preference for grape nectar among the smoker consumers only.
Perhaps the persistence of a sweet taste in the mouth was more displeasing to smokers due to the reduced pleasure of sweet tastes caused by tobacco use (Grunberg, 1982; Perkins et al., 1990).
Wine aroma was a driver of negative preference only among the nonsmoking consumers. Wine aroma may not have displeased the smoking consumers, possibly because smokers have greater difficulty perceiving aroma due to their reduced ability to identify odors (Frye, 1990; Vennemann et al., 2008).
4 Conclusions
The grape nectar sample sweetened with sucralose had a sensory profile very similar to that of sucrose.
Among the nonsmoker consumers, the samples with sucrose, sucralose, and cyclamate/saccharin (2:1) were the most accepted (p < 0.05), while among the smokers, aspartame was also included among the most accepted (p < 0.05).
The findings of the present study indicate that the major attributes for the acceptance of grape nectar were grape color and grape flavor, while astringency, wine aroma, bitter taste, and bitter and sweet aftertastes were drivers of rejection. All of the samples studied had low global acceptance (p < 0.05) among the smoker consumers, possibly because smoking influenced their acceptance and consumption preferences. Accordingly, attention should also be given to the fact that the sweet aftertaste was a rejection attribute only among smokers. Bitter taste and bitter aftertaste, drivers of negative preference, contributed to lower acceptance of the sample sweetened with stevia in both consumer groups.
Acknowledgments
The present study was conducted with the financial support of the Coordination for the Improvement of Higher Education Personnel (CAPES) and the National Council for Scientific and Technological Development (CNPq).
References
Amerine, M. A., Pangborn, R. M., & Roessler, E. B. (1965). Principles of sensory evaluation of food. New York: Academic Press.
Anderson, G., Foreyt, J., Sigman-Grant, M., & Allison, D. B. (2012). The Use of Low-Calorie Sweeteners by Adults: Impact on Weight Management. Journal of Nutrition. 142(6 Suppl), 1163S-9S. http://dx.doi.org/10.3945/jn.111.149617
Blackburn, G. L, Kanders, B. S., Lavin, P. T., Keller, S. D., & Whatley, J. (1997). The effect of aspartame as part of a multidisciplinary weight-control program on short- and long-term control of body weight. American Journal of Clinical Nutrition, 65, 409-18.
Brasil, Ministério da Agricultura e do Abastecimento. (2004). Normas referentes à complementação dos padrões de identidade e qualidade de vinho e dos derivados da uva e do vinho (Portaria nº 55, de 27 de julho de 2004). Diário Oficial da República Federativa do Brasil. Retrieved from www.agricultura.gov.br.
Brasil. Ministério da Agricultura, Pecuária e Abastecimento. (2003). Regulamento técnico geral para fixação de identificação e qualidade gerais para suco tropical (Instrução normativa nº 12. de 4 de setembro de 2003). Diário Oficial da República Federativa do Brasil. Retrieved from www.agricultura.gov.br.
Brito, C. A. K., & Bolini, H. M. A. (2010). Sensory Profile of Sweetners in Guava Nectar. Alimentos e Nutrição, 20, 561-572.
Burin, V. M., Falcão, L. D., Gonzaga, L. V., Fett, R., Rosier, J. P., & Bordignon-Luiz, M. T. (2010). Colour, phenolic content and antioxidant activity of grape juice. Ciência e Tecnologia de Alimentos, 30(4), 1027-1032. http://dx.doi.org/10.1590/S0101-20612010000400030
Cadena, R. S., Cruz, A. G., Netto, R. R., Castro, W. F., Faria, J. A. F., & Bolini, H. M. A. (2013). Sensory Profile And Physicochemical Characteristics Of Mango Nectar Sweetened With High Intensity Sweeteners Throughout Storage Time. Food Research International, 54(2), 1670-1679. http://dx.doi.org/10.1016/j.foodres.2013.10.012
Cardoso, J. M. P., & Bolini, H. M. A. (2008). Descriptive profile of peach nectar sweetened with sucrose and different sweeteners. Journal of Sensory Studies, 23, 804-816. http://dx.doi.org/10.1111/j.1745-459X.2008.00187.x
Carvalho, J. M., Maia, G. A., Figueiredo, R. W., Brito, E. S., & Garruti, D. S. (2005). Bebida mista com propriedade estimulante à base de água de coco e suco de caju clarificado. Ciência e Tecnologia de Alimentos, 25(4), 813-818. http://dx.doi.org/10.1590/S0101-20612005000400030
Damasio, M. H., & Costell, E. (1991). Análisis sensorial descriptivo: Generación de descriptores y selección de catadores. Revista de Agroquimica y Tecnologia de Alimentos, 31(2), 165-178.
Frye, R. E., Schwartz, B. S., & Doty, R. L. (1990). Dose-related effects of cigarette smoking on olfactory function. JAMA, 263(9), 1233-36. http://dx.doi.org/10.1001/jama.1990.03440090067028
Gössinger, M. F., Mayer, N., Radocha, M., Höfler, A., Boner, E., Groll, E., Nosko, R., Bauer., & Berghofer, E. (2008). Consumer's colour acceptance of strawberry nectars from puree. Journal of Sensory Studies, 24, 78-92. http://dx.doi.org/10.1111/j.1745-459X.2008.00196.x
Grunberg, N. E. (1982). The effects of nicotine and cigarette smoking on food consumption and taste preferences. Addictive Behaviors, 7, 317-331. http://dx.doi.org/10.1016/0306-4603(82)90001-6
Hubert, M., & Vanden Branden, K. (2003). Robust methods for partial least squares regression. Journal of Chemometrics, 17, 537-549. http://dx.doi.org/10.1002/cem.822
Krut, L. H., Perrin, M. J., & Bronte-Stewart, B. (1961). Taste perception in smokers and non-smokers. BMJ : British Medical Journal, 1, 384-387. http://dx.doi.org/10.1136/bmj.1.5223.384
MacFie, H. J., Bratchell, N., Greenhoff, K., & Vallis, L. V. (1989). Designs to balance the effect of order of presentation and first-order carry-over effect in halls tests. Journal of Sensory Studies, 4, 129-148. http://dx.doi.org/10.1111/j.1745-459X.1989.tb00463.x
Meilgaard, M., Civille, G. V., & Carr, B. T. (2004). Sensory Evaluation Techniques (3. ed.). New York: CRC Press.
Mela, D. J. (1989). Gustatory function and dietary habits in users and nonusers of smokeless tobacco. American Journal of Clinical Nutrition, 49, 482-489.
Melo, L. L. M. M., Bolini, H. M. A., & Efrai, P. (2009). Sensory profile. acceptability. and their relationship for diabetic/reduced calorie chocolates. Food Quality and Preference, 20, 138-143. http://dx.doi.org/10.1016/j.foodqual.2008.09.001
Moraes, P. C. B. T. (2008). O impacto do uso de edulcorantes em bebidas de café solúvel e café torrado/moído como substitutos da sacarose (Tese de doutorado). Faculdade de Engenharia de Alimentos, Universidade Estadual de Campinas, Campinas, São Paulo.
Morais, E. C., Cruz, A. G., Faria, J. A. F., & Bolini, H. M. A. (2014). Prebiotic gluten-free bread: Sensory profiling and drivers of liking. LWT - Food Science and Technology, 55(1), 248-254. http://dx.doi.org/10.1016/j.lwt.2013.07.014
Moskowitz, H. R. (1983). Product testing and sensory evaluation of foods. Westport: Food & Nutrition Press.
Muñoz, A. M., Civille, V. G., & Carr, B. T. (1992). Sensory evaluation in quality control. New York: Van Mostrand Reinhold.
Nabors, L. O. (2001). Alternative sweeteners. New York: Marcel Dekker Inc.
Organización Panamericana de la Salud. (1995). Guias para el Control y Monitoreo de la Epidemia Tabaquica.
Pavlos, P., Vasilios, N., Antonia, A., Dimitrios, K., Georgios, K., & Georgios, A. (2009). Evaluation of young smokers and non-smokers with electrogustometry and contact endoscopy. BMC Ear, Nose and Throat Disorders, 9, 9 -16. http://dx.doi.org/10.1186/1472-6815-9-9
Perkins, K. A., Epstein, L. H., Stiller, R. L., Femstrom, M. H., Sexton, J. E., & Jacob, R. G. (1990). Perception and hedonics of sweet and fat taste in smokers and nonsmokers following nicotine intake. Pharmacology Biochemistry and Behavior, 35, 671-676. http://dx.doi.org/10.1016/0091-3057(90)90306-3
Redington, K. (1984). Taste differences between cigarette smokers and nonsmokers. Pharmacology Biochemistry and Behavior, 21, 203-208. http://dx.doi.org/10.1016/0091-3057(84)90215-6
Rizzon, L. A., & Mielle, A. (2012). Analytical characteristics and discrimination of Brazilian commercial grape juice, nectar, and beverage. Ciência e Tecnologia de Alimentos, 32(1), 93-97. http://dx.doi.org/10.1590/S0101-20612012005000015
Rodin, J. (1987). Weight change following smoking cessation: the role of food intake and exercise. Addictive Behaviors, 12, 303-317. http://dx.doi.org/10.1016/0306-4603(87)90045-1
Salminen, S., & Halikainen, A. (1990). Sweeteners. In A. L. Bransen, P. M. Davidson, & S. Salminen (Eds.), Food Additives (pp. 297-327). New York: Marcel Dekker Inc.
Sato, K., Endo, S., & Tomita, H. (2002). Sensitivity of three loci on the tongue and soft palate to four basic tastes in smokers and non-smokers. Acta oto-laryngologica. Supplementum, 546, 74-82. http://dx.doi.org/10.1080/00016480260046445
Schiffman, S. S., Booth, B. J., Losee, M. L., Pecore, S. D., & Warwick, Z. S. (1995). Bitterness of sweeteners as a function of concentration. Brain Research Bulletin, 36(5), 505-513. http://dx.doi.org/10.1016/0361-9230(94)00225-P
Shiffman, S. S. (1999). Fisiologia do paladar. In: Anais Nestlé: sabor e saciedade, São Paulo.
Statistical Analisys System Institute - SAS. (2012). SAS Users guide: statistics (version 8.2e). Cary.
Stone, H., & Oliver, S. M. (1969). Measurement of the Relative Sweetness of Selected Sweeteners and Sweetener Mixtures. Journal of Food Science, 34(2), 215-222. http://dx.doi.org/10.1111/j.1365-2621.1969.tb00922.x
Stone, H., & Sidel, J. L. (2004). Sensory Evaluation Practices (3rd ed.). Food Science and Technology. International Series.
Tenenhaus, M., Pagès, J., Ambroisine L., & Guinot, C. (2005). PLS methodology to study relationships between hedonic judgments and products characteristics. Food Quality and Preference, 16, 315-325. http://dx.doi.org/10.1016/j.foodqual.2004.05.013
Tomassini, S., Cuoghi, V., Catalani, E., Casini, G., & Bigiani, A. (2007). Long-term effects of nicotine on rat fungiform taste buds. Neuroscience, 147, 803-810. http://dx.doi.org/10.1016/j.neuroscience.2007.04.053
Vennemann, M. M., Hummel, T., & Berger, K. (2008). The association between smoking and smell and taste impairment in the general population. Journal of Neurology, 255, 1121-1126. http://dx.doi.org/10.1007/s00415-008-0807-9
Vivckers, Z. (1988). Sensory specific satiety in lemonade using a Just Right Scale for sweetness. Journal of Sensory Study, 3(1), 1-8. http://dx.doi.org/10.1111/j.1745-459X.1988.tb00425.x
Walkeling, I. N., & MacFie, J. H. (1995). Designing consumer trials balanced for first and higher orders of carry-over effect when only a subset of κ samples from τ may be tested. Food Quality and Preference, 6, 299-308. http://dx.doi.org/10.1016/0950-3293(95)00032-1
World Health Organization - WHO. (2008). Report on the Global Tobacco Epidemic 2008: the MPOWER package. Geneva: WHO.
XLSTAT. (2007). XLStat version 2007.7. Paris: Addinsoft SARL.
Received 06 Jan., 2014
Accepted 31 Jan., 2014 (006248)
- Amerine, M. A., Pangborn, R. M., & Roessler, E. B. (1965). Principles of sensory evaluation of food New York: Academic Press.
- Anderson, G., Foreyt, J., Sigman-Grant, M., & Allison, D. B. (2012). The Use of Low-Calorie Sweeteners by Adults: Impact on Weight Management. Journal of Nutrition. 142(6 Suppl), 1163S-9S. http://dx.doi.org/10.3945/jn.111.149617
- Blackburn, G. L, Kanders, B. S., Lavin, P. T., Keller, S. D., & Whatley, J. (1997). The effect of aspartame as part of a multidisciplinary weight-control program on short- and long-term control of body weight. American Journal of Clinical Nutrition, 65, 409-18.
- Brasil, Ministério da Agricultura e do Abastecimento. (2004). Normas referentes à complementação dos padrões de identidade e qualidade de vinho e dos derivados da uva e do vinho (Portaria nº 55, de 27 de julho de 2004). Diário Oficial da República Federativa do Brasil. Retrieved from www.agricultura.gov.br
- Brasil. Ministério da Agricultura, Pecuária e Abastecimento. (2003). Regulamento técnico geral para fixação de identificação e qualidade gerais para suco tropical (Instrução normativa nº 12. de 4 de setembro de 2003). Diário Oficial da República Federativa do Brasil. Retrieved from www.agricultura.gov.br
- Brito, C. A. K., & Bolini, H. M. A. (2010). Sensory Profile of Sweetners in Guava Nectar. Alimentos e Nutrição, 20, 561-572.
- Burin, V. M., Falcão, L. D., Gonzaga, L. V., Fett, R., Rosier, J. P., & Bordignon-Luiz, M. T. (2010). Colour, phenolic content and antioxidant activity of grape juice. Ciência e Tecnologia de Alimentos, 30(4), 1027-1032. http://dx.doi.org/10.1590/S0101-20612010000400030
- Cadena, R. S., Cruz, A. G., Netto, R. R., Castro, W. F., Faria, J. A. F., & Bolini, H. M. A. (2013). Sensory Profile And Physicochemical Characteristics Of Mango Nectar Sweetened With High Intensity Sweeteners Throughout Storage Time. Food Research International, 54(2), 1670-1679. http://dx.doi.org/10.1016/j.foodres.2013.10.012
- Cardoso, J. M. P., & Bolini, H. M. A. (2008). Descriptive profile of peach nectar sweetened with sucrose and different sweeteners. Journal of Sensory Studies, 23, 804-816. http://dx.doi.org/10.1111/j.1745-459X.2008.00187.x
- Carvalho, J. M., Maia, G. A., Figueiredo, R. W., Brito, E. S., & Garruti, D. S. (2005). Bebida mista com propriedade estimulante à base de água de coco e suco de caju clarificado. Ciência e Tecnologia de Alimentos, 25(4), 813-818. http://dx.doi.org/10.1590/S0101-20612005000400030
- Damasio, M. H., & Costell, E. (1991). Análisis sensorial descriptivo: Generación de descriptores y selección de catadores. Revista de Agroquimica y Tecnologia de Alimentos, 31(2), 165-178.
- Frye, R. E., Schwartz, B. S., & Doty, R. L. (1990). Dose-related effects of cigarette smoking on olfactory function. JAMA, 263(9), 1233-36. http://dx.doi.org/10.1001/jama.1990.03440090067028
- Gössinger, M. F., Mayer, N., Radocha, M., Höfler, A., Boner, E., Groll, E., Nosko, R., Bauer., & Berghofer, E. (2008). Consumer's colour acceptance of strawberry nectars from puree. Journal of Sensory Studies, 24, 78-92. http://dx.doi.org/10.1111/j.1745-459X.2008.00196.x
- Grunberg, N. E. (1982). The effects of nicotine and cigarette smoking on food consumption and taste preferences. Addictive Behaviors, 7, 317-331. http://dx.doi.org/10.1016/0306-4603(82)90001-6
- Hubert, M., & Vanden Branden, K. (2003). Robust methods for partial least squares regression. Journal of Chemometrics, 17, 537-549. http://dx.doi.org/10.1002/cem.822
- Krut, L. H., Perrin, M. J., & Bronte-Stewart, B. (1961). Taste perception in smokers and non-smokers. BMJ : British Medical Journal, 1, 384-387. http://dx.doi.org/10.1136/bmj.1.5223.384
- MacFie, H. J., Bratchell, N., Greenhoff, K., & Vallis, L. V. (1989). Designs to balance the effect of order of presentation and first-order carry-over effect in halls tests. Journal of Sensory Studies, 4, 129-148. http://dx.doi.org/10.1111/j.1745-459X.1989.tb00463.x
- Meilgaard, M., Civille, G. V., & Carr, B. T. (2004). Sensory Evaluation Techniques (3. ed.). New York: CRC Press.
- Mela, D. J. (1989). Gustatory function and dietary habits in users and nonusers of smokeless tobacco. American Journal of Clinical Nutrition, 49, 482-489.
- Melo, L. L. M. M., Bolini, H. M. A., & Efrai, P. (2009). Sensory profile. acceptability. and their relationship for diabetic/reduced calorie chocolates. Food Quality and Preference, 20, 138-143. http://dx.doi.org/10.1016/j.foodqual.2008.09.001
- Moraes, P. C. B. T. (2008). O impacto do uso de edulcorantes em bebidas de café solúvel e café torrado/moído como substitutos da sacarose (Tese de doutorado). Faculdade de Engenharia de Alimentos, Universidade Estadual de Campinas, Campinas, São Paulo.
- Morais, E. C., Cruz, A. G., Faria, J. A. F., & Bolini, H. M. A. (2014). Prebiotic gluten-free bread: Sensory profiling and drivers of liking. LWT - Food Science and Technology, 55(1), 248-254. http://dx.doi.org/10.1016/j.lwt.2013.07.014
- Moskowitz, H. R. (1983). Product testing and sensory evaluation of foods Westport: Food & Nutrition Press.
- Muñoz, A. M., Civille, V. G., & Carr, B. T. (1992). Sensory evaluation in quality control. New York: Van Mostrand Reinhold.
- Nabors, L. O. (2001). Alternative sweeteners. New York: Marcel Dekker Inc.
- Organización Panamericana de la Salud. (1995). Guias para el Control y Monitoreo de la Epidemia Tabaquica.
- Pavlos, P., Vasilios, N., Antonia, A., Dimitrios, K., Georgios, K., & Georgios, A. (2009). Evaluation of young smokers and non-smokers with electrogustometry and contact endoscopy. BMC Ear, Nose and Throat Disorders, 9, 9 -16. http://dx.doi.org/10.1186/1472-6815-9-9
- Perkins, K. A., Epstein, L. H., Stiller, R. L., Femstrom, M. H., Sexton, J. E., & Jacob, R. G. (1990). Perception and hedonics of sweet and fat taste in smokers and nonsmokers following nicotine intake. Pharmacology Biochemistry and Behavior, 35, 671-676. http://dx.doi.org/10.1016/0091-3057(90)90306-3
- Redington, K. (1984). Taste differences between cigarette smokers and nonsmokers. Pharmacology Biochemistry and Behavior, 21, 203-208. http://dx.doi.org/10.1016/0091-3057(84)90215-6
- Rizzon, L. A., & Mielle, A. (2012). Analytical characteristics and discrimination of Brazilian commercial grape juice, nectar, and beverage. Ciência e Tecnologia de Alimentos, 32(1), 93-97. http://dx.doi.org/10.1590/S0101-20612012005000015
- Rodin, J. (1987). Weight change following smoking cessation: the role of food intake and exercise. Addictive Behaviors, 12, 303-317. http://dx.doi.org/10.1016/0306-4603(87)90045-1
- Salminen, S., & Halikainen, A. (1990). Sweeteners. In A. L. Bransen, P. M. Davidson, & S. Salminen (Eds.), Food Additives (pp. 297-327). New York: Marcel Dekker Inc.
- Sato, K., Endo, S., & Tomita, H. (2002). Sensitivity of three loci on the tongue and soft palate to four basic tastes in smokers and non-smokers. Acta oto-laryngologica. Supplementum, 546, 74-82. http://dx.doi.org/10.1080/00016480260046445
- Schiffman, S. S., Booth, B. J., Losee, M. L., Pecore, S. D., & Warwick, Z. S. (1995). Bitterness of sweeteners as a function of concentration. Brain Research Bulletin, 36(5), 505-513. http://dx.doi.org/10.1016/0361-9230(94)00225-P
- Shiffman, S. S. (1999). Fisiologia do paladar. In: Anais Nestlé: sabor e saciedade, São Paulo.
- Statistical Analisys System Institute - SAS. (2012). SAS Users guide: statistics (version 8.2e). Cary.
- Stone, H., & Oliver, S. M. (1969). Measurement of the Relative Sweetness of Selected Sweeteners and Sweetener Mixtures. Journal of Food Science, 34(2), 215-222. http://dx.doi.org/10.1111/j.1365-2621.1969.tb00922.x
- Stone, H., & Sidel, J. L. (2004). Sensory Evaluation Practices (3rd ed.). Food Science and Technology. International Series.
- Tenenhaus, M., Pagès, J., Ambroisine L., & Guinot, C. (2005). PLS methodology to study relationships between hedonic judgments and products characteristics. Food Quality and Preference, 16, 315-325. http://dx.doi.org/10.1016/j.foodqual.2004.05.013
- Tomassini, S., Cuoghi, V., Catalani, E., Casini, G., & Bigiani, A. (2007). Long-term effects of nicotine on rat fungiform taste buds. Neuroscience, 147, 803-810. http://dx.doi.org/10.1016/j.neuroscience.2007.04.053
- Vennemann, M. M., Hummel, T., & Berger, K. (2008). The association between smoking and smell and taste impairment in the general population. Journal of Neurology, 255, 1121-1126. http://dx.doi.org/10.1007/s00415-008-0807-9
- Vivckers, Z. (1988). Sensory specific satiety in lemonade using a Just Right Scale for sweetness. Journal of Sensory Study, 3(1), 1-8. http://dx.doi.org/10.1111/j.1745-459X.1988.tb00425.x
- Walkeling, I. N., & MacFie, J. H. (1995). Designing consumer trials balanced for first and higher orders of carry-over effect when only a subset of κ samples from τ may be tested. Food Quality and Preference, 6, 299-308. http://dx.doi.org/10.1016/0950-3293(95)00032-1
- World Health Organization - WHO. (2008). Report on the Global Tobacco Epidemic 2008: the MPOWER package. Geneva: WHO.
- XLSTAT. (2007). XLStat version 2007.7. Paris: Addinsoft SARL.

Publication Dates
-
Publication in this collection
25 Apr 2014 -
Date of issue
Mar 2014
History
-
Accepted
31 Jan 2014 -
Received
06 Jan 2014