Abstract
Prediction of seed vigor based on hyperspectral peant. The traditional method is time-consuming and laborious to detect seed vigor. At the same time, the accuracy of the detection result is not high, and it will cause damage to the seed itself. Therefore, in order to achieve rapid and non-destructive detection of peanut seed vigor, the test was performed with original health, artificial aging for 24h and Peanut seeds with different vigor gradients at 72 hours were used as the research samples. Hyperspectral images with a wavelength range of 387~1035 nm were collected, and the image of the central part of the peanut seeds with a pixel size of 60 × 60 after correction was intercepted and the average reflectance value was calculated. After a combination of processing analysis, characteristic band processing, and model selection, a hyperspectral prediction system with the highest correlation to the viability of extracted peanut seeds was finally established. Experiments shown that the combination of hyperspectral imaging technology and the MF-LightGBM-RF model had the best performance, with a prediction accuracy of 92.59% and a fitting time of 1.77s, which simplifies the model and improves efficiency.
Keywords:
hyperspectral; predictive modeling; seed viability; non-destructive testing techniques
1 Introduction
Seed vigor is an important indicator that affects seed growth, which can determine the activity of seed embryos during the emergence of seedlings and the sum of all characteristics (Fan et al., 2020Fan, Y., Ma, S., & Wu, T. (2020). Individual wheat kernels vigor assessment based on NIR spectroscopy coupled with machine learning methodologies. Infrared Physics & Technology, 105, 103213. http://dx.doi.org/10.1016/j.infrared.2020.103213.
http://dx.doi.org/10.1016/j.infrared.202...
). The detection of seed vigor can reflect the performance of the potential quality of seeds during planting or storage conditions, and is a key factor affecting the growth and development of seeds. With the extension of storage time, seed vigor decreases with changes in lipid peroxidation (Kandpal et al., 2016Kandpal, L. M., Lohumi, S., Kim, M. S., Kang, J.-S., & Cho, B.-K. (2016). Near-infrared hyperspectral imaging system coupled with multivariate methods to predict viability and vigor in muskmelon seeds. Sensors and Actuators. B, Chemical, 229, 534-544. http://dx.doi.org/10.1016/j.snb.2016.02.015.
http://dx.doi.org/10.1016/j.snb.2016.02....
). High vigor seeds are easier to germinate and produce robust seedlings under favorable conditions, so the non-destructive testing of seed vigor is of great significance for optimizing seed varieties and reducing planting costs (Pang et al., 2021Pang, L., Wang, J., Men, S., Yan, L., & Xiao, J. (2021). Hyperspectral imaging coupled with multivariate methods for seed vitality estimation and forecast for Quercus variabilis. Spectrochimica Acta. Part A: Molecular and Biomolecular Spectroscopy, 245, 118888. http://dx.doi.org/10.1016/j.saa.2020.118888. PMid:32947159.
http://dx.doi.org/10.1016/j.saa.2020.118...
). Peanuts are one of the most important economic crops in the world. In the world, China accounts for 40% of peanuts. At the same time, peanuts have important economic and nutritional value. They can be used to produce peanut butter, peanut oil, desserts or eat directly. After soaking peanuts, the protein, fat and carbohydrate content will change, and the content of the substances will also change after aging (Yulianti et al., 2022Yulianti, L. E., Setiaboma, W., Hakim, A. N., Widowati, E., Afifah, N., & Ekafitri, R. (2022). The effect of beans types and soaking time on the characteristics of Indonesian traditional food “Instant Bose”. Food Science and Technology, 42, e19621. http://dx.doi.org/10.1590/fst.19621.
http://dx.doi.org/10.1590/fst.19621...
). Peanuts are of great significance as raw materials for oil (Zhang et al., 2022Zhang, C.-X., Xi, J., Wang, S.-T., Ma, Y.-X., & Wang, X.-D. (2022). Effects of deep fat frying conditions on the formation of heterocyclic aromatic amines in chicken meat. Food Science and Technology, 42, e67321. http://dx.doi.org/10.1590/fst.67321.
http://dx.doi.org/10.1590/fst.67321...
) and lactobacillus (Shori & Al Zahrani, 2022Shori, A. B., & Al Zahrani, A. J. (2022). Non-dairy plant-based milk products as alternatives to conventional dairy products for delivering probiotics. Food Science and Technology, 42, e101321. http://dx.doi.org/10.1590/fst.101321.
http://dx.doi.org/10.1590/fst.101321...
). In the past 20 years, Chinese peanut export volume has been among the top in the world, accounting for more than 25% of the international market share, and has a certain competitive advantage in the international market (Sun et al., 2020Sun, J., Wang, G., Zhang, H., Xia, L., Zhao, W., Guo, Y., & Sun, X. (2020). Detection of fat content in peanut kernels based on chemometrics and hyperspectral imaging technology. Infrared Physics & Technology, 105, 103226. http://dx.doi.org/10.1016/j.infrared.2020.103226.
http://dx.doi.org/10.1016/j.infrared.202...
). Peanuts have high nutritional value and commercial value. Scientific research shows that peanuts have anti-cancer, anti-oxidation, anti-inflammatory and other biological properties (Menis Candela et al., 2020Menis Candela, F., Giordano, W. F., Quiroga, P. L., Escobar, F. M., Mañas, F., Roma, D. A., Larrauri, M., Comini, L. R., Soria, E. A., & Sabini, M. C. (2020). Evaluation of cellular safety and the chemical composition of the peanut (Arachis hypogaea L.) ethanolic extracts. Heliyon, 6(10), e05119. http://dx.doi.org/10.1016/j.heliyon.2020.e05119. PMid:33083604.
http://dx.doi.org/10.1016/j.heliyon.2020...
). Goudoum et al. (2016)Goudoum, A., Tinkeu, L. S. N., Madou, C., Djakissam, W., & Mbofung, C. M. (2016). Variation of some chemical and functional properties of Bambara groundnut (Voandzeia Subterranean L. Thouars) during sort time storage. Food Science and Technology, 36(2), 290-295. http://dx.doi.org/10.1590/1678-457X.0065.
http://dx.doi.org/10.1590/1678-457X.0065...
have found that the content of protein, fat, starch and free carbohydrates in peanuts will decrease during storage. As the main species of legume, peanut is an important source of vegetable oil protein, minerals and vitamins, and occupies an important agricultural economic position in world agriculture (Chen et al., 2020aChen, B.-Y., Li, Q., Hu, H., Meng, S., Shah, F., Wang, Q., & Liu, H. (2020a). An optimized industry processing technology of peanut tofu and the novel prediction model for suitable peanut varieties. Journal of Integrative Agriculture, 19(9), 2340-2351. http://dx.doi.org/10.1016/S2095-3119(20)63249-X.
http://dx.doi.org/10.1016/S2095-3119(20)...
). In the past 10 years, the world peanut trade has increased from 1.705 billion US dollars to 2 billion US dollars, an increase of 17.3% (Jain et al., 2021Jain, N. K., Jat, R. A., Yadav, R. S., & Meena, H. N. (2021). Conservation agriculture practices improves productivity and sustainability of peanut (Arachis hypogaea)-based cropping systems. Indian Journal of Agricultural Sciences, 91(1), 164-169.). The annual international trade volume of peanuts is 1.5*106t. China, the United States, Argentina and India have always been the four largest peanut exporters in the world (Sadighara & Ghanati, 2021Sadighara, P., & Ghanati, K. (2021). The aflatoxin B1 content of peanut-based foods in Iran: a systematic review. Reviews on Environmental Health, 37(1), 29-33. http://dx.doi.org/10.1515/reveh-2021-0065. PMid:34332516.
http://dx.doi.org/10.1515/reveh-2021-006...
). Therefore, the prediction of peanut seed vigor is of great significance to the impact of peanut yield and quality.
Hyperspectral imaging is a fast non-destructive testing technology that combines machine vision and spectroscopy. This technology has been widely used in the field of agricultural production and processing, and the morphology, internal structure and chemical composition characteristics of the tested raw materials can be obtained (Dana & Ivo, 2008Dana, W., & Ivo, W. (2008). Computer image analysis of seed shape and seed color for flax cultivar description. Computers and Electronics in Agriculture, 61(2), 126-135. http://dx.doi.org/10.1016/j.compag.2007.10.001.
http://dx.doi.org/10.1016/j.compag.2007....
). Zhou et al. (2020)Zhou, S., Sun, L., Xing, W., Feng, G., Ji, Y., Yang, J., & Liu, S. (2020). Hyperspectral imaging of beet seed germination prediction. Infrared Physics & Technology, 108, 103363. http://dx.doi.org/10.1016/j.infrared.2020.103363.
http://dx.doi.org/10.1016/j.infrared.202...
proposed to use hyperspectral imaging technology to predict the germination of sugar beet seeds, and the final classification prediction accuracy rate reached 89%. Zou et al. (2019)Zou, S., Tseng, Y.-C., Zare, A., Rowland, D. L., Tillman, B. L., & Yoon, S.-C. (2019). Peanut maturity classification using hyperspectral imagery. Biosystems Engineering, 188, 165-177. http://dx.doi.org/10.1016/j.biosystemseng.2019.10.019.
http://dx.doi.org/10.1016/j.biosystemsen...
classified peanut maturity through hyperspectral images, using visual classification and digital imaging methods to identify mature pods and immature pods, the highest classification accuracy rate reached 97.18%. Antoine Laborde et al. (2021)Laborde, A., Puig-Castellvi, F., Bouveresse, D. J.-R., Eveleigh, L., Cordella, C., & Jaillais, B. (2021). Detection of chocolate powder adulteration with peanut using near-infrared hyperspectral imaging and Multivariate Curve Resolution. Food Control, 119, 107454. http://dx.doi.org/10.1016/j.foodcont.2020.107454.
http://dx.doi.org/10.1016/j.foodcont.202...
used hyperspectral imaging and multivariate curve resolution analysis to detect peanut powder adulteration in chocolate powder. They used different mixing ratios of the two powders to prepare samples, and conducted a preliminary principal component analysis (PCA) to study the data structure, and used the detection Algorithm for classification. Liu et al. (2020)Liu, Z., Jiang, J., Qiao, X., Qi, X., Pan, Y., & Pan, X. (2020). Using convolution neural network and hyperspectral image to identify moldy peanut kernels. Lebensmittel-Wissenschaft + Technologie, 132, 109815. http://dx.doi.org/10.1016/j.lwt.2020.109815.
http://dx.doi.org/10.1016/j.lwt.2020.109...
used convolutional neural networks and hyperspectral images to identify moldy peanut kernels, and the supernet-pseudo-random model finally constructed had the highest average accuracy, reaching 92.07%. Wang & Cheng (2018)Wang, Y., & Cheng, J. (2018). Rapid and non-destructive prediction of protein content in peanut varieties using near-infrared hyperspectral imaging method. Grain & Oil Science and Technology, 1(01), 40-43. http://dx.doi.org/10.3724/SP.J.1447.GOST.2018.18025.
http://dx.doi.org/10.3724/SP.J.1447.GOST...
used hyperspectral nondestructive testing technology to study the characteristics of peanut internal protein content. After the establishment of the PLSR model, 8 characteristic bands were extracted, and finally the protein prediction showed good performance. He et al. (2021b)He, X., Yan, C., Jiang, X., Shen, F., You, J., & Fang, Y. (2021b). Classification of aflatoxin B-1 naturally contaminated peanut using visible and near-infrared hyperspectral imaging by integrating spectral and texture features. Infrared Physics & Technology, 114, 103652. http://dx.doi.org/10.1016/j.infrared.2021.103652.
http://dx.doi.org/10.1016/j.infrared.202...
used visible light and near-infrared hyperspectroscopy combined with spectral and texture features to classify aflatoxin B1 naturally contaminated peanuts, using RBF kernel support vector machine with the highest accuracy, and the accuracy of the calibration set and verification set reached 93 respectively. % And 94% (He et al., 2021bHe, X., Yan, C., Jiang, X., Shen, F., You, J., & Fang, Y. (2021b). Classification of aflatoxin B-1 naturally contaminated peanut using visible and near-infrared hyperspectral imaging by integrating spectral and texture features. Infrared Physics & Technology, 114, 103652. http://dx.doi.org/10.1016/j.infrared.2021.103652.
http://dx.doi.org/10.1016/j.infrared.202...
). Wang et al. (2021a)Wang, X. W., Xing, X. Y., Zhao, M. C., & Yang, J. R. (2021a). Comparison of multispectral modeling of physiochemical attributes of greengage: Brix and pH values. Food Science and Technology, 41(Suppl. 2), 611-618. http://dx.doi.org/10.1590/fst.21320.
http://dx.doi.org/10.1590/fst.21320...
used hyperspectral image technology combined with physical and chemical index attributes to study the sugar content and pH value of green vegetables, with high modeling accuracy. Chen et al. (2020b)Chen, T., Yang, W., Zhang, H., Zhu, B., Zeng, R., Wang, X., Wang, S., Wang, L., Qi, H., Lan, Y., & Zhang, L. (2020b). Early detection of bacterial wilt in peanut plants through leaf-level hyperspectral and unmanned aerial vehicle data. Computers and Electronics in Agriculture, 177, 105708. http://dx.doi.org/10.1016/j.compag.2020.105708.
http://dx.doi.org/10.1016/j.compag.2020....
used leaf hyperspectral and drone data to detect early peanut bacterial wilt. Research can determine the severity of peanut disease in time, and effective measures can be taken in advance to control. Hyperspectral imaging technology can also study peanut leaf spot disease, analyze the correlation between the spectral index and the disease index, and establish a model for detection (Chen et al., 2019Chen, T., Zhang, J., Chen, Y., Wan, S., & Zhang, L. (2019). Detection of peanut leaf spots disease using canopy hyperspectral reflectance. Computers and Electronics in Agriculture, 156, 677-683. http://dx.doi.org/10.1016/j.compag.2018.12.036.
http://dx.doi.org/10.1016/j.compag.2018....
). Zhang et al. (2020b)Zhang, T., Fan, S., Xiang, Y., Zhang, S., Wang, J., & Sun, Q. (2020b). Non-destructive analysis of germination percentage, germination energy and simple vigour index on wheat seeds during storage by Vis/NIR and SWIR hyperspectral imaging. Spectrochimica Acta. Part A: Molecular and Biomolecular Spectroscopy, 239, 118488. http://dx.doi.org/10.1016/j.saa.2020.118488. PMid:32470809.
http://dx.doi.org/10.1016/j.saa.2020.118...
used hyperspectral non-destructive analysis of the germination rate, germination potential and simple vitality index of wheat seeds during storage, and established a more comprehensive wheat seed vitality classification system. Wang et al. (2021b)Wang, Z., Tian, X., Fan, S., Zhang, C., & Li, J. (2021b). Maturity determination of single maize seed by using near-infrared hyperspectral imaging coupled with comparative analysis of multiple classification models. Infrared Physics & Technology, 112, 103596. http://dx.doi.org/10.1016/j.infrared.2020.103596.
http://dx.doi.org/10.1016/j.infrared.202...
established a multi-classification model of corn seeds to study their maturity through near-infrared spectroscopy, and established a PLS-DA model. Finally, the classification accuracy of this model reached 98.7% and 100% respectively. Zhang et al. (2020a)Zhang, L., Sun, H., Rao, Z., & Ji, H. (2020a). Hyperspectral imaging technology combined with deep forest model to identify frost-damaged rice seeds. Spectrochimica Acta. Part A: Molecular and Biomolecular Spectroscopy, 229, 117973. http://dx.doi.org/10.1016/j.saa.2019.117973. PMid:31887678.
http://dx.doi.org/10.1016/j.saa.2019.117...
established a deep forest model to identify rice freeze-damaged seeds, and adopted three spectral preprocessing methods, three characteristic band extraction methods, and three algorithm models, and the overall classification effect reached 99.33%. Li et al. (2016)Li, B., Hou, B., Zhang, D., Zhou, Y., Zhao, M., Hong, R., & Huang, Y. (2016). Pears characteristics (soluble solids content and firmness prediction, varieties) testing methods based on visible-near infrared hyperspectral imaging. Optik, 127(5), 2624-2630. http://dx.doi.org/10.1016/j.ijleo.2015.11.193.
http://dx.doi.org/10.1016/j.ijleo.2015.1...
analyzed the characteristic test methods of pears based on near-infrared spectroscopy technology, and used 4 types of algorithms to perform spectral analysis on pear samples to detect the SSC, hardness and variety of pears. Tan et al. (2018)Tan, W., Sun, L., Yang, F., Che, W., Ye, D., Zhang, D., & Zou, B. (2018). Study on bruising degree classification of apples using hyperspectral imaging and GS-SVM. Optik, 154, 581-592. http://dx.doi.org/10.1016/j.ijleo.2017.10.090.
http://dx.doi.org/10.1016/j.ijleo.2017.1...
used hyperspectral imaging technology to build the SNV-SPA-GS-SVM model to accurately identify the degree of bruising of apples. The final result showed that the prediction accuracy of the four degrees of bruising of apples was 95%. In the future, peanut detection technology will be more diverse, and peanut by-products will be used in the chemical industry (Kou et al., 2022Kou, X., Zhao, Y., Xu, L., Kang, Z., Wang, Y., Zou, Z., Huang, P., Wang, Q., Su, G., Yang, Y., & Sun, Y. (2022). Controlled fabrication of core–shell γ-Fe2O3@C–Reduced graphene oxide composites with tunable interfacial structure for highly efficient microwave absorption. Journal of Colloid and Interface Science, 615, 685-696. http://dx.doi.org/10.1016/j.jcis.2022.02.023. PMid:35168017.
http://dx.doi.org/10.1016/j.jcis.2022.02...
; Zhao et al., 2021aZhao, Y., Zhang, H., Yang, X., Huang, H., Zhao, G., Cong, T., Zuo, X., fan, Z., Yang, S., & Pan, L. (2021a). In situ construction of hierarchical core-shell Fe3O4@C nanoparticles-helical carbon nanocoil hybrid composites for highly efficient electromagnetic wave absorption. Carbon, 171, 395-408. http://dx.doi.org/10.1016/j.carbon.2020.09.036.
http://dx.doi.org/10.1016/j.carbon.2020....
, bZhao, Y., Zuo, X., Guo, Y., Huang, H., Zhang, H., Wang, T., Wen, N., Chen, H., Cong, T., Muhammad, J., Yang, X., Wang, X., Fan, Z., & Pan, L. (2021b). Structural engineering of hierarchical aerogels comprised of multi-dimensional gradient carbon nanoarchitectures for highly efficient microwave absorption. Nano-Micro Letters, 13(1), 144. http://dx.doi.org/10.1007/s40820-021-00667-7. PMid:34138390.
http://dx.doi.org/10.1007/s40820-021-006...
).
In this study, peanut seeds were used as experimental materials, and the spectral information of three different vigor single peanut seeds was collected by hyperspectral imaging technology, combined with multiple pretreatment methods to establish five classification models of xgboost, catboost, randomforest, SVC, and gbdt, using logic Regression feature selection, LightGBM, tree model for feature band extraction, reduce the impact of low-weight bands on the classification results, and screen out the best processing method. The effects of different pretreatment methods, models, and characteristic waveband extraction methods on the accuracy of identifying single peanut seed vigor are discussed, which provides theoretical support for rapid, non-destructive and effective detection of peanut seed vigor.
2 Materials and methods
2.1 Experimental materials
Peanuts are an important oilseed crop. The average oil content of peanut varieties is about 50%. High oil content is the main goal of peanut breeding and breeding. Peanut kernel yield is an important indicator to measure the quality of peanut production. The oil content of healthy Huayu No. 20 peanuts usually exceeds 55%, and the average grain yield is 3500-4000 (kg ha-1), which is higher than the average index of peanuts (Wang et al., 2020Wang, J., Shi, L., Liu, Y., Zhao, M., Wang, X., Qiao, L., Sui, J., Li, G., Zhu, H., & Yu, S. (2020). Development of peanut varieties with high oil content by in vitro mutagenesis and screening. Journal of Integrative Agriculture, 19(12), 2974-2982. http://dx.doi.org/10.1016/S2095-3119(20)63182-3.
http://dx.doi.org/10.1016/S2095-3119(20)...
). At the same time, as a high oleic peanut variety, it has high storage stability (Zhang et al., 2020Zhang, J., Geng, Y., Guo, F., Li, X., & Wan, S. (2020). Research progress on the mechanism of improving peanut yield by single-seed precision sowing. Journal of Integrative Agriculture, 19(8), 1919-1927. http://dx.doi.org/10.1016/S2095-3119(19)62763-2.
http://dx.doi.org/10.1016/S2095-3119(19)...
), the growth period of summer sowing is about 114 days, and it can be planted on a large scale in most central regions of my country. Therefore, the experimental material selected Huayu No. 20 peanut variety. Select 270 seeds with complete structure, uniform size and no mildew.
2.2 Aging treatment
The experiment used artificial accelerated aging peanut seeds with high temperature and high humidity to simulate the naturally aged peanut seeds stored in the natural environment. Randomly selected 180 peanut seeds with uniform size and no damage, placed them in the HWS constant temperature and humidity incubator, adjusted the temperature to 50 °C and the humidity to 90%, randomly take out 90 of them after 24 hours, and take out the remaining 90 seeds after 72 hours. Performed hyperspectral scanning and roll paper germination test on all peanut seeds taken out. The peanut seed images of the three treatment categories are shown in Figure 1.

Picture (a), picture (b), picture (c) correspond to original healthy peanut seeds, peanut seeds after 24h aging treatment, and peanut seeds 72h aging treatment. It could be seen from the figure that the surface of the original healthy peanuts was smooth without aging cracks, but due to the aging treatment, the surface of the peanut seeds begins to wrinkle, and at the same time, as the aging time increased, the wrinkles became deeper and deeper.
2.3 Hyperspectral imager and analysis software
Peanut hyperspectral image acquisition experiment uses Zhuoli Hanguang's Image-λ “spectral image” series hyperspectrometer and SPACEVIEW software. The hyperspectral imaging system used in the experiment mainly includes: computer, spectrometer, optical fiber, area scanning camera, halogen lamp, sample, transmission platform, etc. The structure diagram of the hyperspectral imager is shown in Figure 2.

2.4 Sprouting test on roll paper
After Hyperspectral collected the image information of 270 peanut seeds, it immediately carried out the roll paper germination test. After each peanut seed is washed with sterile water, it is numbered and placed in an ambient temperature of 25 °C for roll paper germination, and the germination of the peanut seed is checked one week later. When the germination length of the peanut seed exceeds 1mm, it is considered to be germinated and marked as “1”, otherwise it is regarded as not germinated and marked as “0”, and the germination results are recorded in the measured spectrum data table one by one.
2.5 Model evaluation
Randomly select 70% of the reflection spectrum curve data of Huayu No. 20 peanut seed samples as the training set, and use the reflection spectrum curve data of the remaining 30% peanut seed samples as the prediction set, and use the learning algorithm to construct a discriminant model to predict six healthy, unsprouted, Spectral image characteristics of peanut seeds with healthy sprouting, 24h without sprouting, 24h without sprouting after aging, 72h without sprouting after aging, and 72h aging for germinating peanut seeds, using Accuracy, Log Loss, and Jackard's similarity coefficient (Jaccard_similarity), Fit Time (Fit Time) and Hamming Loss (Hamming Loss) are used to measure the effect of evaluating model training predictions.
3 Hyperspectral data processing and analysis
Before extracting the spectral information, the image needs to be corrected in black and white, and then the single peanut seed needs to be separated from the background, that is, the feature region of interest (ROI) is selected, and the seed region and the background region are randomly selected, and each band is calculated The average spectral reflectance of which is selected in the range of 387~1035 nm. The sample peanut spectrum image processing is shown in Figure 3.

4 Germination test and prediction accuracy judgment
The germination results of the test showed that the germination rate of healthy peanut seeds was 82.2%, of which 74 were germinated peanut seeds, 16 were ungerminated peanut seeds, and the germination rate of peanut seeds was 58.8%, of which 53 were germinated peanuts. There were 37 ungerminated peanut seeds, and the germination rate of the peanut seed samples after 72 hours of aging treatment was 21.1%, including 19 germinated peanuts and 71 ungerminated peanuts. The performance of the model is judged by the accuracy of the prediction, and the discrimination involving different seeds is calculated by the following Formulas 1 to 3 .
where H stands for healthy peanut seeds, M stands for 24h aging peanut seeds, L stands for 72h aging peanut seeds, T stands for predicted correct peanut seeds, F stands for predicted wrong peanut seeds, S stands for germinated peanut seeds, and X stands for ungerminated peanut seeds.
5 Modeling method
5.1 Xgboost
The Xgboost algorithm adopts the integrated idea, and the target is divided into containers of different benchmarks, and the weights are calculated and comprehensively evaluated (He et al., 2021aHe, W., He, H., Wang, F., Wang, S., Li, R., Chang, J., & Li, C. (2021a). Rapid and uninvasive characterization of bananas by hyperspectral imaging with extreme gradient boosting (XGBoost). Analytical Letters, 55(4), 620-633. http://dx.doi.org/10.1080/00032719.2021.1952214.
http://dx.doi.org/10.1080/00032719.2021....
).
First define the complexity of the tree. Use the following Formula 4 to define the complexity of the tree:
Split the tree into a structure part and a weight part. Split into the following Formula 5:
Define the residual, the formula is as follows (Equations 6 and 7):
Define the loss function, the formula is as follows (Equation 8):
Expand the original objective function with Taylor's formula (Equation 9 to 12):
5.2 Catboost
CatBoost is a GBDT framework based on symmetric decision trees (oblivious trees) that implements fewer parameters, supports categorical variables and high accuracy. The main pain point it solves is to process categorical features efficiently and reasonably. As you can see from its name, CatBoost is composed of Categorical and Boosting. In addition, CatBoost also solves the problems of gradient bias (Gradient Bias) and prediction shift (Prediction shift), thereby reducing the occurrence of over-fitting, thereby improving the accuracy and generalization ability of the algorithm (Samat et al., 2022Samat, A., Li, E., Du, P., Liu, S., Miao, Z., & Zhang, W. (2022). CatBoost for RS image classification with pseudo label support from neighbor patches-based clustering. IEEE Geoscience and Remote Sensing Letters, 19, 1-5. http://dx.doi.org/10.1109/LGRS.2020.3038771.
http://dx.doi.org/10.1109/LGRS.2020.3038...
).
5.3 Random forest (RF)
Random Forest is actually an improved bagging method, which uses CART tree as a model in bagging. The ordinary decision tree selects an optimal feature from all the sample features on the node as the division of the left and right subtrees (Salas & Subburayalu, 2019Salas, E. A. L., & Subburayalu, S. K. (2019). Modified shape index for object-based random forest image classification of agricultural systemiss using airborne hyperspectral datasets. PLoS One, 14(9). http://dx.doi.org/10.1371/journal.pone.0222474. PMid:31491035.
http://dx.doi.org/10.1371/journal.pone.0...
).
Random Forest (RF) selects a part of the features on the node randomly, and then selects an optimal feature from the sample features of these random calculations as the division of the left and right subtrees, thereby enhancing the generalization ability. It is equivalent to sampling both samples and features.
5.4 Support vector machine (SVM)
Support vector machine is a learning system that uses linear function hypothesis space in high-dimensional feature space, and has good performance in classification. SVM is widely used in phrase recognition, word sense disambiguation, automatic text classification and information filtering (Chen et al., 2014Chen, Y., Zhao, X., & Lin, Z. (2014). Optimizing subspace SVM ensemble for hyperspectral imagery classification. IEEE Journal of Selected Topics in Applied Earth Observations and Remote Sensing, 7(4), 1295-1305. http://dx.doi.org/10.1109/JSTARS.2014.2307356.
http://dx.doi.org/10.1109/JSTARS.2014.23...
).
SVM solving the classification hyperplane problem is equivalent to solving the following equation (C, are the corresponding parameters, and is the nonlinear mapping function,) (Equations 13 and 14).
Obtained by solving the saddle point of the Largerange function (Equations 15 and 16):
Among them, K (·) is the kernel function that satisfies the Mercer condition, and the corresponding SVM discriminant function is (Equation 17):
5.5 Gbdt
GBDT is a widely used algorithm that can be used for classification and regression. The difference between Gradient Boost and traditional Boost is that each calculation is to reduce the last residual (residual), and in order to eliminate the residual, we can build a new model in the direction of the gradient of the residual reduction (Gradient) (Alcolea & Resano, 2021Alcolea, A., & Resano, J. (2021). FPGA accelerator for gradient boosting decision trees. Electronics, 10(3), 314. http://dx.doi.org/10.3390/electronics10030314.
http://dx.doi.org/10.3390/electronics100...
). Therefore, in Gradient Boost, the resume of each new model is to reduce the residual of the previous model in the direction of the gradient, which is very different from traditional Boost for weighting correct and incorrect samples.
6 Results and discussion
6.1 Characteristic spectrum analysis of peanut seeds
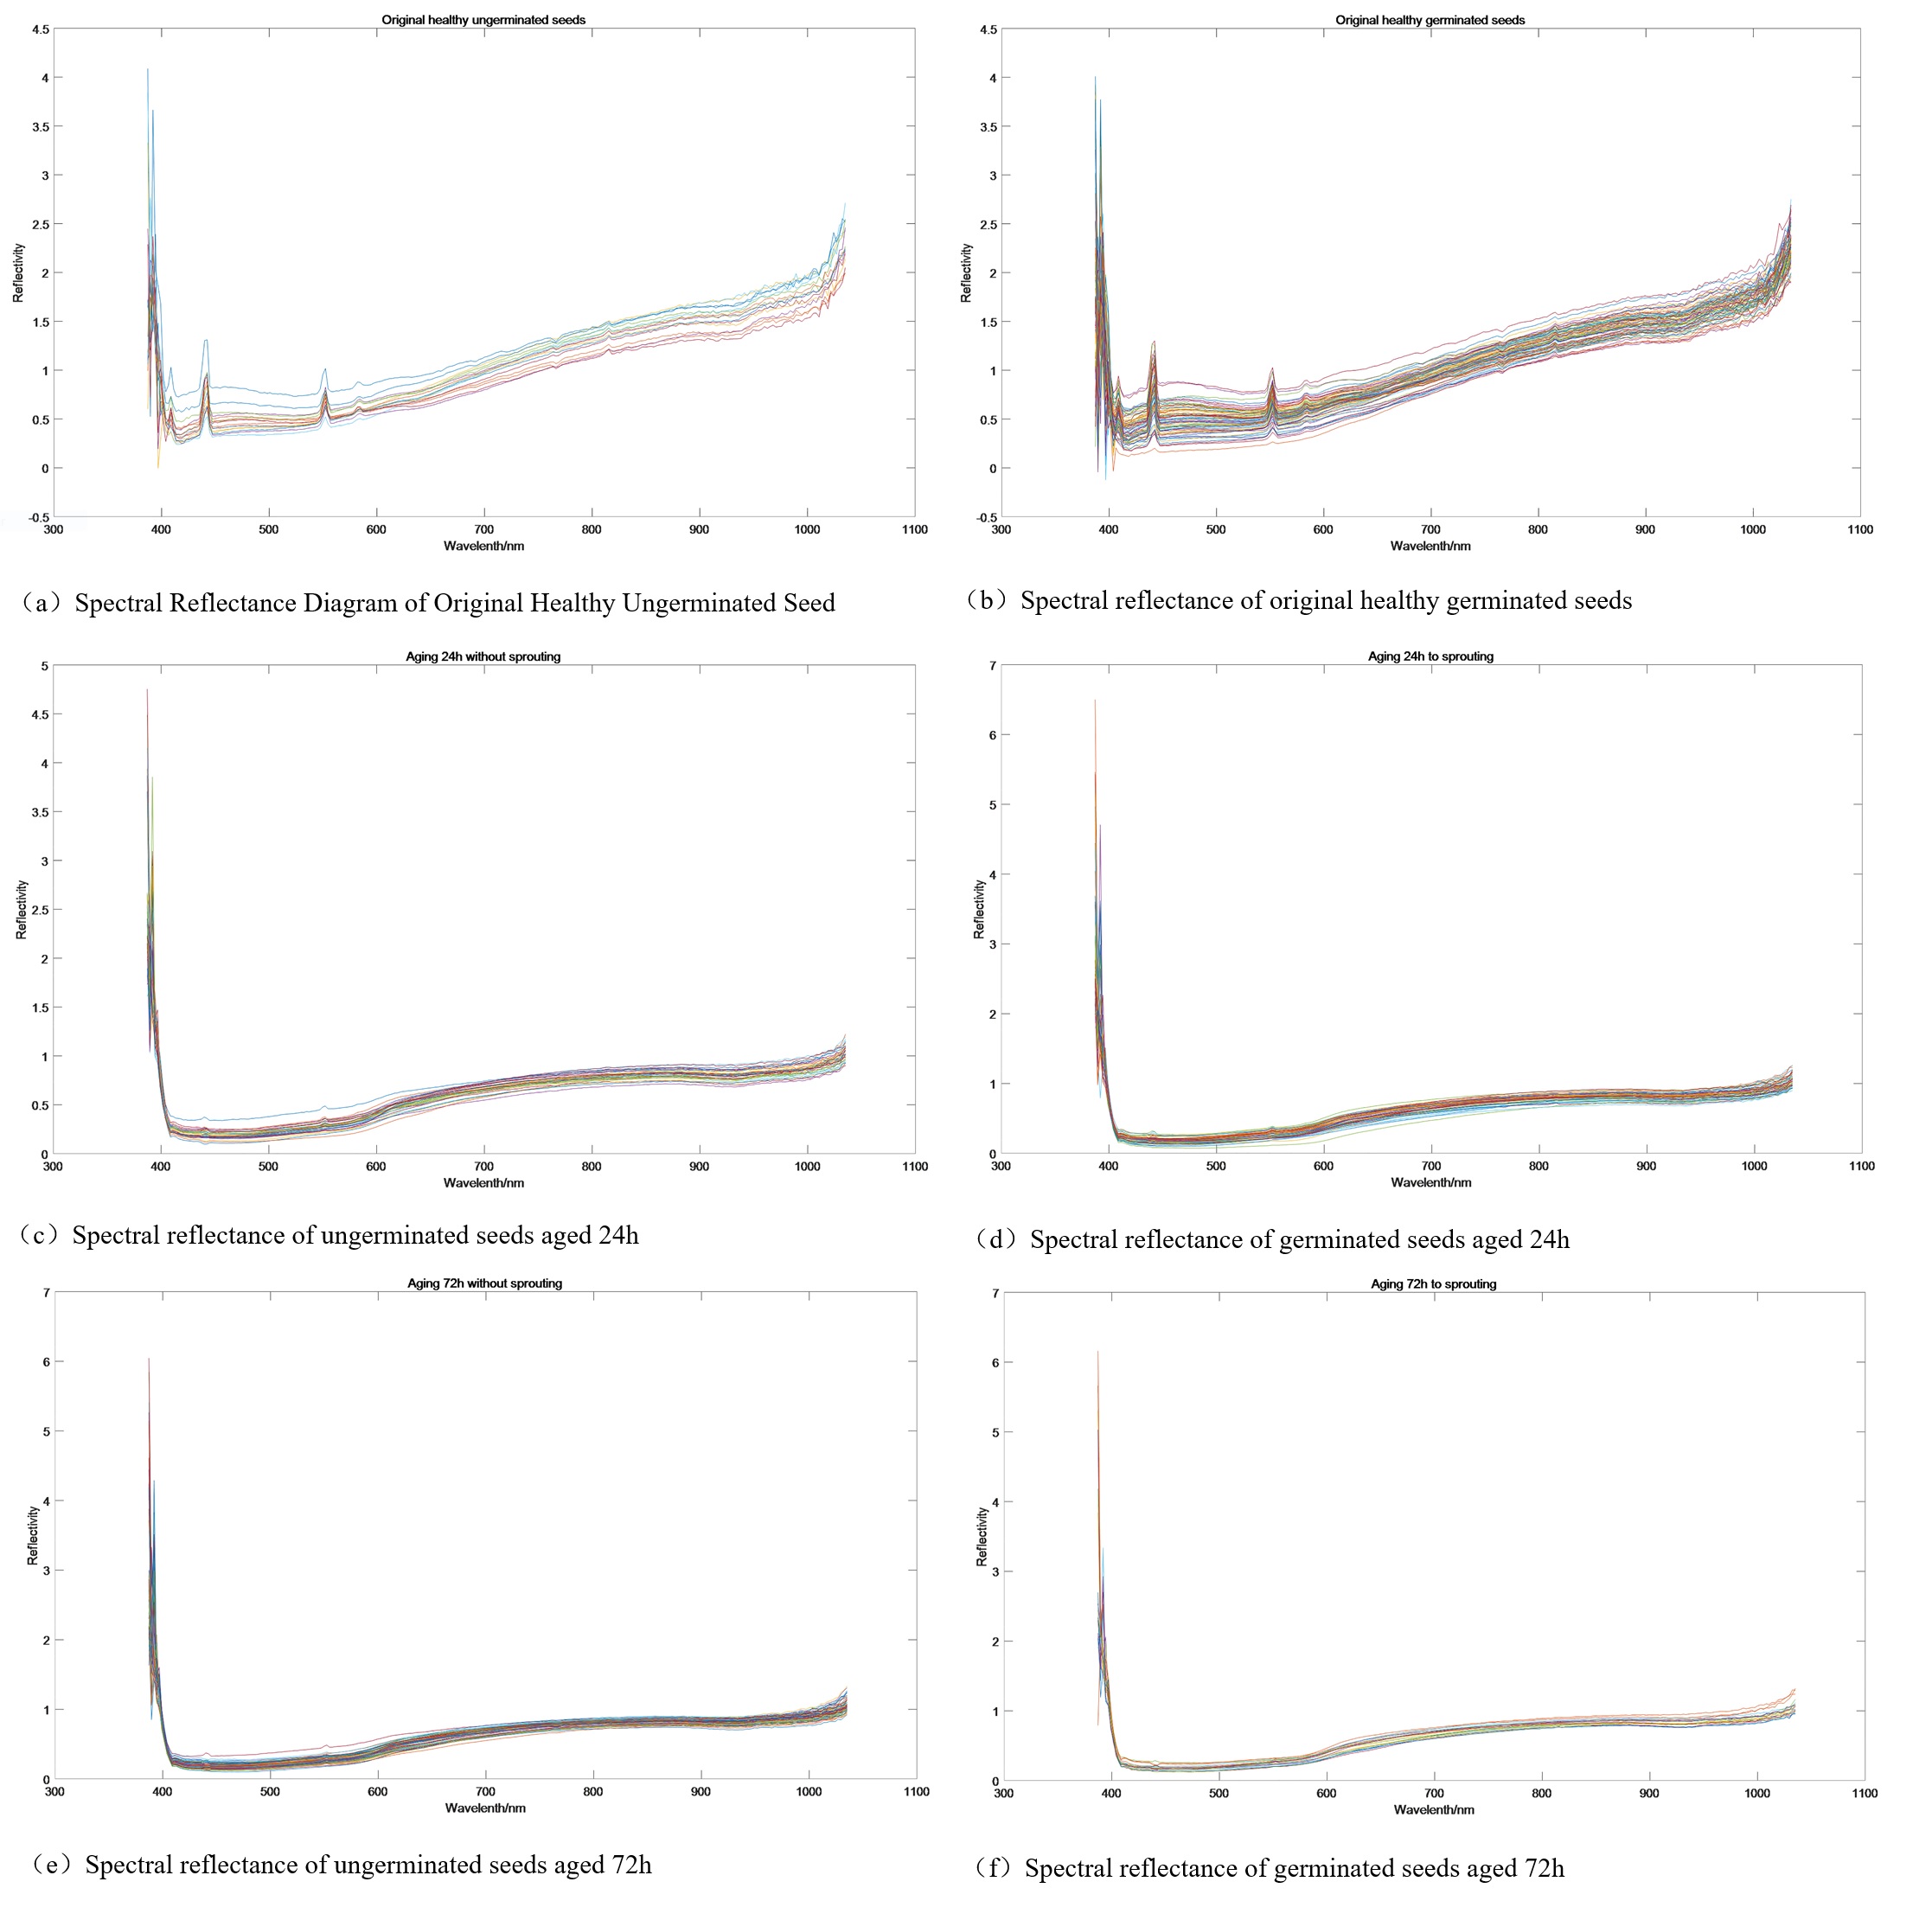
Six categories (healthy ungerminated peanut seeds, healthy germinated peanut seeds, aging treatment 24h ungerminated peanut seeds, aging treatment 24h germinated peanut seeds, aging treatment 72h ungerminated peanut seeds, aging treatment 72h germinated peanut seeds) Huayu No. 20 peanut seeds The wavelength-reflectance spectrum curve of the sample is shown in Figure 4. From the overall situation of the spectra of the 6 types of peanut seed samples, it can be seen that aging will make the spectral reflectance of different bands more dense, and with the increase of aging time, the germination rate of peanut seeds will also be greatly reduced. The healthy sample has obvious peaks at 450 nm and 550 nm compared to the peanut seed sample after the aging treatment, and the reflectivity is almost greater than 1 after 800 nm, while the peaks at 450 nm and 550 nm of the peanut seed after the aging treatment almost disappear and reflect after 800 nm. The rates are almost all less than 1. The image after aging for 24h shows that there is a small peak at 550 nm, and the image after aging for 24h shows that there is no peak at 550 nm. There is little difference in the spectral image of the seeds of the peanuts that are germinated and non-germinated after using the same treatment, but the local characteristics of the spectral reflectance curves of the healthy samples, the 24h aging treatment and the 72h aging treatment sample are different, and the different types of sprouting The spectral reflectance trends of peanut seeds and ungerminated peanut seeds are basically the same. Therefore, these spectral curves provide an effective criterion for identifying the vigor of peanut seeds and whether they are aging, and the image can be used to determine the germination trend of peanut seeds, predict whether peanut seeds will germinate in advance, and reduce subsequent cultivation costs.

6.2 Modeling analysis based on pre-processing full band
L2 Norm Normalization (L2NN), logarithmic transformation normalization (LTN), Gaussian window smoothing (GWS), and multiplicative scatter correction (MSC) are used respectively., Median filtering (MF) processes the original spectrum, and established a random gradient boosting (Xgboost) model, a gradient boosting category (Catboost) model, a random forest (Randomforest) model, and a support vector machine (SVC). Model, gradient boosting decision tree (gbdt) model, the results are shown in the Table 1. The results obtained by different models and based on different preprocessing strategies are different. Among them, the prediction accuracy obtained by Xgboost+MF is the highest, reaching 87.65%, and its log loss metric (Log_Loss) is the lowest 701.33, and its Hamming loss metric (Hamming_Loss)) Also reached the lowest value of 0.12, and the highest Jaccard_similarity coefficient (Jaccard_similarity) was 87.65%. Among them, the fitting time of SVC was the shortest. Under different preprocessing conditions, the fitting time was almost 0.05s.
6.3 Feature band extraction
The original spectral wavelength of the peanut seed sample contains 256 characteristic variables. Due to the problems of multiple bands, large amount of information, strong information correlation, and multiple information redundancy, logistic regression (LR), LightGBM, and XGBoost algorithms are used to extract the characteristic bands, and finally the top 15 contribution rates are selected Characteristic band . The 15 characteristic bands extracted by the LR algorithm are 1021.53 nm, 766.39 nm, 442.35 nm, 692.33 nm, 374.31 nm, 1032.29 nm, 389.54 nm, 552.2 nm, 797.34 nm, 401.49 nm, 1000.05 nm, 589.36 nm, 387.15 nm. The 15 characteristic bands extracted by LightGBM algorithm are 374.31 nm, 339.54 nm, 396.7 nm, 401.49 nm, 391.92 nm, 339.09 nm, 403.88 nm, 411.07 nm, 406.28 nm, 413.47 nm, 387.15 nm, 1016.15 nm, 500.63 nm, 408.67 nm, and 766.39 nm. The 15 characteristic bands extracted by the Xgboost algorithm are 841.47 nm, 857.13 nm, 1024.22 nm, 1016.15 nm, 904.38 nm, 922.86 nm, 838.87 nm, 507.96 nm, 1005.42 nm, 537.41 nm, 571.98 nm, 549.73 nm, 554.67 nm, 689.79 nm, and 576.94 nm. The LR algorithm uses 1021.53 nm as the main characteristic band, which is located near the spectral reflectance of lactose. LightGBM uses 374.31 nm, 339.54 nm, etc. as the main characteristic bands, which are located near the starch spectral reflectance. The Xgboost algorithm uses 841.47 nm, 857.13 nm, 1024.22 nm, etc. The main characteristic band is located near the spectral reflectance of arginine and tryptophan. Studies have shown that lactose, arginine, and tryptophan promote the germination of peanut seeds. Starch is converted into glucose and sucrose under the action of various hydrolytic enzymes. It is the raw material during seed germination. Arginine can promote root development during seed germination and growth, and is the precursor of plant endogenous hormone polyamine synthesis., Tryptophan is related to the survival ability of seeds after rehydration (Zhou et al., 2020Zhou, S., Sun, L., Xing, W., Feng, G., Ji, Y., Yang, J., & Liu, S. (2020). Hyperspectral imaging of beet seed germination prediction. Infrared Physics & Technology, 108, 103363. http://dx.doi.org/10.1016/j.infrared.2020.103363.
http://dx.doi.org/10.1016/j.infrared.202...
). Lactose has strong light reflectivity at 1021 nm, 1037 nm, etc., starch has strong light reflectivity at 455 nm, 465 nm, 495 nm, 505 nm, etc., arginine has strong light reflectivity at 983 nm, 989 nm, 994 nm, etc., and tryptophan at 1005 nm there is strong light reflectivity in other places. After extracting the spectral features, re-select the feature variables, and then use the classifier to optimize the space to obtain the classification results .The dimensionality reduction process of the characteristic band is shown in Figure 5. It can be seen that the three characteristic waveband screening strategies, and the final characteristic wavebands selected are all related to four substances: lactose, starch, arginine, and tryptophan. The extracted feature band weight diagram is shown in Figure 6. The test results show that the weights of feature variables extracted by different algorithms are different, and the first 15 feature bands of the weights selected by each algorithm will be used as the new input to re-classify and predict peanut seed activity. After extracting the characteristic wavelength, the classification prediction results are shown in Table 2. Among them, the confusion matrix of the Xgboost-LightGBM model and its normalized confusion matrix are shown in Figure 7.


7 Conclusion
Taking a single peanut seed as the experimental research object, the spectral characteristic data of each peanut seed was extracted through a hyperspectral system, and various preprocessing methods were used to establish multiple prediction models for the obtained data. At the same time, the peanut seed characteristic band was extracted to reduce redundant information and A band with a relatively small proportion of feature weights. The final results shown that different pretreatment methods, different feature band extraction methods and different model establishments had different prediction performances for peanut seed vigor. In L2NN, LTN, GWS, MSC, MF pretreatment methods; LR, LightGBM, The Xgboost algorithm extracted feature bands; among the Xgboost, Catboost, Randomforest, SVC, and gbdt classification models, the MF-LightGBM-RF model had the best performance, with a prediction accuracy of 92.59% and a fitting time of 1.77s, which simplified the model and improved efficiency. This study explored the effects of different pretreatment methods, models, and characteristic waveband extraction methods on the correct rate of identifying single peanut seed vigor, and provided theoretical support for the rapid, non-destructive and effective detection of peanut seed vigor.
Because different peanut varieties have different characteristic reactions after aging, their chemical composition will also be different before and after aging, and the interference to peanut seeds in the case of natural aging is not limited to external temperature and humidity factors, mold interference, the interference of external biological environmental factors is also an important factor affecting seed activity. Therefore, how to reduce and eliminate the interference of these external factors still requires a large amount of extensive data to support, and requires more detailed and in-depth research.
Acknowledgements
We are grateful to National Natural Science Foundation of China (31601227, 31501221) support plan level funding.
-
Practical Application: Prediction of peanut seed vigor by hyperspectral technology.
References
- Alcolea, A., & Resano, J. (2021). FPGA accelerator for gradient boosting decision trees. Electronics, 10(3), 314. http://dx.doi.org/10.3390/electronics10030314
» http://dx.doi.org/10.3390/electronics10030314 - Chen, B.-Y., Li, Q., Hu, H., Meng, S., Shah, F., Wang, Q., & Liu, H. (2020a). An optimized industry processing technology of peanut tofu and the novel prediction model for suitable peanut varieties. Journal of Integrative Agriculture, 19(9), 2340-2351. http://dx.doi.org/10.1016/S2095-3119(20)63249-X
» http://dx.doi.org/10.1016/S2095-3119(20)63249-X - Chen, T., Yang, W., Zhang, H., Zhu, B., Zeng, R., Wang, X., Wang, S., Wang, L., Qi, H., Lan, Y., & Zhang, L. (2020b). Early detection of bacterial wilt in peanut plants through leaf-level hyperspectral and unmanned aerial vehicle data. Computers and Electronics in Agriculture, 177, 105708. http://dx.doi.org/10.1016/j.compag.2020.105708
» http://dx.doi.org/10.1016/j.compag.2020.105708 - Chen, T., Zhang, J., Chen, Y., Wan, S., & Zhang, L. (2019). Detection of peanut leaf spots disease using canopy hyperspectral reflectance. Computers and Electronics in Agriculture, 156, 677-683. http://dx.doi.org/10.1016/j.compag.2018.12.036
» http://dx.doi.org/10.1016/j.compag.2018.12.036 - Chen, Y., Zhao, X., & Lin, Z. (2014). Optimizing subspace SVM ensemble for hyperspectral imagery classification. IEEE Journal of Selected Topics in Applied Earth Observations and Remote Sensing, 7(4), 1295-1305. http://dx.doi.org/10.1109/JSTARS.2014.2307356
» http://dx.doi.org/10.1109/JSTARS.2014.2307356 - Dana, W., & Ivo, W. (2008). Computer image analysis of seed shape and seed color for flax cultivar description. Computers and Electronics in Agriculture, 61(2), 126-135. http://dx.doi.org/10.1016/j.compag.2007.10.001
» http://dx.doi.org/10.1016/j.compag.2007.10.001 - Fan, Y., Ma, S., & Wu, T. (2020). Individual wheat kernels vigor assessment based on NIR spectroscopy coupled with machine learning methodologies. Infrared Physics & Technology, 105, 103213. http://dx.doi.org/10.1016/j.infrared.2020.103213
» http://dx.doi.org/10.1016/j.infrared.2020.103213 - Goudoum, A., Tinkeu, L. S. N., Madou, C., Djakissam, W., & Mbofung, C. M. (2016). Variation of some chemical and functional properties of Bambara groundnut (Voandzeia Subterranean L. Thouars) during sort time storage. Food Science and Technology, 36(2), 290-295. http://dx.doi.org/10.1590/1678-457X.0065
» http://dx.doi.org/10.1590/1678-457X.0065 - He, W., He, H., Wang, F., Wang, S., Li, R., Chang, J., & Li, C. (2021a). Rapid and uninvasive characterization of bananas by hyperspectral imaging with extreme gradient boosting (XGBoost). Analytical Letters, 55(4), 620-633. http://dx.doi.org/10.1080/00032719.2021.1952214
» http://dx.doi.org/10.1080/00032719.2021.1952214 - He, X., Yan, C., Jiang, X., Shen, F., You, J., & Fang, Y. (2021b). Classification of aflatoxin B-1 naturally contaminated peanut using visible and near-infrared hyperspectral imaging by integrating spectral and texture features. Infrared Physics & Technology, 114, 103652. http://dx.doi.org/10.1016/j.infrared.2021.103652
» http://dx.doi.org/10.1016/j.infrared.2021.103652 - Jain, N. K., Jat, R. A., Yadav, R. S., & Meena, H. N. (2021). Conservation agriculture practices improves productivity and sustainability of peanut (Arachis hypogaea)-based cropping systems. Indian Journal of Agricultural Sciences, 91(1), 164-169.
- Kandpal, L. M., Lohumi, S., Kim, M. S., Kang, J.-S., & Cho, B.-K. (2016). Near-infrared hyperspectral imaging system coupled with multivariate methods to predict viability and vigor in muskmelon seeds. Sensors and Actuators. B, Chemical, 229, 534-544. http://dx.doi.org/10.1016/j.snb.2016.02.015
» http://dx.doi.org/10.1016/j.snb.2016.02.015 - Kou, X., Zhao, Y., Xu, L., Kang, Z., Wang, Y., Zou, Z., Huang, P., Wang, Q., Su, G., Yang, Y., & Sun, Y. (2022). Controlled fabrication of core–shell γ-Fe2O3@C–Reduced graphene oxide composites with tunable interfacial structure for highly efficient microwave absorption. Journal of Colloid and Interface Science, 615, 685-696. http://dx.doi.org/10.1016/j.jcis.2022.02.023 PMid:35168017.
» http://dx.doi.org/10.1016/j.jcis.2022.02.023 - Laborde, A., Puig-Castellvi, F., Bouveresse, D. J.-R., Eveleigh, L., Cordella, C., & Jaillais, B. (2021). Detection of chocolate powder adulteration with peanut using near-infrared hyperspectral imaging and Multivariate Curve Resolution. Food Control, 119, 107454. http://dx.doi.org/10.1016/j.foodcont.2020.107454
» http://dx.doi.org/10.1016/j.foodcont.2020.107454 - Li, B., Hou, B., Zhang, D., Zhou, Y., Zhao, M., Hong, R., & Huang, Y. (2016). Pears characteristics (soluble solids content and firmness prediction, varieties) testing methods based on visible-near infrared hyperspectral imaging. Optik, 127(5), 2624-2630. http://dx.doi.org/10.1016/j.ijleo.2015.11.193
» http://dx.doi.org/10.1016/j.ijleo.2015.11.193 - Liu, Z., Jiang, J., Qiao, X., Qi, X., Pan, Y., & Pan, X. (2020). Using convolution neural network and hyperspectral image to identify moldy peanut kernels. Lebensmittel-Wissenschaft + Technologie, 132, 109815. http://dx.doi.org/10.1016/j.lwt.2020.109815
» http://dx.doi.org/10.1016/j.lwt.2020.109815 - Menis Candela, F., Giordano, W. F., Quiroga, P. L., Escobar, F. M., Mañas, F., Roma, D. A., Larrauri, M., Comini, L. R., Soria, E. A., & Sabini, M. C. (2020). Evaluation of cellular safety and the chemical composition of the peanut (Arachis hypogaea L.) ethanolic extracts. Heliyon, 6(10), e05119. http://dx.doi.org/10.1016/j.heliyon.2020.e05119 PMid:33083604.
» http://dx.doi.org/10.1016/j.heliyon.2020.e05119 - Pang, L., Wang, J., Men, S., Yan, L., & Xiao, J. (2021). Hyperspectral imaging coupled with multivariate methods for seed vitality estimation and forecast for Quercus variabilis. Spectrochimica Acta. Part A: Molecular and Biomolecular Spectroscopy, 245, 118888. http://dx.doi.org/10.1016/j.saa.2020.118888 PMid:32947159.
» http://dx.doi.org/10.1016/j.saa.2020.118888 - Sadighara, P., & Ghanati, K. (2021). The aflatoxin B1 content of peanut-based foods in Iran: a systematic review. Reviews on Environmental Health, 37(1), 29-33. http://dx.doi.org/10.1515/reveh-2021-0065 PMid:34332516.
» http://dx.doi.org/10.1515/reveh-2021-0065 - Salas, E. A. L., & Subburayalu, S. K. (2019). Modified shape index for object-based random forest image classification of agricultural systemiss using airborne hyperspectral datasets. PLoS One, 14(9). http://dx.doi.org/10.1371/journal.pone.0222474 PMid:31491035.
» http://dx.doi.org/10.1371/journal.pone.0222474 - Samat, A., Li, E., Du, P., Liu, S., Miao, Z., & Zhang, W. (2022). CatBoost for RS image classification with pseudo label support from neighbor patches-based clustering. IEEE Geoscience and Remote Sensing Letters, 19, 1-5. http://dx.doi.org/10.1109/LGRS.2020.3038771
» http://dx.doi.org/10.1109/LGRS.2020.3038771 - Shori, A. B., & Al Zahrani, A. J. (2022). Non-dairy plant-based milk products as alternatives to conventional dairy products for delivering probiotics. Food Science and Technology, 42, e101321. http://dx.doi.org/10.1590/fst.101321
» http://dx.doi.org/10.1590/fst.101321 - Sun, J., Wang, G., Zhang, H., Xia, L., Zhao, W., Guo, Y., & Sun, X. (2020). Detection of fat content in peanut kernels based on chemometrics and hyperspectral imaging technology. Infrared Physics & Technology, 105, 103226. http://dx.doi.org/10.1016/j.infrared.2020.103226
» http://dx.doi.org/10.1016/j.infrared.2020.103226 - Tan, W., Sun, L., Yang, F., Che, W., Ye, D., Zhang, D., & Zou, B. (2018). Study on bruising degree classification of apples using hyperspectral imaging and GS-SVM. Optik, 154, 581-592. http://dx.doi.org/10.1016/j.ijleo.2017.10.090
» http://dx.doi.org/10.1016/j.ijleo.2017.10.090 - Wang, J., Shi, L., Liu, Y., Zhao, M., Wang, X., Qiao, L., Sui, J., Li, G., Zhu, H., & Yu, S. (2020). Development of peanut varieties with high oil content by in vitro mutagenesis and screening. Journal of Integrative Agriculture, 19(12), 2974-2982. http://dx.doi.org/10.1016/S2095-3119(20)63182-3
» http://dx.doi.org/10.1016/S2095-3119(20)63182-3 - Wang, X. W., Xing, X. Y., Zhao, M. C., & Yang, J. R. (2021a). Comparison of multispectral modeling of physiochemical attributes of greengage: Brix and pH values. Food Science and Technology, 41(Suppl. 2), 611-618. http://dx.doi.org/10.1590/fst.21320
» http://dx.doi.org/10.1590/fst.21320 - Wang, Z., Tian, X., Fan, S., Zhang, C., & Li, J. (2021b). Maturity determination of single maize seed by using near-infrared hyperspectral imaging coupled with comparative analysis of multiple classification models. Infrared Physics & Technology, 112, 103596. http://dx.doi.org/10.1016/j.infrared.2020.103596
» http://dx.doi.org/10.1016/j.infrared.2020.103596 - Wang, Y., & Cheng, J. (2018). Rapid and non-destructive prediction of protein content in peanut varieties using near-infrared hyperspectral imaging method. Grain & Oil Science and Technology, 1(01), 40-43. http://dx.doi.org/10.3724/SP.J.1447.GOST.2018.18025
» http://dx.doi.org/10.3724/SP.J.1447.GOST.2018.18025 - Yulianti, L. E., Setiaboma, W., Hakim, A. N., Widowati, E., Afifah, N., & Ekafitri, R. (2022). The effect of beans types and soaking time on the characteristics of Indonesian traditional food “Instant Bose”. Food Science and Technology, 42, e19621. http://dx.doi.org/10.1590/fst.19621
» http://dx.doi.org/10.1590/fst.19621 - Zhang, C.-X., Xi, J., Wang, S.-T., Ma, Y.-X., & Wang, X.-D. (2022). Effects of deep fat frying conditions on the formation of heterocyclic aromatic amines in chicken meat. Food Science and Technology, 42, e67321. http://dx.doi.org/10.1590/fst.67321
» http://dx.doi.org/10.1590/fst.67321 - Zhang, J., Geng, Y., Guo, F., Li, X., & Wan, S. (2020). Research progress on the mechanism of improving peanut yield by single-seed precision sowing. Journal of Integrative Agriculture, 19(8), 1919-1927. http://dx.doi.org/10.1016/S2095-3119(19)62763-2
» http://dx.doi.org/10.1016/S2095-3119(19)62763-2 - Zhang, L., Sun, H., Rao, Z., & Ji, H. (2020a). Hyperspectral imaging technology combined with deep forest model to identify frost-damaged rice seeds. Spectrochimica Acta. Part A: Molecular and Biomolecular Spectroscopy, 229, 117973. http://dx.doi.org/10.1016/j.saa.2019.117973 PMid:31887678.
» http://dx.doi.org/10.1016/j.saa.2019.117973 - Zhang, T., Fan, S., Xiang, Y., Zhang, S., Wang, J., & Sun, Q. (2020b). Non-destructive analysis of germination percentage, germination energy and simple vigour index on wheat seeds during storage by Vis/NIR and SWIR hyperspectral imaging. Spectrochimica Acta. Part A: Molecular and Biomolecular Spectroscopy, 239, 118488. http://dx.doi.org/10.1016/j.saa.2020.118488 PMid:32470809.
» http://dx.doi.org/10.1016/j.saa.2020.118488 - Zhao, Y., Zhang, H., Yang, X., Huang, H., Zhao, G., Cong, T., Zuo, X., fan, Z., Yang, S., & Pan, L. (2021a). In situ construction of hierarchical core-shell Fe3O4@C nanoparticles-helical carbon nanocoil hybrid composites for highly efficient electromagnetic wave absorption. Carbon, 171, 395-408. http://dx.doi.org/10.1016/j.carbon.2020.09.036
» http://dx.doi.org/10.1016/j.carbon.2020.09.036 - Zhao, Y., Zuo, X., Guo, Y., Huang, H., Zhang, H., Wang, T., Wen, N., Chen, H., Cong, T., Muhammad, J., Yang, X., Wang, X., Fan, Z., & Pan, L. (2021b). Structural engineering of hierarchical aerogels comprised of multi-dimensional gradient carbon nanoarchitectures for highly efficient microwave absorption. Nano-Micro Letters, 13(1), 144. http://dx.doi.org/10.1007/s40820-021-00667-7 PMid:34138390.
» http://dx.doi.org/10.1007/s40820-021-00667-7 - Zhou, S., Sun, L., Xing, W., Feng, G., Ji, Y., Yang, J., & Liu, S. (2020). Hyperspectral imaging of beet seed germination prediction. Infrared Physics & Technology, 108, 103363. http://dx.doi.org/10.1016/j.infrared.2020.103363
» http://dx.doi.org/10.1016/j.infrared.2020.103363 - Zou, S., Tseng, Y.-C., Zare, A., Rowland, D. L., Tillman, B. L., & Yoon, S.-C. (2019). Peanut maturity classification using hyperspectral imagery. Biosystems Engineering, 188, 165-177. http://dx.doi.org/10.1016/j.biosystemseng.2019.10.019
» http://dx.doi.org/10.1016/j.biosystemseng.2019.10.019
Publication Dates
-
Publication in this collection
03 June 2022 -
Date of issue
2022
History
-
Received
20 Mar 2022 -
Accepted
02 May 2022