Abstract
The database of real world contains a huge volume of data and among them there are hidden piles of interesting relations that are actually very hard to find out. The knowledge discovery in databases (KDD) appears as a possible solution to find out such relations aiming at converting information into knowledge. However, not all data presented in the bases are useful to a KDD. Usually, data are processed before being presented to a KDD aiming at reducing the amount of data and also at selecting more relevant data to be used by the system. This work consists in the use of Rough Sets Theory, in order to pre-processing data to be presented to Self-Organizing Map neural network (Hybrid Architecture) for clusters analysis. Experiments' results evidence the better performance using the Hybrid Architecture than Self-Organizing Map. The paper also presents all phases of the KDD process.
clusters analysis; rough sets theory; self-organizing map
An hybrid architecture for clusters analysis: rough setstheory and self-organizing map artificial neural network
Renato José Sassi
Mestrado em Engenharia de Produção, Universidade Nove de Julho, São Paulo, SP, Brasil. E-mail: sassi@uninove.br
ABSTRACT
The database of real world contains a huge volume of data and among them there are hidden piles of interesting relations that are actually very hard to find out. The knowledge discovery in databases (KDD) appears as a possible solution to find out such relations aiming at converting information into knowledge. However, not all data presented in the bases are useful to a KDD. Usually, data are processed before being presented to a KDD aiming at reducing the amount of data and also at selecting more relevant data to be used by the system. This work consists in the use of Rough Sets Theory, in order to pre-processing data to be presented to Self-Organizing Map neural network (Hybrid Architecture) for clusters analysis. Experiments' results evidence the better performance using the Hybrid Architecture than Self-Organizing Map. The paper also presents all phases of the KDD process.
Keywords: clusters analysis, rough sets theory, self-organizing map.
1 INTRODUCTION
Real world databases contain a large volume of data that hide several interesting relationships that are difficult to discover. These data are generated and stored on a large scale, which hinders specialized analysis by traditional methods such as spreadsheets of calculations and operations in reports (Piatetsky-Shapiro, 1989). Therefore, it becomes necessary to use systems of Knowledge Discovery in Databases (KDD) to extract knowledge from databases, making data analysis possible.
However, not all the data that compose the database are suitable to system for discovering knowledge (Berry & Linoff, 1997). Thus, in general the data are reduced (pre-processed) before being submitted to KDD. This reduction has to retain the original data representation, producing the same (or about the same) analytical results. For this purpose, this work proposes to use reductions from Rough Sets Theory (RS) (Pawlak, 1982). After this reduction, the data are processed by a Self-Organizing Map (SOM) neural network (Kohonen, 1997) that provides a topologically ordered map of data that facilitates analysis of the results by specialists. Thus, this work proposes a hybrid model (RS+SOM) as a tool for knowledge discovery in databases.
The main reason for combining different techniques in hybrid systems is that a single technique is often not appropriate for every domain, dataset, or stage of a system's lifecycle (Banerjee,Mitra & Pal, 1998; Mitra, Pal & Mitra, 2002). Another reason is that a hybrid system has an advantage over an approach using a single method because the technologies complement each other's shortcomings (Lingras & Butz, 2010; Indira & Ramesh, 2011). For example, the drawback of neural network techniques is that they do not provide explicit description of the patterns discovered.
RS has the advantage of being able to learn decision models from imprecise data as well as to represent them in a way understandable to human users. Integration of RS with neural networks facilitates the inclusion of structured knowledge in the system and enhances its explanatory capability (Jagielska, 1998; Lingras, 1996).
The work is organized as follows: Section 2 introduces the fundamental concepts of Knowledge Discovery in Databases. Section 3 discusses Rough Sets Theory and Section 4 introduces the fundamental concepts of Self-Organizing Map. The methodology, experiments and results are presented in Sections 5 and 6. Finally, Section 7 concludes the work. The results indicate that the Hybrid Architecture proposed is a potential tool for knowledge extraction to aid decision making.
2 KNOWLEDGE DISCOVERY IN DATABASES (KDD)
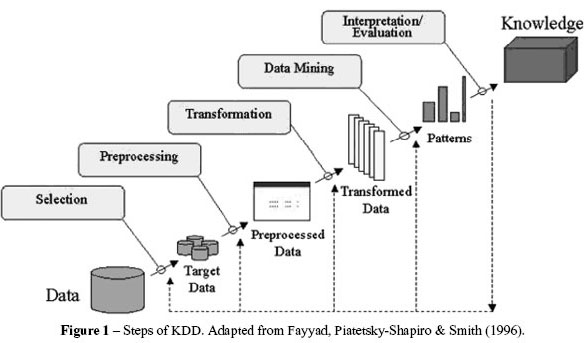
Knowledge Discovery in Databases (KDD) can be defined as utilizing a process of knowledge extraction that produces valid, novel, potentially useful and understandable data to aid specialists in decision-making (Fayyad, Piatetsky-Shapiro & Smith, 1996). KDD performs its processes using methods from the following areas: mathematical statistics, pattern recognition, visualization, databases, machine learning, artificial intelligence and others. KDD are composed of steps (Fig. 1) and tasks that are described below.
KDD comprise several steps that cover a large number of decisions to be made by specialists, and so it is an interactive process. KDD also names an iterative process because, in a KDD process,a step can be repeated as many times as necessary to produce a satisfactory result (Fayyad,Piatetsky-Shapiro & Smith, 1996). In a KDD process, each step (Fig. 1) intersects with others.Thus, the results of one step are used to improve the results of the following steps.
Problem definition is essential to a KDD process; the definition of the kind of knowledge desired by specialists needs to be precise. Thus, the KDD are formed by the following steps: data selection, pre-processing, data transformation, data mining and interpretation/knowledge. Next,a quick introduction of these steps is presented.
The data selection step is the creation of target data or selected data for KDD. In this step, a set of data is selected while focusing on a subset of attributes (variables) enabling knowledge discovery.
The purpose of the pre-processing step is to ensure the quality of the selected data. Large databases are highly susceptible to outliers, missing data and inconsistent information. Clean and understandable data are a requirement for good results in the data mining step (Pyle, 1999).
Data transformation or data codification aims to change raw data into a usual or normalized form. Data transformation is potentially a task that requires great ability in KDD processes. In general, this step demands a specialist's experience in and knowledge about the data.
Data reduction is considered a technical pre-processing of data, and its study has the greatest importance in this work because hybrid architecture combines the RS as a technique for reducing attributes and artificial neural networks. Reducing the amount of data can reduce the time to learn the mining algorithm, when finding a solution requires a long time, and to make the interpretation of concepts learned easier.
Data mining (Fig. 1) is the main step of the KDD process and is characterized by the existence of a miner algorithm that, when met by a specific task, becomes able to efficiently extract implicit and useful knowledge from a database. Data mining generates new knowledge hidden in a large volume of data.
The interpretation/knowledge step helps us to understand knowledge discovery by the miner algorithm, which is validated by a qualitative measure of the solution and through the perception of a data specialist. This knowledge is consolidated in demonstrative reports with a documented explanation of the relevant information discovered in each step of the KDD process. A generic form to obtain the comprehension and interpretation of data is to use visualization techniques (Bigus, 1996).
2.1 KDD tasks
The main KDD tasks are (Fayyad, Piatetsky-Shapiro & Smith, 1996): clustering, classification and association. Clustering transforms records with a large number of attributes into relatively small segments. This transformation occurs automatically through the identification of characteristics that distinguish a set of data and its post-partitioning. It is not necessary to identify the groups or the desired attributes that should be used for the production of segments. The purpose of this task is to maximize intra-cluster similarity and to minimize inter-cluster similarity (Johnson & Wichern, 1998).
The results of a clustering operation can be used in two different ways: either to produce a summary of the database by means of describing the characteristics of each cluster, or as input data for other techniques, such as classification.
Clustering can be used in cases that make use of target population models (identifying homogeneous groups of elements, within a same maximally similar group), such as demographically targeting consumer markets, involving possible comparison of usage patterns of multiple segments of the population in an effort to determine sales campaigns.
View tools are not properly data mining tasks, but are means to observe and analyze the data of a particular database (Berry & Linoff, 2000; Han & Kamber, 2001). In the case of technical clustering, these tools can be used to determine a view if the data or to set up clusters that are useful or interesting for data mining methods. In the specific case of SOM networks, display forms are more often used for Matrix-U and mapping by color similarity.
The view tools can also be used as a mechanism for understanding the extracted information through data mining techniques. Features difficult to detect by simple observation of rows and columns of figures can become obvious when graphically seen.
Through these tools, characteristics or unusual or interesting phenomena can be found even if they are not being sought for.
3 ROUGH SETS THEORY (RS)
Rough Sets Theory (RS) was proposed by Zdzislaw Pawlak in 1982 as a mathematical model to represent knowledge and to treat uncertainty.
The most common form for the representation of data in RS is via an Information System (S) that contains an element set, with each element having a number of conditional attributes. These attributes are the same for each of the elements, but their nominal values may differ (Table 1).
Thus, an Information System is an ordered pair S = (U, C), where U is a finite, nonempty element set called universal, and C is a finite, nonempty set formed by the attributes. Each attribute a ∈ C is a function a : U → Va, where Va is the set of allowed values for the attribute a (itsrange of values).
In the Information System S shown in the Table 1, the main concepts of RS can be observed, as follows: the approximate space A = (U, R); the universal U formed by the elements e1, e2, e3,e4, e5, e6; the attributes (C), Vendor Experience, Product Quality and Good Location; and R, the equivalence relation on U.
RS is a fundamental type of uncertainty, indiscernibility. Indiscernibility arises when it is not possible to distinguish elements from the same set.
The main concept involved in RS is the Indiscernibility Relation, which is associated with a set of attributes. If such a relationship exists between two elements, then all of the nominal values of their attributes are identical with respect to the attributes considered; therefore, they cannot be discerned (distinguished) from each other (Pawlak, 1982).
For each subset of attributes B ⊆ C in the Information System S = (U, C), there is an associated equivalence relation INDs(B), called the Indiscernibility Relation, which is defined as follows: INDs(B) = {(x, y) ∈ U2 /  a ∈ B, a(x) = a(y)}.
The set of all equivalence classes in the relationship INDs(B) is represented by U/INDs(B), which is called the quotient of U by the relation INDs(B).
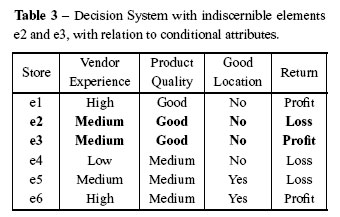
In many cases, it is important to classify elements according to a decision attribute that informs the decision to be taken. Thus, an Information System S that features a decision attribute is called a Decision System (DS).
A DS can be represented by DS = (U, C ∪{d}), where d ∈/C is the decision attribute. The Table 2 shows a DS obtained from the Information System S of the Table 1, highlighting the conditional attributes (Vendor Experience, Product Quality and Good Location) and decision attribute (Return).
Attribute values are called nominal values and are expressed as Vendor Experience {High, Medium, Low}, Product Quality {Good, Medium}, Good Location {No, Yes}, and Return {Profit,Loss}. Considering each conditional attribute independently, the equivalence relation of the Information System S (Table 1) forms the following element sets: experience of the vendor (High {e1, e6}, Medium {e2, e3, e5}, Low {e4}), Product Quality (Good {e1, e2, e3}, Medium {e4, e5, e6}), and Good Location (No {e1, e2, e3, e4}, Yes {e5, e6}).
By using all of the conditional attributes of the Information System S in the Table 1, the following element sets are obtained: {e1}, {e2, e3}, {e4}, {e5}, and {e6}. It can be seen from the Table 3 that there are two equal elements (cases), {e2} and {e3} (highlighted in bold), with regard to values of conditional attributes.
Given the Indiscernability Relation between the elements {e2} and {e3} as shown in the Table 3,it holds that all of the nominal values of their attributes are identical in relation to the considered subset of attributes B(B ⊆ S). Therefore, they cannot be differentiated from each other.
An important concept in RS is the Reduct concept (Pawlak et al., 1995). The reduction of attributes in RS is performed through so-called Reducts (RED), which are subsets of attributes capable of representing the knowledge of the database with all of its initial attributes.
A Reduct of B on an Information System S is a set of B'⊆ B attributes in which all of the attributes a ∈ (B − B') are dispensable. Thus, U/INDs(B') = U/INDs(B). The term RED(B) is used to denote the family of reducts of B.
The procedure for the reduction of attributes is as follows: the element sets of each attribute are individually compared and then compared two by two, three by three, and so on, with the element sets formed with all attributes {e1}, {e2, e3}, {e4}, {e5}, and {e6}. In this comparison, when the element sets of a specific attribute are equal to the element sets formed with all of the attributes,this attribute can be reduced.
The calculation of reductions to generate the reducts is an n-p complete problem, and processing it in large databases requires great computational effort.
Thus, by comparing each individual attribute (the element sets are formed by the nominal values of the decision attribute), we obtain the following: Vendor Experience: Profit {e1, e3, e6}, Loss {e2, e4, e5}; Product Quality: Profit {e1, e3, e6}, Loss {e2, e4, e5}; Good Location: Profit {e1,e3, e6}, Loss {e2, e4, e5}. No attribute had element sets equal to the element sets formed with all of the attributes; thus, there was no reduction on this occasion.
Comparing the attributes Vendor Experience and Product Quality when they are High and Good {e1}; Medium and Good {e2, e3}; Low and Medium {e4}; Medium and Medium {e5}; High and Medium {e6}, respectively, the result was as follows: {e1}, {e2, e3}, {e4}, {e5}, {e6}.
The element sets obtained are equal to the element sets obtained with all of the attributes; thus,it is possible to reduce an attribute.
Comparing the attributes Vendor Experience and Good Location when they are High and No {e1}; Medium and No {e2, e3}; Low and No {e4}; Medium and Yes {e5}; High and Yes {e6},respectively, the result of the element sets was as follows: {e1}, {e2, e3}, {e4}, {e5}, {e6}.
The element sets obtained are equal to the element sets obtained with all of the attributes; thus, another attribute may be reduced. Compared the attributes Product Quality and Good Location when they are Good and No {e1, e2, e3}; Medium and No {e4}; and Medium and Yes {e5, e6},respectively.
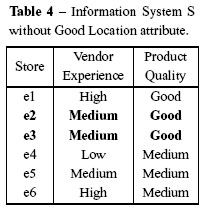
The result of the element sets was as follows: {e1, e2, e3}, {e4}, and {e5, e6}, showing that the element sets obtained are different from the element sets obtained with all of the attributes, and therefore, there can be no further reduction. The conclusion is that there are two RED(B) reducts: {Vendor Experience, Product Quality} and {Vendor Experience, Good Location}, i.e., using either reduct, the database can be represented with all of its original attributes. The Information System S without the presence of the reduced attribute Good Location can be seen in the Table 4.
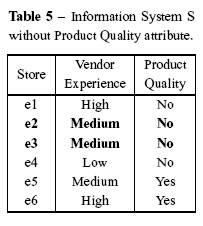
The Information System S without the presence of the reduced attribute Product Quality can be seen in the Table 5.
3.1 Discernibility Matrix
The procedure for the reduction of attributes has been demonstrated. This reduction is performed by the discernibility function from the Discernibility Matrix. Considering the attribute set B = {Vendor Experience, Product Quality and Good Location} for the information system S, the set of all equivalence classes determined by B on S is given by U/INDs(B) ={{e1}; {e2, e3}; {e4}; {e5}; {e6}}, as shown in the Table 3.
The Discernibility Matrix of Information System S is denoted by DM(B), which is a symmetric matrix n × n with: mD(i, j) ={a ∈ B|a(Ei) ≠ a(Ej)} for i, j = 1, 2,..., n. with 1 ≤ i, j ≤ nand n =|U/INDs(B). Thus, the Discernibility Matrix mD(i, j) elements are a set of conditional attributes of B that differentiate the elements of classes in relation to their nominal values.
The representation of Vendor Experience (VE), Product Quality (PQ) and Good Location (GL),to build the Discernibility Matrix MD(B) is shown in Table 6:
The Fs(B) discernibility function is a Boolean function with m variables, which determines the minimum set of attributes necessary to differentiate any equivalence class from the others, defined as:


Using the method for the simplification of Boolean expressions in the function Fs(B), the set of all prime implicants of this function is obtained, which determines the reducts of S. Simplification is a process of algebraic manipulation of logic functions to reduce the number of variables and operations necessary for its realization.
With the simplification methods of Boolean functions in the Fs(B) function, the reducts of S are generated. This simplification is an algebraic handling of the logics functions and aims to reduce the number of attributes and needs operations.
The discernibility function Fs(B) is obtained as follows: for all attributes standing in each element of the Discernibility Matrix MD(B), the sum operator is applied, "or" or "∨" and, among the cells of this matrix the "product" element, "and" or "∧", is used, which results in a Boolean expression of "sum of products". The discernibility function Fs(B) of the Table 6 is presented below:
Fs(B) = (VE) ∧ (VE) ∧ (VE ∨ PQ) ∧ (VE ∨ PQ) ∧ (VE ∨ PQ) ∧ (VE ∨ PQ ∨ GL) ∧(PQ ∨ GL) ∧ (PQ ∨ GL) ∧ (VE ∨ GL) ∧ (PQ ∨ GL) ∧ (VE ∨ PQ ∨ GL) ∧(VE ∨ PQ ∨ GL) ∧ (VE ∨ GL) ∧ (VE).
Simplifying this expression, using theorems, properties, and postulates of Boolean Algebra, the following minimized expression is obtained:
Fs(B) = (VE ∧ (PQ ∨ GL) ∧ (VE ∨ PQ ∨ GL)), which can also be expressed as "Sum of Product", i.e., Fs(B) = (VE ∧ (PQ ∨ GL)). Thus, the reducts are Reducts: (VE ∧ PQ); (VE ∧GL), RED(B) ={Vendor Experience, Product Quality} and {Vendor Experience, Good Location}.
The discernibility function determined the minimum term of the function, i.e., the minimum set of attributes required to discern the classes consisting of all equivalence classes of the relation INDs(B).
In KDD steps, RS can be applied in database pre-processing due to the importance of attributes selection. Additional characteristics of the RS can be found at Sant'Anna (2008) and Couto &Gomes (2010).
4 SELF-ORGANIZING MAP (SOM)
A Self-Organizing Map (SOM) consists of M neurons located on a regular low-dimensional grid, usually in two dimensions (2-D) (Fig. 2). The lattice of the 2-D grid is either hexagonal or rectangular. Assume that each input vector from the set of feature vectors ξ j is defined as a real vector x(n) ={ξ 1,ξ 2,...,ξ d}T ∈ Rd. The SOM algorithm is iterative. Each neuron (or unit, as they are called in next section) i has a d dimensional weight vector or model (preferred here), called wu =[wu1,...,wud ]T ∈ Rd. Initially, at t = 0, the models are initialized randomly,preferably from the domain of the input vectors (Kiviluoto, 1996). At each training step t, a sample data vector x(n) is randomly chosen from a training set (N ).
The distances between x(n) and all models are computed. The winning neuron, denoted by c, is the neuron with the feature vector close to x(n) or the best match unit (BMU ).
The distances between x(n) and all models are computed. The winning neuron, denoted by c, is the neuron with the feature vector close to x(n) or the best match unit (BMU ).

A set of neighboring neurons of the winning neuron is denoted as Nc, which decreases the neighboring radius of the winning neuron with time hic(t) defined as the neighborhood kernel function around the winning neuron c at time t. The neighborhood kernel function is a non-increasing function of time t and of the distance of neuron i from the wining neuron c in 2-D output space. The kernel can be taken as a Gaussian function (2).

where rc is the coordinate of winning neuron, ri is the coordinate of neuron i on the output grid and σ(t) is the kernel width.
The weight-updating rule in the sequential SOM algorithm can be written as (3)

The learning rate α(t) and kernel width σ(t) decrease monotonically with time.
At the end of training, the weight vectors represent the database (as a quantization feature) and the final map can be used in data analysis. With the weight vectors, clusters are generated and data are visualized in two dimensions. Figure 3 exemplifies three different clusters.
Vesanto & Alhoniemi (2000) proposed using the K-means algorithm to cluster weight vectors.To define the K-value, a measure called the Davies-Boulding Index (DBI) is computed (Davies & Bouldin, 1979). Thus, in the initial process, K is defined as 2, to compute the inter and intra cluster measure. The best K is that with the lowest DBI. The final process is a map labeled with similar colors (Color Similarity Map). Another technique for using SOM in data analysis is to use a unified matrix (U-Matrix) (Ultsch, 1993). It computes the distance between neighboring neurons to generate a map of dissimilarity.
Figure 4 illustrates the full process of hybrid architecture. In the initial process, RS pre-processes the database, and input vectors with minimal attributes are generated. This reduct database is used to train the SOM. The K-means algorithm is applied to cluster the neurons of the map. In the KDD process, the SOM is a data mining task used to find patterns in the database as well as to show the knowledge discovered.
For the next experiments, the methodology described here is used to label the map and to thus define the potential cluster form database.
After knowledge is discovered in the KDD process, techniques are applied for the automatic generation of knowledge. In general, they use association rules or neural networks.
4.1 Measure of the SOM Performance
In general, the measures used to calculate the SOM performance are the well-known quantization error and the topographic error (Kiviluoto, 1996). The mean quantization error (mqe) measures the distance between each input vector x(n) and its relative model wu of best match unit (BMU) denominated c. The measure mqe is calculated as:

The final mean of quantization error MQE of the map is computed as the mean of all mqe (see Equation 4) of the subset of winning neurons of this map: units i onto which data are mapped

The second quality measure is the topographic error (TE), which quantifies map capacity by representing the feature vector set topology. For each x(n) we calculate its first BMU wc and the second BMU wd, and so the TE is calculated according to (6):

where u(x(n)) = 1 if wc and wd are not adjacent.
These two error measures are used to evaluate the hybrid architecture proposed in this work.
5 EXPERIMENTS
The purpose of the experiments is to compare, analyze and evaluate the results obtained by a SOM artificial neural network and by the proposed Hybrid Architecture, RS+SOM. For this, the following elements will be considered: SOM learning time, MQE, TE and the number of clusters derived from a marketing database. The problem definition (KDD step, see Fig. 1,Section 2) is to know the features of the customers represented in the database. Two experiments were carried out: the first using the Iris database and the second one using the Consumer Database.
5.1 Experimental Methodology
The experiments were conducted in two parts: in part one (Fig. 5), we introduce the database to SOM.
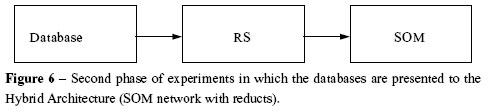
In part two of the experiment (Fig. 6), the database is submitted to RS pre-processing, and later to SOM.
In part two of experiment, it is evident that the KDD process is iterative and interactive (Fig. 1, Section 2), because even though the transformation step has been carried through, it was necessary to return to the last step, preprocessing, for the RS to reduct the database attributes before introducing it to SOM. Both parts of the experiments belong to the data mining step.
In order to conduct experiments with SOM architecture, the SOM Toolbox available from http://www.cis.hut.fi/projects/somtoolbox/documentation/start.shtml was used, this toolbox is an implementation of a Self-Organizing Map in Matlab and for RS experiments the Rosetta tool (Rough Sets Toolkit for Analysis of Data) was used, available from http://www.idi.ntnu.no/∼aleks/rosetta.
a) Experiment 1: with the Iris database
Iris is perhaps one of the most well-known databases found in the literature of pattern recognition (available in http://www.ics.uci.edu/∼mlearn/MLRepository.html). For this reason it was the one chosen to test the Hybrid Architecture prior to experiments carried out with the Consumer's database.
The result of this test was essential for the continuity of the experiments, that is, good results would show that the Hybrid Architecture is valid, while bad results would point out problems with the combined use of these two techniques.
Data set contains 3 petal classes of 50 instances each, in which each class refers to one type of petal of the Iris plant. It is known that one of the classes is linearly separable from the other two and these are not linearly separable from each another. The Iris database contains 4 numerical attributes plus a class, described as follows: 1) sepal length in cm; 2) sepal width in cm; 3) petal length in cm and 4) petal width in cm. Classes are: Iris-Setosa; Iris-Versicolour and Iris-Virginica. It is known that the correlation between the attributes petal length and petal width is high (0.9565) and that class distribution is 33.3% for each of the three classes.
The number of epochs was calculated as following: rough phase = quantity of neurons (225) /data size (150) × 10 = 16.0 and fine tune = quantity of neurons (225) / data size (150) × 40 = 67.0. If the two phases are added (16.0 + 67.0), 83 epochs are obtained.
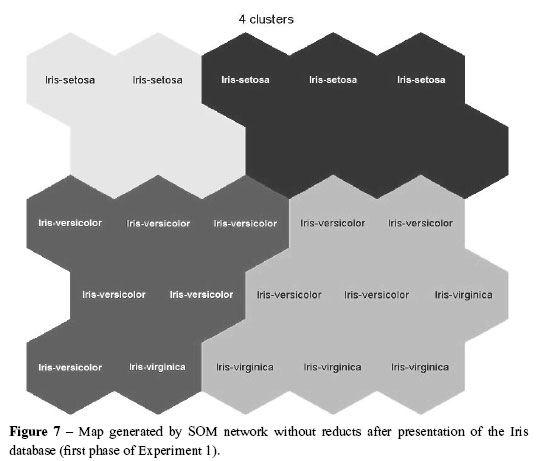
b) First Phase of the Experiment: SOM Network without Reducts
Introducing the Iris database with all its attributes to the SOM network resulted in a map that can be seen in Figure 7.
The map shown in Figure 8 shows that SOM grouped four clusters based on the three classes.Two of them revealed overlap problems and the third class was divided in two clusters.
c) Second Phase of the Experiment: SOM Network with Reducts (Hybrid Architecture)
By applying RS in order to reduce attributes, 4 reducts were obtained. These were able to represent the Iris database with all its attributes. Table 7 shows the reducts generated by RS.
Subsequently, the Iris database was reduced following the 4 reducts generated by RS and presented to the SOM network. Map generated are shown in Figure 8.
d) Results and Discussion
In the four maps shown in Figure 8 it can be seen that with only 3 clusters it was possible to have them defined. Thus Iris-Setosa class, which was divided in two in the first phase of the Experiment (Fig. 8), now is seen unified and it seems clear that it is the linearly separable class out of the other two. Yet, the other two classes (Iris-Versicolour and Iris-Virginica), although in only a few cases, still display a slight overlap. This can be interpreted as an improvement, since the two aforementioned classes are considered nonlinearly separable (Fig. 8).
This occurred because RS reduced the unnecessary information contained in the Iris database,making it possible for the SOM network to produce more cohesive (reduction from 4 to 3 clusters) clusters with a higher degree of similarity of data. On account of this, our Hybrid Architecture was considered better than either the SOM alone or the SOM network without reducts.
Experiment 2: with Consumer Database
The KDD process has a better result when subjected to analysis of large databases. In the case of the proposed work, the database is not extensive in number of records, but has a good number of attributes (48), what matters for the RS, because the technique reduces attributes and not the records.
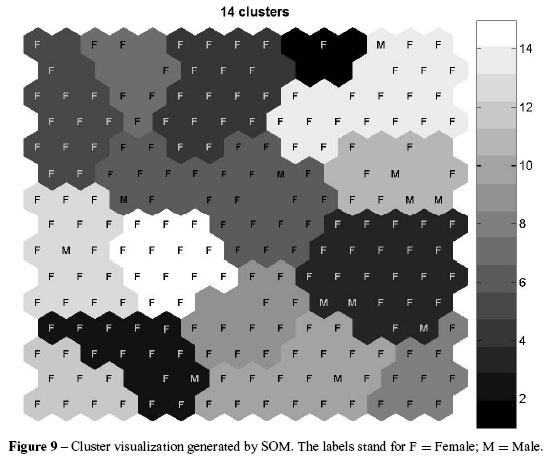
The data selection step was realized using a database called the Consumer database (Fernandez,2003), which contains 48 features (attributes) for each of 1,968 customers (cases), of which 47 attributes are conditional and one is a decision attribute separating the customers into two classes (F = Female; M =Male). The next KDD step is database pre-processing, realized through the elimination of the Accnum attribute that identifies the client number account, which can damage cluster generation and reducts. In the next step, transformation, the Ntitle, nominal attribute, is changed into: Ms = 0; Mr = 1; Mrs = 2 and None = 3.
The RS application in the database generated 88 reducts, of which 16 had 3 attributes, 63 had 4 attributes and 8 had 5 attributes. The reduct choice is based on the minimum computation effort (Mitchell, 1997). Thus, the 16 attributes with the minimum attributes (3) were chosen and of these, a random one was chosen, because the results were equivalent. The chosen reducts were Amount (Dollar Spent), Homeval (Home Value) and Recency (both are attributes from the Customer database) (Fernandez, 2003).
The SOM parameters were divided into structural and learning parameters. The structural parameters were: number of neurons (15 × 15); the hexagonal neighborhood (Kohonen, 1997)and the formatted arrangement in the hexagonal plane. The training time of SOM was divided into two phases: the "rough phase" and "fine tuning". The default values of the SOM toolboxes (Vesanto et al., 2000) are: for "rough phase," 10 × mpd epochs and for "fine tuning," 40 × mpd epochs (mpd = number of neurons / number of cases in database). Thus, the epoch number used in the "rough phase" was 10 × (225 / 1,968) = 12. In the "fine tuning" phase it was equal to 46 (40 × (225 / 1,968)). The learning rate was 0.5 for the "rough phase" and 0.05 for "fine tuning"(Kaski & Kohonem, 1996).
5.2 Results Obtained
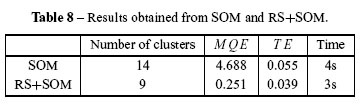
The results in Table 8 show the performance from each part: SOM and RS+SOM (proposed Hybrid Architecture).
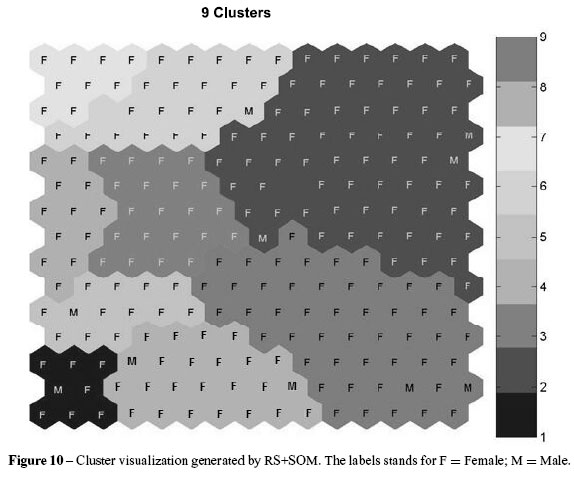
The bar on the side of the map (Figs. 9 and 10) allows an analysis of positive and negative correlation from clusters. While the positive correlation is given by closed color patterns, the negative correlation can be perceived by an inverted color pattern. Whenever one wants to discover knowledge in a database, the possibility of using a SOM must be considered. The maps generated are a simple geometric form to verify whether has found something of interest or some organization in the database.
The application of RS improved the results of the SOM as shown by the measures of performance MQE and TE, the training time, the number of clusters (Table 3) and also by the visual quality of the clustering (Fig. 10, the neighborhoods between the groups, closed colors, in the map).These results indicate that the map generated presented clusters with better definition (border)and more cohesion: for example, discovering profiles of customers or consumption classes that the database stores.
One of the reasons that SOM is used in data mining is the visualization (KDD step) of the map, which offers the specialist conditions for interpreting (KDD step) the results, providing knowledge to support decision making (Vesanto & Alhoniemi, 2000). In Figures 7, 8, 9 and 10, the clusters in each part of the experiment can be visualized.
6 KNOWLEDGE DISCOVERY IN THE EXPERIMENT WITH HYBRIDARCHITECTURE
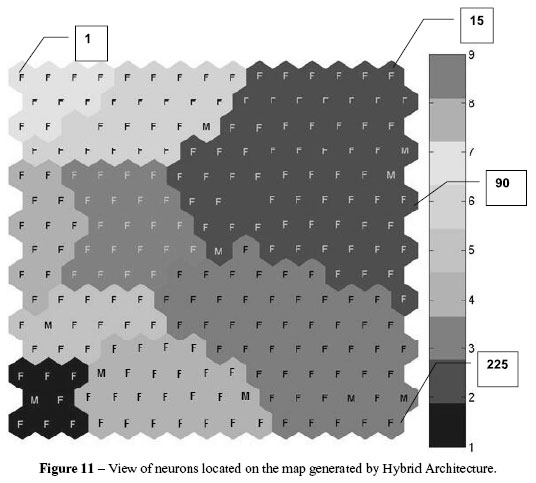
The Figure 10 show that the Hybrid Architecture, through the SOM network, grouped the records of the database Consumer according to the criteria of equality or similarity between the records.The SOM network used in the experiment was an artificial neural network 15 × 15, that is, it shows 225 neurons in Figure 11, grouped into nine clusters containing the records of consumers (F or M). Four neurons (1, 15, 90 and 225) were posted randomly to see if the SOM network really grouped according to these criteria (Fig. 11).
The Table 9 shows how RS with the SOM network (Hybrid Architecture) grouped the records of the Consumer database according to the values of each attribute: the value of the consumer's home, the frequency of requests and age of the consumer (reduct used).
It was concluded that the SOM network grouped the records according to the criteria of equality and likeness of attributes (Fig. 11). Neuron 1, belonging to the yellow cluster, shows that this is a cluster of consumers who are middle-aged, have intermediate-value dwellings, and a higher number of requests. Neurons 15 and 90, belonging to the same blue cluster, show that this is a cluster of consumers who have a lower dwelling value, frequency of requests and are in a range of young adult to middle-aged.
Neuron 225, belonging to the red cluster, shows that this cluster of consumers has a higher dwelling value, frequency of requests and are younger, on average. The conclusions regarding the high, medium and low dwelling value; high, medium and low frequency of requests; and middle-aged or young, were made based on Table 9.
It is clearly shown that the database Consumer has a far greater number of female than male cases. This could easily be perceived in small databases, but the difficulty would be greater in databases with millions of records. This fact justifies the clusters having a larger number of letters F (female) than M (men), and comparing both sexes in the same cluster suggests the same or very similar consumption profiles, which can be verified with greater depth using use classifier or association tools, as aforementioned. In the KDD process, this phase is also known as postprocessing. After the data mining phase, it is necessary to interpret the knowledge discovered.
In this experiment, all the phases in the KDD process represented in Figure 1 were utilized to discover knowledge in the Consumer database.
The implementation of Hybrid Architecture in the Consumer database reduced the values and MQE ET , indicating a better representation of the topology of the data structure.
The training time of the SOM network was also shorter. There was also a reduction in the number of clusters, providing a similarity among the best data concerning the differences separating the groups.
The results led us to conclude that RS reduced the information presented to the SOM network,improving the training of clusters.
Thus, there was improvement in the map offered for viewing in terms of more well-defined borders. The improvement in the formation of clusters allows a better understanding of the organization of the database and enables the carrying out of activities such as targeting sales in campaigns, promotion of combined offerings of services or products, evaluating market performance and detecting new trends, new markets or consumers' needs.
The experiment also allowed greater knowledge to be obtained from the database: it is known that the number of female records is much larger than the male ones and there are similar consumption profiles between the sexes. It can be concluded again that the Hybrid Architecture presented better results than the network without SOM reducts.
7 CONCLUSIONS
This work described all KDD steps to data clustering applied to a database with costumers' profiles, employing two different approaches: Self-Organizing Map (SOM) and a hybrid approach,integrating Rough Sets Theory (RS) and SOM. The results obtained indicate that RS eliminates superfluous information that negatively impacts SOM network, making it possible to improve results, as seen in Table 8 and Figure 10.
The results indicate that the Hybrid Architecture proposed is a potential tool for knowledge extraction to aid decision making.
Techniques can be combined to generate the so-called hybrid architectures. The great advantage of this system is due to the synergy achieved by combining two or more techniques. This synergism results in obtaining a more powerful (in terms of interpretation, learning, generalization,among others) and with fewer disabilities.
The reduction of attributes performed by the RS has information considered uncertain were not presented to the SOM network, improving the boundaries between the clusters. This information, when submitted to the SOM network, generated uncertainty, resulting in some clusters bad definition of border, undermining the separation of clusters.
The combination of RS with the SOM network made with which one of the main shortcomings of the SOM (the definition of boundaries between the clusters) were improved, leading to the conclusion that the combination of two or more techniques reduce individual deficiencies of each technique.
The reduction of uncertainty and the consequent improvement in the generation of clusters obtained with the hybrid architecture enables the formation of clusters better defined, as elements of the database that were in the border region of the clusters were grouped better. This can result in the generation of more reliable rules from a classification algorithm. In addition to the contributions described above, may also consider other contributions such as:
Allowing greater knowledge and greater diffusion of the Theory of RS to review the main concepts of the theory;
Standardize the confusing mathematical formalism of the Theory of RS that was found in the literature searched;
Provide another option for the treatment of uncertainty, beyond those traditionally known as the Theory of Fuzzy Sets and Probability Distribution in Statistics;
Demonstrate the application of key concepts of the theory of RS in reducing uncertainty;
RS+SOM can be used before another data mining algorithm to check the quality of data obtained through the clusters.
Finally, one can consider the application of Hybrid Architecture advantageous in target areas of KDD, as marketing (consumer profile) (Liou, Yen & Tzeng, 2010; Zhang et al., 2011), government (fraud detection) (Steiner et al., 2007), financial (Yongqin & Tao, 2011), production engineering (Liang & Hongmei, 2011), logistics and routing (Affonso, Sassi & Ferreira, 2011),among others.
ACKNOWLEDGMENTS
This work was supported by the Nove de Julho University. I am grateful to Pesquisa Operacional anonymous referees for important improvement recommendations.
Received May 7, 2010 / Accepted October 15, 2011
- 1. AFFONSO C, SASSI RJ & FERREIRA RP. 2011. Traffic flow breakdown prediction using feature reduction through rough-neuro fuzzy networks. International Joint Conference on Neural Networks (IJCNN), 1: 19431947.
- 2. BANERJEE M, MITRA S & PAL SK. 1998. Rough fuzzy MLP: Knowledge encoding and classification. IEEE Transactions on Neural Networks, 9: 12031216.
- 3. BERRY MJA & LINOFF G. 1997. Data Mining Techniques: For Marketing, Sales and Customer Support. John Willey & Sons.
- 4. BERRY MJA & LINOFF G. 2000. Mastering Data Mining: The Art and Science of Customer Relationship Management. Wiley Computer Publishers.
- 5. BIGUS JP. 1996. Data Mining with Neural Network: Solving Business Problems from Applications Development to Decision Support. McGraw-Hill.
- 6. COUTO ABG & GOMES LFAM. 2010. A tomada de decisao em recursos humanos com dados replicados e inconsistentes: uma aplicação da teoria dos conjuntos aproximativos. Pesquisa Operacional, 30(3): 657686.
- 7. DAVIES DL & BOULDIN DW. 1979. A cluster separation measure. IEEE Transactions on Pattern Analysis and Machine Intelligence, 1(2): 224227.
- 8. FAYYAD UM, PIATETSKY-SHAPIRO G & SMITH P. 1996. The KDD process for extracting useful knowledge from volumes of data. Comunications of the ACM, 39(11): 2734.
- 9. FERNANDEZ G. 2003. Data Mining using SAS Applications. Chapman & Hall/CRC.
- 10. HAN J & KAMBER M. 2001. Data Mining: Concepts and Techniques. Morgan Kaufmann Publishers.
- 11. INDIRA SU & RAMESH AC. 2011. Image segmentation using artificial neural network and genetic algorithm: a comparative analysis. International Conference on Process Automation, Control and Computing (PACC), 16.
- 12. JAGIELSKA I. 1998. Hybrid Rough Sets Neural Network approach to the development of a decision support system. Neural Networks Proceedings. IEEE World Congress on Computational Intelligence, 1: 2428.
- 13. JOHNSON RA & WICHERN DW. 1998. Applied Multivariate Statistical Analysis. Prentice-Hall.
- 14. KASKI S & KOHONEN T. 1996. Exploratory data analysis by the self-organizing map: structures of welfare and poverty in the world. Proceedings of the third International Conference on Neural Networks in the Capital Markets. World Scientific, 498507.
- 15. KIVILUOTO K. 1996. Topology preservation in Self-Organizing Maps. Proceedings of International Conference on Neural Networks (ICNN'96), 1: 294299.
- 16. KOHONEN T. 1997. Exploration of very large databases by self-organizing maps. International Conference on Neural Networks, 1: PL1PL6.
- 17. LIANG C & HONGMEI S. 2011. Evaluation on high-tech industry competitiveness based on factor analysis and cluster analysis. International Conference on Management and Service Science (MASS),15.
- 18. LINGRAS P. 1996. Rough Neural Networks. Sixth International Conferences Information Processing and Management of Uncertainly in Knowledge-Based Systems. Proceedings IPMU96, 14451450.
- 19. LINGRAS P & BUTZ CJ. 2010. Rough support vector regression. European Journal of Operational Research, 206(2): 445455.
- 20. LIOU JJH, YEN L & TZENG GWO-HSHIUNG. 2010. Using decision rules to achieve mass customization of airline services. European Journal of Operational Research, 205(3): 680686.
- 21. MITCHELL T. 1997. Machine Learning. McGraw-Hill.
- 22. MITRA S, PAL SK & MITRA P. 2002. Data mining in soft computing framework: A survey. IEEETransactions on Neural Networks, 13: 314.
- 23. PAWLAK Z. 1982. Rough Sets. International Journal of Computer and information Sciences, 341356.
- 24. PAWLAK Z, GRZYMALA-BUSSE J, SLOWINSKI R & ZIARKO W. 1995. Rough Sets, Comunications of the ACM; 8995.
- 25. PIATETSKY-SHAPIRO G. 1989. Knowledge discovery in real databases. A report on the IJCAI-89 Workshop. AI Magazine, 11: 6870.
- 26. PYLE D. 1999. Data Preparation for Data Mining. Morgan Kaufmann Publishers.
- 27. SANT'ANNA AP. 2008. Rough sets analysis with antisymmetric and intransitive attributes: classification of brazilian soccer clubs. Pesquisa Operacional, 28(2): 217230.
- 28. STEINER MTA, NIEVOLA JC, SOMA NY, SHIMIZU T & NETO PJS. 2007. Extração de regras de classificação a partir de redes neurais para auxílio à tomada de decisão na concessão de crédito bancário. Pesquisa Operacional, 27(3): 407426.
- 29. ULTSCH A. 1993. Knowledge extraction from self-organizing neural networks. Opitz. Information and Classification Springer, 301306.
- 30. VESANTO J & ALHONIEMI E. 2000. Clustering of the Self-organizing Map. IEEE Transaction on Neural Network, 11: 586600.
- 31. VESANTO J, HIMBERG J, ALHONIEMI E & PARHANKANGAS J. 2000. SOM Toolbox for Matlab 5. Technical report A 57 Helsinki University of Technology, Finland.
- 32. YONGQIN L & TAO L. 2011. Enterprise financial prediction analysis based on rough set and neural network. International Conference on E-Business and E-Government (ICEE), 13.
- 33. ZHANG TIE-JUN, HUANG XING-HUA, TANG JIA-FU & LUO XING-GANG. 2011. Case study on cluster analysis of the telecom customers based on consumers' behavior. 18th International Conference on Industrial Engineering and Engineering Management (IE&EM), 2: 13581362.
Publication Dates
-
Publication in this collection
08 Mar 2012 -
Date of issue
Apr 2012
History
-
Received
07 May 2010 -
Accepted
15 Oct 2011