ABSTRACT
This article aims to analyze the technical performance of football teams in the FA Premier League during the 2015/2016 season. Data of twenty clubs over 38 matches for each club are considered using 23 variables. These variables have been explored in the football literature and address different features of technical performance. The different configuration of the data for teams in detached segments motivated the multi-criteria approach, which enables identification of strong and weak sectors in each segment. The uncertainty as to the outcome of football matches and the imprecision of the measures indicated the use of Composition of Probabilistic Preferences (CPP) to model the problem. “R” software was used in the modeling and computation. The CPP global scores obtained were more consistent with the final classification than those of other methods. CPP scores revealed different performances of particular groups of variables indicating aspects to be improved and explored.
Keywords:
match analysis; probabilistic composition of preferences; football
1 INTRODUCTION
Performance in football has been described as a construct with interaction between individual and collective levels (Bradley et al., 20115 BRADLEY PS, CARLING C, ARCHER D, ROBERTS J, DODDS A, DI MASCIO M & KRUSTRUP P. 2011. The effect of playing formation on high-intensity running and technical profiles in English FA Premier League soccer matches. Journal of Sports Sciences, 29(8): 821-830.). Results of football matches, for example, provide objective measures of both player and team performance. Interactions within the team due to cooperation based on a strategic plan, situational variables and constraints provided by the general context of the game can be considered (Besters, van Ours & van Tuijl, 20164 BESTERS LM, VAN OURS JC & VAN TUIJL MA. 2016. Effectiveness of In-Season Manager Changes in English Premier League Football. De Economist, 164(3): 335-356.).
The analysis of actions performed in a match context produces quantitative data that may become relevant information to support coaches’ decisions (Carling, Williams & Reilly, 200511 CARLING C, WILLIAMS AM & REILLY T. 2005. Handbook of soccer Match Analysis. A systematic approach to improving performance.). Technical elements of player performance in football are measured by notational systems, designed to register and store information on players’ actions, in order to identify patterns of play and critical elements of performance. For football analysis, these systems provide statistics related to players’ actions (passing, shots on goal, fouls, etc.) that may provide varied information about the success of the teams (Woods, Raynor, Bruce, McDonald & Robertson, 201657 WOODS CT, RAYNOR AJ, BRUCE L, MCDONALD Z & ROBERTSON S. 2016. The application of a multi-dimensional assessment approach to talent identification in Australian football. Journal of Sports Sciences, 34(14): 1340-1345.).
The related literature shows contradictions between the performance of players in the execution of expected actions and the successful and unsuccessful results of the teams. This happens, for instance, with the strategy of direct play, which is described as few passes per team possession and identified by attacks involving at least one long pass, attacks with a maximum of two passes, and fast-moving attacks. Possibly, the long pass abilities and skill of players influence the effectiveness of direct play strategy (Fernandez-Navarro, Fradua, Zubillaga & Ford, 201618 FERNANDEZ-NAVARRO J, FRADUA L, ZUBILLAGA A, FORD PR & MCROBERT AP. 2016. Attacking and defensive styles of play in soccer: analysis of Spanish and English elite teams. 414 (April).).
Other studies suggest that counter-attacks are more effective than planned attacks when playing against an unbalanced defense (Tenga, Holme, Ronglan & Bahr, 201056 TENGA A, HOLME I, RONGLAN LT & BAHR R. 2010. Effect of playing tactics on achieving scorebox possessions in a random series of team possessions from Norwegian professional soccer matches. Journal of Sports Sciences, 28(3): 245-255.). Furthermore, Lago-Ballesteros & Lago-Peñas (201026 LAGO-BALLESTEROS J & LAGO-PEÑAS C. 2010. Performance in Team Sports: Identifying the Keys to Success in Soccer. Journal of Human Kinetics, 25(July): 85-91.) reported that successful teams usually touch the ball more often. In this way, ball possession has also been reported as a variable decisively affecting the performance of football teams.
Most of these studies used manual notation and computer systems to process the data. In the same way, football coaches use notational analysis to evaluate their team and opponent teams’ players. A notation system enables an assessment of the relative merits of team and player performance, becoming the first step towards performance analysis (Eaves, 201517 EAVES SJ. 2015. A history of sports notational analysis: a journey into the nineteenth century. International Journal of Performance Analysis in Sport, 15(3): 1160-1176.).
However, these studies access a huge amount of raw data, which is quite difficult to analyze in order to determine which teams had the best performance. In addition, uncertain outcomes and imprecise data are common in the football environment. A statistical approach, allowing for the use of estimation and simulation techniques would provide results whose uncertainty could be measured. That would certainly be strongly welcome. Nevertheless, by now, the lack of reliable models for this field makes unfeasible such a statistical approach. Instead we take here a multicriteria decision analysis (MCDA) approach.
To take into account uncertainty we apply Composition of Probabilistic Preferences (CPP), a technique that uses probabilistic reasoning to combine preferences according to separate criteria. To do that, the evaluations by the separated criteria are modeled as random variables. The application of CPP is compared to the application of two methods based on the use of fuzzy numbers instead of crisp numbers for the values and weights of the criteria in well known exact MCDA methods: Fuzzy MULTIMOORA Method and Fuzzy VIKOR Method.
In CPP, triangular distributions for the initial preference assessments are employed, while triangular fuzzy number (TFN) are used in the fuzzy methods. In spite of the conceptual differences, a comparison of the results could be done. After applying the three methods to the same matches statistics of an FA Premier League, Kendal and Spearman correlation coefficients were used to analyze the efficiency of each method with respect to the study’s objectives.
These objectives are to discuss the relevance of the imprecise factors evaluated to predict the ranking of the teams at the end of the competition. CPP is used to obtain an analysis of the teams’ performances in the competition, especially taking into account the decisions that may be taken to improve the performance of each team. First, it is shown how a suitable point of view in the probabilistic composition better fits the final ranking of FA Premier League season 2015/2016.
CPP is first applied on the whole set of 23 variables considered in the study taken together and, after that, on three groups of technical performance variables separately. In this last analysis, the teams are evaluated from the perspectives of goal attempts, offensive moves and defensive actions, three phases which occur in the development of a football match and are important for the knowledge and development of each team. In this way, finding out in which of the phases of the game the team has the best or the worst performance can change the way the coaches may improve their training section.
This study is organized as follows. In the next section, the methods employed including CPP, fuzzy numbers, fuzzy MULTIMOORA, fuzzy VIKOR and correlation analysis, are introduced Section 3 presents the data. The results obtained are discussed in Section 4. Finally, a section of conclusions is presented.
2 TECHNIQUES AND METHODS
In this section a brief review of the techniques employed is presented.
2.1 Composition of Probabilistic Preferences
CPP is a multi-criteria (MC) decision support method introduced by Sant’Anna & Sant’Anna (200149 SANT’ANNA AP & SANT’ANNA LAFP. 2001. Randomization as a stage in criteria combining. In International Conference on Industrial Engineering and Operations Management - VII ICIEOM, (pp. 248-256). Salvador.) that was recently expanded to different applications in decision support by Sant’Anna (201545 SANT’ANNA AP. 2015. Probabilistic Composition of Preferences, Theory and Applications.). In general, MC methods intend to help decision-makers dealing with several possibilities in a choice set. The MC problems usually lead to a compromise between conflicting criteria, such as quality and cost, for instance. In particular, CPP has been applied to MC analysis in sport sciences (Sant’Anna & Soares de Mello, 201250 SANT’ANNA AP & SOARES DE MELLO JCCB. 2012. Validating Rankings in Soccer Championships. Pesquisa Operacional, 32(2): 407-422.).
CPP adopts a probabilistic approach to MC decision problems. The majority of MC methods apply deterministic or fuzzy evaluations of alternatives under different criteria (Mardani, Jusoh, Zavadskas, Khalifah & Nor, 201538 MARDANI A, JUSOH A, ZAVADSKAS EK, KHALIFAH Z & NOR KMD. 2015. Application of multiple-criteria decision-making techniques and approaches to evaluating of service quality: a systematic review of the literature. Journal of Business Economics and Management, 16(5): 1034-1068.). On the other hand, CPP explores the uncertainty that is inevitably present in preference evaluations in real problems. This uncertainty may result from processes involving expert reviews, inaccurate performance measures or processes with imperfect metric systems, among others. Adopting a probabilistic framework, the evaluation of each alternative takes the form of a probability function and the final ranking is derived from probabilities of being the best alternative (Garcia & Sant’Anna, 201519 GARCIA PA DE A & SANT’ANNA AP. 2015. Vendor and Logistics Provider Selection in the Construction Sector: a Probabilistic Preferences Composition Approach. Pesquisa Operacional, 35(2): 363-375.).
CPP is developed in three stages. The first refers to the ‘randomization’ of the evaluations. Randomization means the transformation of exact values into random variables. In Figure 1, for instance, the performance of alternative ‘A’ under criterion ‘1’ is represented by an exact value ‘10’. The randomization procedure changes this measurement into a probability distribution. In this case, a normal disturbance was assumed as a general behavior for evaluating alternative ‘A’, and the value ‘10’ as a mode of this probability distribution. In summary, the value is taken as a single measure of location in a probability distribution that reflects the uncertainty and imprecision of the model (Sant’Anna, 201545 SANT’ANNA AP. 2015. Probabilistic Composition of Preferences, Theory and Applications.).
CPP first stage. (Gavia˜o, Silva, Sant’Anna & Lima (2016)20 GAVIÃO LO, SILVA RF DA, SANT’ANNA, AP & LIMA GBA. 2016. Ordenação de Municípios por Potencial de Contaminação de Águas com Fármacos Oncológicos por Composição Probabilística de Preferências [Powerpoint slides in Portuguese]. In Simpósio Brasileiro de Pesquisa Operacional, (p. 12). Vitória.).
The randomization may derive from a priori information obtained in similar contexts. For example, failure rates in reliability problems are generally adjusted by Exponential, Weibull or Birnbaum-Saunders distributions (Chiodo & Lauria, 201513 CHIODO E & LAURIA D. 2015. Some Basic Properties of the Failure Rate of Redundant Reliability Systems in Industrial Electronics Applications. IEEE Transactions on Industrial Electronics, 62(8): 5055-5062.). For a data set of preferences, the probability function can be obtained from goodness-of-fit tests for density estimation (DelignetteMuller & Dutang, 201414 DELIGNETTE-MULLER ML & DUTANG C. 2014. Fitdistrplus: An R Package for Fitting Distributions. J. Stat. Softw., 64: 1-34.). Disturbances can also be described by non-parametric or empirical distributions, in the case of abundant data (Millard, 201339 MILLARD SP. 2013. EnvStats, an R Package for Environmental Statistics. Wiley Online Library.).
In the second stage, the joint probabilities Mij and mij are computed. Mij and mij denote, respectively, the probability of the i-th alternative being the best and the worst alternative according to the j-th criterion. In other words, ‘M’ refers to maximizing and ‘m’ to minimizing the preferences. Equations (1) and (2) describe the mathematical development to compute Mij and mij .
In equations (1) and (2), FX indicates the cumulative distribution function (cdf), fX the probability density function (pdf) and DXi the support of the i-th alternative. The notation ‘-i’ indicates all alternatives under the same j-th criterion, except the i-th alternative, which is the considered alternative to compute Mij and mij (Sant’Anna, Costa, Nepomuceno & Pereira, 201647 SANT’ANNA AP, COSTA HG, NEPOMUCENO DO & PEREIRA V. 2016. A probabilistic approach applied to the classification of courses by multiple evaluators, 36: 469-485. https://doi.org/10.1590/0101-7438.2016.036.03.0469.
https://doi.org/10.1590/0101-7438.2016.0...
).
In the third stage, the joint probabilities ‘Mij ’ and ‘mij ’ are composed according to different points of view of the decision maker, as described in Figure 2 and Table 1. Two axes are identified: The Progressive (P) - Conservative (C) and the Optimist (O) - Pessimist (P). These axes create four possible combinations to tailor the decision-making: PP, PO, CO and CP.
Composition by axis. (Adapted from Gavia˜o, Silva, Sant’Anna & Lima (2016)20 GAVIÃO LO, SILVA RF DA, SANT’ANNA, AP & LIMA GBA. 2016. Ordenação de Municípios por Potencial de Contaminação de Águas com Fármacos Oncológicos por Composição Probabilística de Preferências [Powerpoint slides in Portuguese]. In Simpósio Brasileiro de Pesquisa Operacional, (p. 12). Vitória.).
The global scores are computed using the equations in Table 1. The global score ranking gives the final preference for each alternative. The equations reflect all decision-maker points of view, under the hypothesis of independence between all the criteria. If a correlation can be quantified, it can be introduced into the combinations. However, quantifying correlation among criteria is not an easy task, because it requires the detection of reciprocal influence between errors in the measurement of variables. For more details on the different assumptions regarding correlation between criteria, the reader is referred to Sant’Anna (201545 SANT’ANNA AP. 2015. Probabilistic Composition of Preferences, Theory and Applications., Section 5.2).
The progressive-conservative axis uses ‘Mij ’ or ‘mij ’ as parameters to compose the decision-maker points of view, as depicted in Figure 2. The Progressive approach involves the concept of ‘maximizing gains’, plotting the decision at the frontier of excellence. For a positive-impact criterion, a progressive decision requires the use of ‘Mij ’ to combine criteria and for a negative-impact criterion, the use of ‘mij ’ is needed.
On the other hand, the conservative approach reflects the idea of ‘avoiding losses’ in which the decision maker aims to differentiate alternatives near the border of worst performance. By analogy with the progressive point of view, for a positive-impact criterion to the research problem, a conservative approach requires the use of ‘mij ’ to combine criteria and for a negative-impact criterion, the use of ‘Mij ’ is expected.
The optimist-pessimist axis refers to the combination of ‘Mij ’ and ‘mij ’ as strict preferences for all criteria or satisfying at least one of the multiple criteria (Sant’Anna, 201545 SANT’ANNA AP. 2015. Probabilistic Composition of Preferences, Theory and Applications.).
2.2 Triangular Fuzzy Number
Fuzzy sets theory was developed by Zadeh (196559 ZADEH LA. 1965. Information and control. Fuzzy Sets, 8(3): 338-353.). The fuzzy logic has been applied to combine evaluations given by fuzzy sets in different fields of knowledge (Mardani, Jusoh & Zavadskas, 201538 MARDANI A, JUSOH A, ZAVADSKAS EK, KHALIFAH Z & NOR KMD. 2015. Application of multiple-criteria decision-making techniques and approaches to evaluating of service quality: a systematic review of the literature. Journal of Business Economics and Management, 16(5): 1034-1068.). A fuzzy number à = (a, b, c), as designed in Figure 3, is called a triangular fuzzy number (TFN). The membership function μà (x) denotes the degree of truth that the fuzzy value is equal to x within the real interval (lower, upper). The TFN à has the core b with μà (b) = 1 and the support [a, c]. Fuzziness allows a membership μ of an object to a fuzzy set vary within an interval (0, 1), whereas Boolean sets allow only either a full membership or a full non-membership (Almeida, Yamakami & Takahashi, 20061 ALMEIDA TA, YAMAKAMI A & TAKAHASHI MT. 2006. Sistema imunológico artificial para resolver o problema da árvore geradora mínima com parâmetros fuzzy, Pesquisa Operacional, 27(1): 131-154.; Silva, 200853 SILVA RC. 2008. Relação entre modelos de programação não-linear com incerteza no conjunto de restrições. Pesquisa Operacional, 28(3): 383-398.).
Triangular Fuzzy Number. (Silva (200853 SILVA RC. 2008. Relação entre modelos de programação não-linear com incerteza no conjunto de restrições. Pesquisa Operacional, 28(3): 383-398.)).
The TFN membership function FA ( x ) has the following form, in Equations (3):
Mathematical operations on a generic TFN are defined from Equation (4) to (12) (Opricovic, 201143 OPRICOVIC S. 2011. Fuzzy VIKOR with an application to water resources planning. Expert Systems with Applications, 38(10): 12983-12990.):
2.3 The Fuzzy Multimoora Method
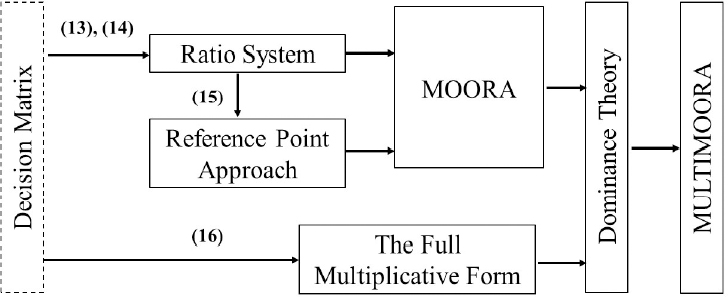
The multi-objective optimization by ratio analysis (MOORA) method was introduced by Brauers & Zavadskas (20067 BRAUERS WKM & ZAVADSKAS EK. 2006. The MOORA method and its application to privatization in a transition economy. Control and Cybernetics, 35(2): 445-469.) on the basis of previous research. Later, the method was extended into a more robust design, by adding a full multiplicative form to MOORA (Brauers & Zavadskas, 20108 BRAUERS WKM & ZAVADSKAS EK. 2010. Project management by MULTIMOORA as an instrument for transition economies. Technological and Economic Development of Economy, 16(1): 5-24.). The MULTIMOORA method is described in Figure 4, with indications of its four Equations (Balezˇentis & Balezˇentis, 20143 BALEŽENTIS T & BALEŽENTIS A. 2014. A Survey on Development and Applications of the Multicriteria Decision Making Method MULTIMOORA. Journal of Multi-Criteria Decision Analysis, 21(3-4): 209-222.).
Fuzzy Multimoora design. (Balezˇentis & Balezˇentis (20143 BALEŽENTIS T & BALEŽENTIS A. 2014. A Survey on Development and Applications of the Multicriteria Decision Making Method MULTIMOORA. Journal of Multi-Criteria Decision Analysis, 21(3-4): 209-222.)).
The Multimoora method is summarized by Equations (13)-(16).
Application of the MOORA method begins with a decision matrix, X, where xij denotes the evaluation of the i-th alternative with respect to the j-th objective (i = 1, 2, ..., m and j = 1, 2, ..., n). The first step is divided in two parts: the ratio system and the reference point approach. Equation (13) describes the ratio system, which is basically a data normalization. In Equation (14), the xij values are added (if desirable value of indicator is maximum) or subtracted (if desirable value is minimum), to yield a summarizing index yi . The reference point approach produces a final rank derived from the deviations from the reference point, applying the min-max metric of Tchebycheff, as depicted in Equation (15) (Brauers & Zavadskas, 20108 BRAUERS WKM & ZAVADSKAS EK. 2010. Project management by MULTIMOORA as an instrument for transition economies. Technological and Economic Development of Economy, 16(1): 5-24., 20129 BRAUERS WKM & ZAVADSKAS EK. 2012a. A multi-objective decision support system for project selection with an application for the Tunisian textile industry. E&M Ekonomie a Management, 15(1): 28-43.). The overall utility of the i-th alternative can be expressed as a dimensionless number U, in Equation (16). By this way, MULTIMOORA summarizes MOORA (i.e. ratio system and reference point) and the full multiplicative form (Balezˇentis & Balezˇentis, 20143 BALEŽENTIS T & BALEŽENTIS A. 2014. A Survey on Development and Applications of the Multicriteria Decision Making Method MULTIMOORA. Journal of Multi-Criteria Decision Analysis, 21(3-4): 209-222.).
Following the general practice to extend deterministic MCDA methods into the fuzzy environment, the Fuzzy MULTIMOORA method, introduced by Brauers, Balezˇentis & Balezˇentis (20116 BRAUERS WKM, BALEŽENTIS A & BALEŽENTIS T. 2011. MULTIMOORA for the EU Member States updated with fuzzy number theory. Technological and Economic Development of Economy, 17(2): 259-290.), is built replacing the initial crisp evaluations by fuzzy numbers and the numeric operations by fuzzy logic operations. A detailed description of all adaptations from the crisp approach to the Fuzzy MULTIMOORA can also be addressed at Balezˇentis & Balezˇentis (20143 BALEŽENTIS T & BALEŽENTIS A. 2014. A Survey on Development and Applications of the Multicriteria Decision Making Method MULTIMOORA. Journal of Multi-Criteria Decision Analysis, 21(3-4): 209-222.).
2.4 Fuzzy Vikor Method
The VlseKriterijuska Optimizacija I Komoromisno Resenje (VIKOR) method has been developed as an MCDM method to solve a discrete multicriteria problem with non-commensurable and conflicting criteria (Opricovic, 199841 OPRICOVIC S. 1998. Multicriteria optimization of civil engineering systems. Faculty of Civil Engineering, Belgrade, 2(1): 5-21., 201143 OPRICOVIC S. 2011. Fuzzy VIKOR with an application to water resources planning. Expert Systems with Applications, 38(10): 12983-12990.). The foundation for a compromise solution was established by Yu (197358 YU P-L. 1973. A class of solutions for group decision problems. Management Science, 19(8): 936- 946.), Duckstein & Opricovic (198016 DUCKSTEIN L & OPRICOVIC S. 1980. Multiobjective optimization in river basin development. Water Resources Research, 16(1): 14-20.) and Zeleny (198260 ZELENY M. 1982. Multi criteria decision making. New York: McGraw-Hills.). The method determines a compromise ranking-list, the compromise solution, and the weight stability intervals for preference stability of the compromise solution obtained with the initial (given) weights. In providing such a compromise solution, VIKOR applies the concepts of “acceptable advantage” and “acceptable stability” to determine the maximum “group utility of the majority” and the minimum “individual regret of the opponent” (Anvari, Zulkifli, & Arghish, 20142 ANVARI A, ZULKIFLI N & ARGHISH O. 2014. Application of a modified VIKOR method for decision-making problems in lean tool selection. International Journal of Advanced Manufacturing Technology, 71(5-8): 829-841.; Opricovic & Tzeng, 200444 OPRICOVIC S & TZENG GH. 2004. Compromise solution by MCDM methods: A comparative analysis of VIKOR and TOPSIS. European Journal of Operational Research, 156(2): 445-455.), which are combined in a final score. The extension of VIKOR to determine a fuzzy compromise solution adopted in the present application is presented in Opricovic (200742 OPRICOVIC S. 2007. A fuzzy compromise solution for multicriteria problems. International Journal of Uncertainty, Fuzziness and Knowledge-Based Systems, 15(3): 363-380.).
The compromise-ranking algorithm of VIKOR consists of five steps. The notation, proposed by Anvari et al. (20142 ANVARI A, ZULKIFLI N & ARGHISH O. 2014. Application of a modified VIKOR method for decision-making problems in lean tool selection. International Journal of Advanced Manufacturing Technology, 71(5-8): 829-841.), is described in Equations (17) to (24). Step 1 describes the basic phase of every MCDM method, regarding the formation of a decision matrix. The alternatives are denoted by A 1 , A 2 , ... Ai, ... Am , where m is the number of alternatives. The weight of the j-th criterion, expressing the relative importance of the criteria, is denoted wj , where j = 1, 2, ..., n, for n representing the number of criteria. The rating (performance score) by the j -th criterion is denoted by fij for alternative Ai . In Step 2, the best and the worst values of all criteria are computed according as the i-th is a benefit criterion (positive impact to the final solution) - in Equation (17), or a cost criterion (negative impact to the final solution) - in Equation (18).
In Step 3, the values of a utility measure S j and a regret measure Rj are obtained, using the relations depicted in Equations (19) and (20), respectively. The minimum Si emphasizes the maximum group utility, whereas Ri emphasizes the minimum value among the maximum individual regrets
In Step 4, Qj indices are evaluated, using the relation in Equations (21) and (22). The values of S* may also use the best option S* = 0 and S− the worst value S− = 1. For R* and R−, the best R* = 0 or the worst R− = 1 can also been chosen. The parameter v(0 ≤ v ≤ 1) is introduced as a weight for the strategy of maximum group utility, whereas (1 − v) is the weight of the individual regret. In other words, the increase of v emphasizes group utility (i.e. v> 0.5), whereas v ≈ 0.5 reflects consensus and v< 0.5 a veto. A way to compute v is by the formulae (n + 1)/2.n, as proposed by Opricovic (201143 OPRICOVIC S. 2011. Fuzzy VIKOR with an application to water resources planning. Expert Systems with Applications, 38(10): 12983-12990.). This latter approach was used in the present study leading to a value of v of 0.522)
In Step 5, the R, S and Q approaches are combined using the two conditions in Equation (23) and the definition (24),
where A 1 and A 2 denote the best and the second best alternatives according to the Q indices
Condition 1 refers to an acceptable advantage and Condition 2 reflects an acceptable stability in the decision making process, where A 1 is also the best in at least one of the R and the S rankings. Alternative A 1 is chosen if Conditions 1 and 2 are satisfied. If one of these two conditions is not satisfied, then a set of compromise solutions is proposed: (1) Alternatives A 1 and A 2, if only Condition 2 is not satisfied; (2) All the alternatives A for which Q(A) − Q(A1)< 1/(n − 1) if Condition 1 is not satisfied (Anvari et al., 20142 ANVARI A, ZULKIFLI N & ARGHISH O. 2014. Application of a modified VIKOR method for decision-making problems in lean tool selection. International Journal of Advanced Manufacturing Technology, 71(5-8): 829-841.).
VIKOR and the Technique of Order Preference by Similarity to the Ideal Solution (TOPSIS) use a similar approach to a MCDM problem. These methods are based on an aggregating function representing ‘closeness to the ideal’, which originated in the compromise programming method. The VIKOR method of compromise ranking is based on the idea of maximizing a ‘group utility’ that reflect the majority choice and a minimum of an individual regret for the ‘opponent’. The TOPSIS method determines a solution with the shortest distance to the ideal solution and the greatest distance from the negative-ideal solution, but it does not consider the relative importance of these distances (Opricovic & Tzeng, 200444 OPRICOVIC S & TZENG GH. 2004. Compromise solution by MCDM methods: A comparative analysis of VIKOR and TOPSIS. European Journal of Operational Research, 156(2): 445-455.). Considering the similarity and differences of both methods, the VIKOR method was prioritized in this study.
2.5 Kendall and Spearman Nonparametric Correlation Indices
Kendall and Spearman indices are used to access the correlation between two variables calculated in a set of N alternatives. The Kendall coefficient was developed by (Kendall, 193825 KENDALL MG. 1938. A new measure of rank correlation. Biometrika, 30(1/2): 81-93.). This coefficient is identified with the Greek letter τ (tau). In Equation (25), the notation Nc represents the amount of pairs of alternatives evaluated for which the ordinal positions are concordant, while Nd indicates the number of discordant pairs. A pair of alternatives is count as concordant whenever the differences between their ordinal positions by the two variables have the same sign and is count as discordant if these differences have different signs. The denominator of equation (25) indicates the amount of possible pairs of alternatives.
The Spearman coefficient is defined in Equation (26), and is represented by the Greek letter ρ (rho). In fact, the Spearman coefficient formula is similar to Pearson’s. The difference comes from the use of ranks RX and RY , instead of X and Y original values. The Spearman coefficient is obtained from the division between the covariance of RX and RY and the product of their standard deviations (Spearman, 1904).
The Kendall and Spearman coefficients are among the most commonly used ordinal correlation techniques in statistics (Gibbons & Chakraborti, 201121 GIBBONS JD & CHAKRABORTI S. 2011. Nonparametric statistical inference. In: International encyclopedia of statistical science. Springer Berlin Heidelberg, 977-979.; Hauke & Kossowski, 201123 HAUKE J & KOSSOWSKI T. 2011. Comparison of values of Pearson’s and Spearman’s correlation coefficients on the same sets of data. Quaestiones Geographicae, 30(2): 87-93.). These nonparametric methods perform the calculations from the ranks obtained after ordering by the two variables. The correlation results vary in the range [1, −1], in which “−1” depicts the highest negative correlation and “1” the maximum positive correlation. The null value indicates no correlation between the ranks. In Tables 5, 7 and 9 in the next section, the ranks corresponding from the scores obtained by different multicriteria methods are employed to evaluate Kendall and spearman correlation coefficients with the PL ranking.
Similar results would be obtained by employing the nonparametric tests based on these statistics as in Leoneti (201631 LEONETI AB. 2016. Considerations Regarding the Choice of Ranking Multiple Criteria Decision Making Methods. Pesquisa Operacional, 36: 259-277.).
2.6 Data Collection
The data used in the study were from all 38 rounds of the FA Premier League season 2015/2016. Official Premier League performance data are collected and analyzed by Opta (optasports.com), part of Perform Content, a division of Perform Group (performgroup.com).
The live data are collected by a three-person team covering each match. Two highly trained analysts use a video-based collection system to collect information about what happens every time a player touches the ball. All the data collected are then subjected to an exhaustive postmatch check to ensure accuracy. After that, the data are available on the FA Premier League web site (premierleague.com/tables). To perform the proposed analysis, the actions of the players during each match were organized by team.
In the Premier League website, a total of 30 variables divided into an attack, defense, discipline and team play can be found. Specifically, 23 discrete technical performance variables were selected for extraction, based on their reporting in previous literature and the perception of their importance by the authors. The variables collected by Opta that are not used in previous studies and are considered in the present study are Big Chances Created, Hit Woodwork, Clean Sheets are Headed Clearance, which have positive impacts and Errors Leading to Goal and Own Goals, with negative impacts.
Table 2 presents a description of the variables employed in the analyses and a source in the literature asserting their importance. For the six variables introduced due to the perception of the authors, a link to the Premier League data is presented.
The 23 variables in Table 2 were grouped in three sets, as described in Table 3. These groups of variables were explored by several authors, such as Lago-Ballesteros & Lago-Peñas (201025 KENDALL MG. 1938. A new measure of rank correlation. Biometrika, 30(1/2): 81-93.); Liu, Gomez & Lago-Penas (201535 LIU H, YI Q, GIMÉNEZ J-V, GÓMEZ MA & LAGO-PEÑAS C. 2015. Performance profiles of football teams in the UEFA Champions League considering situational efficiency. International Journal of Performance Analysis in Sport, 15 april, 371-390.); Sgro et al. (201551 SGRO F, BARRESI M & LIPOMA M. 2015. The analysis of discriminant factors related to team match performances in European football Championship 2012. Journal of Physical Education and Sport, 15(3): 460-465.) and Liu et al. (201632 LIU H, GÓMEZ M-A, GONÇALVES B & SAMPAIO J. 2016. Technical performance and match-tomatch variation in elite football teams. Journal of Sports Sciences, 34(6): 509-518.), in order to express a team behavior by distinctive phases during a football match.
2.7 Data Analysis
CPP was applied in two types of analyses. First, the global performance was determined considering all 23 variables together as independent criteria. The Fuzzy MMOORA and the Fuzzy VIKOR, as described in the Section 2, were applied to the same data set to compare performances. A correlation with the official rank of Premier League, season 2015-2016, was a proxy measure to check the adequacy of these methods to the context, as detailed also in Section 2.
The second analysis consisted of using CPP with three dimensions of variables and combining the results thus obtained. The groups of variables (GV) are described in Table 3. Each team received a specific score for each GV. Finally, their GV scores were inputs for another round of composition by CPP. This last stage created a new global ranking. Appendices I Appendix I - CPP 2nd stage results. PL 15-16 V1 V2 V3 V4 V5 P.max P.min P.max P.min P.max P.min P.max P.min P.max P.min Arsenal 0.081 0.020 0.060 0.015 0.079 0.016 0.026 0.156 0.264 0.010 Aston Villa 0.012 0.237 0.019 0.171 0.023 0.164 0.029 0.072 0.022 0.177 Bournemouth 0.020 0.043 0.027 0.035 0.029 0.046 0.033 0.038 0.024 0.107 Chelsea 0.043 0.024 0.040 0.020 0.041 0.025 0.039 0.025 0.034 0.029 Crystal Palace 0.016 0.066 0.028 0.033 0.032 0.036 0.039 0.025 0.032 0.034 Everton 0.043 0.024 0.031 0.026 0.042 0.024 0.039 0.025 0.054 0.017 Leicester City 0.123 0.019 0.039 0.021 0.044 0.023 0.291 0.008 0.115 0.012 Liverpool 0.064 0.021 0.142 0.012 0.065 0.017 0.029 0.072 0.044 0.021 Manchester City 0.183 0.017 0.111 0.012 0.078 0.016 0.047 0.019 0.042 0.021 Manchester United 0.024 0.035 0.023 0.058 0.030 0.045 0.033 0.038 0.032 0.034 Newcastle United 0.019 0.046 0.020 0.118 0.032 0.038 0.033 0.038 0.026 0.064 Norwich City 0.016 0.066 0.022 0.073 0.026 0.074 0.026 0.156 0.025 0.078 Southampton 0.043 0.024 0.038 0.021 0.037 0.028 0.033 0.038 0.052 0.018 Stoke City 0.017 0.056 0.022 0.072 0.026 0.077 0.047 0.019 0.036 0.027 Sunderland 0.023 0.037 0.024 0.049 0.029 0.049 0.033 0.038 0.027 0.054 Swansea City 0.018 0.053 0.024 0.048 0.028 0.057 0.047 0.019 0.026 0.064 Tottenham Hotspur 0.141 0.018 0.233 0.011 0.261 0.011 0.047 0.019 0.059 0.016 Watford 0.017 0.061 0.025 0.044 0.029 0.050 0.060 0.015 0.026 0.071 West Bromwich Albion 0.014 0.110 0.020 0.144 0.022 0.184 0.026 0.156 0.024 0.119 West Ham United 0.081 0.020 0.052 0.016 0.048 0.021 0.039 0.025 0.036 0.027 PL 15-16 V7 V8 V9 V10 V11 P.max P.min P.max P.min P.max P.min P.max P.min P.max P.min Arsenal 0.222 0.013 0.214 0.013 0.046 0.023 0.027 0.041 0.067 0.021 Aston Villa 0.019 0.077 0.017 0.134 0.044 0.024 0.031 0.033 0.104 0.018 Bournemouth 0.021 0.058 0.019 0.086 0.026 0.088 0.027 0.041 0.032 0.032 Chelsea 0.016 0.205 0.023 0.043 0.051 0.021 0.052 0.023 0.019 0.111 Crystal Palace 0.030 0.028 0.021 0.058 0.051 0.021 0.019 0.094 0.047 0.024 Everton 0.090 0.016 0.026 0.034 0.060 0.019 0.030 0.034 0.019 0.123 Leicester City 0.027 0.032 0.069 0.017 0.030 0.048 0.196 0.016 0.217 0.016 Liverpool 0.055 0.019 0.030 0.029 0.023 0.183 0.203 0.016 0.021 0.071 Manchester City 0.046 0.020 0.099 0.015 0.025 0.123 0.030 0.034 0.030 0.035 Manchester United 0.023 0.046 0.214 0.013 0.026 0.088 0.038 0.027 0.026 0.045 Newcastle United 0.018 0.106 0.021 0.058 0.043 0.025 0.054 0.022 0.033 0.031 Norwich City 0.027 0.032 0.016 0.204 0.033 0.039 0.016 0.208 0.017 0.216 Southampton 0.034 0.025 0.035 0.024 0.028 0.065 0.027 0.039 0.052 0.023 Stoke City 0.017 0.150 0.026 0.034 0.050 0.021 0.027 0.040 0.024 0.053 Sunderland 0.025 0.038 0.019 0.086 0.265 0.011 0.041 0.026 0.023 0.056 Swansea City 0.039 0.022 0.023 0.043 0.047 0.022 0.019 0.116 0.041 0.026 Tottenham Hotspur 0.121 0.015 0.042 0.021 0.026 0.096 0.063 0.021 0.033 0.031 Watford 0.023 0.046 0.030 0.029 0.050 0.021 0.055 0.022 0.098 0.019 West Bromwich Albion 0.025 0.038 0.030 0.029 0.037 0.031 0.019 0.107 0.058 0.022 West Ham United 0.121 0.015 0.030 0.029 0.039 0.029 0.027 0.040 0.038 0.028 PL 15-16 V12 V13 V20 V21 V6 P.max P.min P.max P.min P.max P.min P.max P.min P.max P.min Arsenal 0.025 0.075 0.026 0.080 0.044 0.030 0.204 0.014 0.030 0.044 Arsenal 0.035 0.033 0.035 0.029 0.099 0.021 0.023 0.041 0.037 0.035 Bournemouth 0.032 0.036 0.046 0.021 0.031 0.043 0.034 0.025 0.029 0.045 Chelsea 0.022 0.139 0.024 0.149 0.045 0.029 0.081 0.017 0.027 0.051 Crystal Palace 0.034 0.034 0.035 0.029 0.046 0.029 0.018 0.080 0.214 0.019 Everton 0.037 0.030 0.038 0.027 0.024 0.075 0.041 0.022 0.034 0.037 Leicester City 0.045 0.025 0.043 0.022 0.215 0.017 0.017 0.102 0.031 0.042 Liverpool 0.026 0.061 0.025 0.111 0.067 0.023 0.085 0.017 0.034 0.038 Manchester City 0.031 0.039 0.044 0.022 0.039 0.032 0.131 0.015 0.062 0.026 Manchester United 0.020 0.199 0.023 0.171 0.022 0.119 0.102 0.016 0.035 0.037 Newcastle United 0.031 0.039 0.032 0.038 0.025 0.068 0.022 0.044 0.033 0.039 Norwich City 0.138 0.016 0.264 0.010 0.024 0.077 0.020 0.056 0.042 0.031 Southampton 0.060 0.021 0.043 0.023 0.045 0.029 0.025 0.034 0.183 0.020 Stoke City 0.023 0.094 0.027 0.064 0.036 0.036 0.028 0.030 0.022 0.077 Sunderland 0.241 0.014 0.061 0.017 0.039 0.033 0.016 0.146 0.017 0.239 Swansea City 0.048 0.023 0.052 0.018 0.019 0.206 0.044 0.021 0.027 0.050 Tottenham Hotspur 0.046 0.024 0.056 0.018 0.028 0.052 0.052 0.019 0.028 0.049 Watford 0.031 0.041 0.025 0.114 0.049 0.027 0.020 0.055 0.024 0.063 West Bromwich Albion 0.037 0.030 0.048 0.020 0.040 0.032 0.015 0.201 0.052 0.028 West Ham United 0.039 0.029 0.054 0.018 0.063 0.024 0.022 0.045 0.039 0.033 PL 15-16 V14 V15 V16 V17 V18 P.max P.min P.max P.min P.max P.min P.max P.min P.max P.min Arsenal 0.067 0.021 0.025 0.075 0.026 0.080 0.021 0.138 0.025 0.050 Arsenal 0.104 0.018 0.035 0.033 0.035 0.029 0.246 0.009 0.235 0.014 Bournemouth 0.032 0.032 0.032 0.036 0.046 0.021 0.091 0.012 0.050 0.022 Chelsea 0.019 0.111 0.022 0.139 0.024 0.149 0.036 0.022 0.042 0.024 Crystal Palace 0.047 0.024 0.034 0.034 0.035 0.029 0.033 0.024 0.042 0.024 Everton 0.019 0.123 0.037 0.030 0.038 0.027 0.039 0.019 0.050 0.022 Leicester City 0.217 0.016 0.045 0.025 0.043 0.022 0.021 0.138 0.018 0.213 Liverpool 0.021 0.071 0.026 0.061 0.025 0.111 0.032 0.026 0.063 0.019 Manchester City 0.030 0.035 0.031 0.039 0.044 0.022 0.024 0.064 0.025 0.050 Manchester United 0.026 0.045 0.020 0.199 0.023 0.171 0.020 0.161 0.019 0.147 Newcastle United 0.033 0.031 0.031 0.039 0.032 0.038 0.075 0.013 0.028 0.040 Norwich City 0.017 0.216 0.138 0.016 0.264 0.010 0.091 0.012 0.042 0.024 Southampton 0.052 0.023 0.060 0.021 0.043 0.023 0.024 0.064 0.031 0.033 Stoke City 0.024 0.053 0.023 0.094 0.027 0.064 0.039 0.019 0.021 0.098 Sunderland 0.023 0.056 0.241 0.014 0.061 0.017 0.059 0.014 0.031 0.033 Swansea City 0.041 0.026 0.048 0.023 0.052 0.018 0.034 0.023 0.031 0.033 Tottenham Hotspur 0.033 0.031 0.046 0.024 0.056 0.018 0.020 0.161 0.028 0.040 Watford 0.098 0.019 0.031 0.041 0.025 0.114 0.032 0.026 0.031 0.033 West Bromwich Albion 0.058 0.022 0.037 0.030 0.048 0.020 0.029 0.030 0.022 0.068 West Ham United 0.038 0.028 0.039 0.029 0.054 0.018 0.033 0.024 0.168 0.015 PL 15-16 V19 V20 V21 V22 V23 P.max P.min P.max P.min P.max P.min P.max P.min P.max P.min Arsenal 0.051 0.014 0.014 0.243 0.047 0.020 0.025 0.048 0.051 0.023 Arsenal 0.103 0.011 0.197 0.019 0.031 0.026 0.046 0.026 0.014 0.229 Bournemouth 0.020 0.156 0.023 0.050 0.018 0.081 0.016 0.197 0.023 0.043 Chelsea 0.034 0.022 0.029 0.036 0.092 0.016 0.062 0.023 0.066 0.021 Crystal Palace 0.103 0.011 0.033 0.033 0.023 0.040 0.065 0.022 0.039 0.026 Everton 0.025 0.044 0.016 0.128 0.092 0.016 0.016 0.218 0.018 0.079 Leicester City 0.020 0.156 0.019 0.078 0.031 0.026 0.026 0.044 0.016 0.119 Liverpool 0.025 0.044 0.036 0.031 0.031 0.026 0.067 0.022 0.071 0.020 Manchester City 0.025 0.044 0.036 0.031 0.015 0.203 0.048 0.025 0.022 0.049 Manchester United 0.034 0.022 0.050 0.026 0.018 0.081 0.208 0.017 0.031 0.031 Newcastle United 0.034 0.022 0.033 0.033 0.092 0.016 0.031 0.035 0.020 0.061 Norwich City 0.034 0.022 0.036 0.031 0.031 0.026 0.026 0.046 0.084 0.020 Southampton 0.020 0.156 0.028 0.038 0.220 0.013 0.028 0.040 0.131 0.018 Stoke City 0.020 0.156 0.021 0.058 0.047 0.020 0.028 0.040 0.204 0.016 Sunderland 0.025 0.044 0.045 0.027 0.023 0.040 0.037 0.030 0.058 0.022 Swansea City 0.255 0.008 0.033 0.033 0.018 0.081 0.027 0.043 0.041 0.025 Tottenham Hotspur 0.051 0.014 0.125 0.021 0.015 0.203 0.057 0.023 0.028 0.034 Watford 0.034 0.022 0.146 0.020 0.031 0.026 0.126 0.019 0.017 0.101 West Bromwich Albion 0.051 0.014 0.050 0.026 0.031 0.026 0.037 0.030 0.025 0.039 West Ham United 0.034 0.022 0.029 0.036 0.092 0.016 0.024 0.052 0.041 0.025 Observation: Goals Conceded (V17), Errors Leading to Goal (V18), Own Goals (V19), Yellow Cards (V20), Red Cards (V21), Fouls (V22) and Offside (V23) are variables that have a negative impact, therefore a lower value is better for the team. to V Appendix V - CPP 3rd stage results Composition. Compositions of Dimensions PP Goals PP Offensive PP Defensive PO Composition PP Rank PO Goals PO Offensive PO Defensive PO Composition PO Rank Arsenal 2.19E-10 3.67E-05 5.62E-15 3.67E-05 1 5.14E-01 4.45E-01 5.85E-01 8.88E-01 2 Aston Villa 3.94E-15 4.24E-06 9.01E-17 4.24E-06 6 1.28E-01 2.90E-01 3.78E-01 6.15E-01 13 Bournemouth 4.55E-13 1.00E-06 6.03E-16 1.00E-06 14 2.85E-01 1.23E-01 4.58E-01 6.60E-01 10 Chelsea 4.98E-13 1.57E-06 1.78E-17 1.57E-06 11 2.22E-01 1.55E-01 3.09E-01 5.45E-01 18 Crystal Palace 1.10E-13 3.18E-06 4.48E-17 3.18E-06 8 1.88E-01 2.72E-01 3.19E-01 5.98E-01 14 Everton 3.73E-12 6.00E-06 5.56E-16 6.00E-06 4 2.88E-01 1.93E-01 4.94E-01 7.09E-01 7 Leicester City 7.58E-09 7.32E-06 1.09E-13 7.32E-06 3 6.82E-01 2.58E-01 6.62E-01 9.20E-01 1 Liverpool 2.11E-11 2.57E-06 6.09E-16 2.57E-06 10 3.71E-01 1.72E-01 5.54E-01 7.68E-01 5 Manchester City 4.81E-10 1.68E-05 1.59E-15 1.68E-05 2 4.82E-01 2.58E-01 4.92E-01 8.05E-01 4 Manchester United 6.24E-12 3.47E-06 7.36E-17 3.47E-06 7 3.87E-01 1.87E-01 4.31E-01 7.16E-01 6 Newcastle United 8.27E-14 1.16E-06 1.67E-17 1.16E-06 13 1.81E-01 1.35E-01 2.97E-01 5.02E-01 20 Norwich City 4.17E-14 4.20E-07 1.11E-16 4.20E-07 18 1.63E-01 1.03E-01 4.99E-01 6.24E-01 12 Southampton 2.26E-11 4.32E-06 9.03E-17 4.32E-06 5 3.67E-01 2.58E-01 3.42E-01 6.91E-01 9 Stoke City 2.35E-12 3.63E-07 1.89E-17 3.63E-07 19 3.45E-01 9.84E-02 3.02E-01 5.88E-01 15 Sunderland 2.71E-13 1.62E-07 2.50E-15 1.62E-07 20 2.04E-01 7.96E-02 5.92E-01 7.02E-01 8 Swansea City 1.42E-13 7.88E-07 1.45E-16 7.88E-07 15 2.01E-01 1.17E-01 3.61E-01 5.49E-01 17 Tottenham Hotspur 4.45E-09 2.84E-06 1.54E-15 2.85E-06 9 6.76E-01 1.61E-01 4.90E-01 8.62E-01 3 Watford 2.97E-13 1.26E-06 9.27E-17 1.26E-06 12 2.11E-01 1.62E-01 3.59E-01 5.77E-01 16 West Bromwich Albion 1.12E-13 7.25E-07 4.45E-17 7.25E-07 17 1.99E-01 1.24E-01 3.18E-01 5.22E-01 19 West Ham United 7.61E-12 7.64E-07 1.67E-16 7.64E-07 16 3.42E-01 1.16E-01 3.56E-01 6.25E-01 11 Arsenal 7.17E-01 8.86E-01 6.74E-01 9.89E-01 5 1 0.999999693 1 1.00 1 Aston Villa 2.34E-01 7.51E-01 4.92E-01 9.03E-01 20 0.999999781 0.999996423 1 1.00 1 Bournemouth 6.75E-01 8.12E-01 6.44E-01 9.78E-01 11 1 0.999997198 1 1.00 1 Chelsea 6.45E-01 8.46E-01 4.70E-01 9.71E-01 14 1 0.999998369 1 1.00 1 Crystal Palace 6.86E-01 8.38E-01 6.25E-01 9.81E-01 10 1 0.999997994 1 1.00 1 Everton 7.91E-01 9.09E-01 6.03E-01 9.92E-01 4 1 0.999999748 1 1.00 1 Leicester City 8.50E-01 8.36E-01 7.61E-01 9.94E-01 2 1 0.999999136 1 1.00 1 Liverpool 7.65E-01 8.61E-01 5.10E-01 9.84E-01 7 1 0.999999085 1 1.00 1 Manchester City 8.52E-01 9.19E-01 6.53E-01 9.96E-01 1 1 0.999999821 1 1.00 1 Manchester United 7.40E-01 8.88E-01 3.52E-01 9.81E-01 9 1 0.999999393 1 1.00 1 Newcastle United 6.05E-01 8.43E-01 5.60E-01 9.73E-01 13 1 0.99999786 1 1.00 1 Norwich City 5.51E-01 7.72E-01 3.39E-01 9.32E-01 18 1 0.999988473 1 1.00 1 Southampton 8.08E-01 8.08E-01 5.61E-01 9.84E-01 8 1 0.999998459 1 1.00 1 Stoke City 6.22E-01 6.94E-01 5.29E-01 9.45E-01 17 1 0.999987234 1 1.00 1 Sunderland 7.16E-01 5.79E-01 6.68E-01 9.60E-01 16 1 0.999891385 1 1.00 1 Swansea City 5.69E-01 8.35E-01 5.47E-01 9.68E-01 15 1 0.999997242 1 1.00 1 Tottenham Hotspur 8.39E-01 8.92E-01 6.11E-01 9.93E-01 3 1 0.999999572 1 1.00 1 Watford 7.26E-01 8.09E-01 5.27E-01 9.75E-01 12 1 0.99999583 1 1.00 1 West Bromwich Albion 4.54E-01 6.68E-01 6.20E-01 9.31E-01 19 0.999999999 0.999983557 1 1.00 1 West Ham United 7.04E-01 8.62E-01 6.88E-01 9.87E-01 6 1 0.999998354 1 1.00 1 list the joint probabilities Mij and mij and the final scores, according to points of view described in the Table 1.
Triangular distributions were used in CPP and TFN in the fuzzy MCDA methods, as depicted in Section 2.2. The triangular distribution is a fair approximation to support decision-making in cases where the lowest, highest, and most likely values are available to describe the behavior of a random variable TFN, on the other side, are the most natural way to fuzzify exact measurements.
Both fuzzy methods were modeled in R language and the computations employed the R package “FuzzyMCDM”.
3 RESULTS AND DISCUSSION
The rankings derived from probabilistic scores are presented in Table 4 for FA Premier League 2015/2016 season. The scores were initially calculated based on the 23 variables taken together and then for the groups of variables.
These global scores represent the probabilities of having the largest value in all variables, corresponding to the pessimistic progressive point of view. The decision maker in the pessimistic progressive (PP) point of view pays attention to maximizing the probabilities of preference according to all the criteria examined. The progressive decision maker pays greater attention to small differences between the best values; in sports, this reflects the idea that the teams are oriented to seek the victory in the game. The conservative decision maker is associated with the idea of avoiding losses, which in football is important for the teams avoiding relegation.
The data base was also submitted to the Fuzzy MULTIMOORA and Fuzzy VIKOR methods. The results are also described in Table 4. The correlation between the Premier League Official ranking of the 2015-2016 season and the three MCDM methods is presented in Table 5.
The present study discusses the perspective of multiple criteria addressing the technical performance of FA Premier League teams. It was expected that the present study would improve the understanding of teams’ performance depicted by final 2015/2016 FA Premiere League standings. In Table 5, these standings are compared to rankings derived from the numerical variables assessing the specific performances in the matches.
The top four teams, qualifying for the Champions League, are the same teams in the same order, whether ranking by points conquered or by CPP. The other methods bring small differences. Fuzzy MMOORA presents a small change in rank and Fuzzy Vikor includes Everton in the fourth position in its ranking.
In regard to relegation, the probabilistic approach is also reliable in reflecting the reality of clubs. The numbers of Newcastle United, Norwich City and Aston Villa were the worst, as reflected in the final league table (relegated to Football League Championship) and when analyzed by the CPP method. The other methods were not able to arrive at such a close adequacy in relation to PL Official Rank.
For the teams in the intermediate group, a comparison is more difficult because these teams form a more homogeneous group, so that small differences in the variables affect the ranks. There is a difference of only 1 point between the teams placed from fifth to tenth and between the 11th and 17th the maximum difference was of only three points. A global comparison may be done using Kendall and Spearman correlation coefficients.
The correlation indices between the Premier League Official and the CPP ranking are higher and reveal the adequacy of this method to the context. It is important to remark that one method cannot here be considered better than another because, despite the graphical resemblance, CPP and Fuzzy MCDA methods embody different concepts. The interpretation of CPP may be easier because uncertainty is directly modeled by CPP. One possible reason for the higher correlation found for the CPP results may be that the use of a density function takes into account in the computations the probabilities of all values while the computation based on TFN takes into account effectively only the central and extreme values. In fact, the CPP algorithm considers all values distributed by a probabilistic law. On the other hand, the fuzzy logic algorithm simplifies computation by prioritizing minimum or maximum values of a fuzzy number, thus excluding information considered in the probabilistic method. In what might seem paradoxical for methods applied to uncertain contexts, precision may have made a difference.
Thus, by the probabilistic method of CPP, a multiple criteria vision is obtained which takes into account variables expected to partially determine match results. This demonstrates that the 23 variables collected by the FA Premier League website are suitable to distinguish winning teams from losing teams.
In a second analysis, CPP was employed to analyze the teams’ performances by the three GV described in Table 3. For each group, a PP point of view is represented in Table 6 and a CP point of view is represented in Table 8. A global score is obtained in both tables by combining the GV results by a PO point of view. This approach was proposed by Sant’Anna (201545 SANT’ANNA AP. 2015. Probabilistic Composition of Preferences, Theory and Applications., p. 40-41) and assumes that a good performance in at least one group of variables may be enough to determine a good global performance. A pessimistic composition of the three GV scores would lead to the same global scores of the PP combination of the 23 variables as a unique group.
To obtain information on which kind of variables are more important, Table 6 presents the correlation between each variable group and the 2015/2016 Premier League Final Rank.
Table 6 shows that the group of variables GV1 presents the best correlation with the final standings. This correlation is even higher than that obtained with the 23 variables as shown in Table 6. This leads to the idea that, in a football match, the most important is to make goals, no matter how much score opportunities can be built or disarmed. What matters is the number of effective actions that contribute to directly score a goal.
In Table 6, the observer may analyze the probability of each team being better than its opponents in all the criteria of each group separately. Here, three of the four clubs that guaranteed access to dispute the Champions League in 2016/2017 appear as the top 3 of the rank.
It is interesting to notice that Tottenham Hotspur occupies the ninth position in this rank, which demonstrates the instability of the team throughout its campaign this season. It appears in ninth position in the offensive phase and in the fifth position in the defensive phase, which results in a lower rank in this analysis than those presented in Appendices III Appendix III - CPP 3rd stage results GV2. GV1 PP PP Rank PO PO Rank CP CP Rank CO CO Rank Arsenal 3.666E-05 1 4.446E-01 1 8.861E-01 5 0.999999692650327 3 Aston Villa 4.236E-06 6 2.902E-01 2 7.509E-01 17 0.999996422713184 15 Bournemouth 1.003E-06 14 1.234E-01 15 8.121E-01 13 0.999997197567777 14 Chelsea 1.567E-06 11 1.547E-01 12 8.464E-01 8 0.999998368503557 9 Crystal Palace 3.184E-06 8 2.722E-01 3 8.378E-01 10 0.999997994219116 11 Everton 6.003E-06 4 1.934E-01 7 9.088E-01 2 0.999999748096891 2 Leicester City 7.315E-06 3 2.579E-01 5 8.357E-01 11 0.999999136470623 6 Liverpool 2.567E-06 10 1.716E-01 9 8.609E-01 7 0.999999084912791 7 Manchester City 1.678E-05 2 2.577E-01 6 9.187E-01 1 0.999999820804166 1 Manchester United 3.467E-06 7 1.868E-01 8 8.878E-01 4 0.999999393016960 5 Newcastle United 1.160E-06 13 1.351E-01 13 8.432E-01 9 0.999997859757944 12 Norwich City 4.203E-07 18 1.031E-01 18 7.723E-01 16 0.999988473080744 17 Southampton 4.320E-06 5 2.584E-01 4 8.081E-01 15 0.999998458732760 8 Stoke City 3.627E-07 19 9.842E-02 19 6.935E-01 18 0.999987233705528 18 Sunderland 1.617E-07 20 7.961E-02 20 5.794E-01 20 0.999891385142310 20 Swansea City 7.880E-07 15 1.170E-01 16 8.348E-01 12 0.999997241864082 13 Tottenham Hotspur 2.844E-06 9 1.615E-01 11 8.922E-01 3 0.999999572365489 4 Watford 1.262E-06 12 1.622E-01 10 8.087E-01 14 0.999995829855388 16 West Bromwich Albion 7.255E-07 17 1.241E-01 14 6.676E-01 19 0.999983557029980 19 West Ham United 7.643E-07 16 1.163E-01 17 8.615E-01 6 0.999998353540662 10 and IV Appendix IV - CPP 3rd stage results GV3. GV1 PP PP Rank PO PO Rank CP CP Rank CO CO Rank Arsenal 5.624E-15 2 5.850E-01 3 6.735E-01 3 1.000000000000000 1 Aston Villa 9.014E-17 14 3.777E-01 11 4.917E-01 17 0.999999999999999 13 Bournemouth 6.031E-16 7 4.575E-01 9 6.439E-01 6 1.000000000000000 1 Chelsea 1.784E-17 19 3.086E-01 18 4.705E-01 18 0.999999999999996 18 Crystal Palace 4.481E-17 16 3.194E-01 16 6.254E-01 7 1.000000000000000 1 Everton 5.558E-16 8 4.938E-01 6 6.033E-01 10 1.000000000000000 1 Leicester City 1.088E-13 1 6.616E-01 1 7.614E-01 1 1.000000000000000 1 Liverpool 6.094E-16 6 5.541E-01 4 5.099E-01 16 0.999999999999999 13 Manchester City 1.586E-15 4 4.917E-01 7 6.530E-01 5 1.000000000000000 1 Manchester United 7.361E-17 15 4.308E-01 10 3.521E-01 19 0.999999999999972 20 Newcastle United 1.666E-17 20 2.966E-01 20 5.603E-01 12 0.999999999999999 13 Norwich City 1.107E-16 11 4.990E-01 5 3.392E-01 20 0.999999999999984 19 Southampton 9.027E-17 13 3.416E-01 15 5.615E-01 11 1.000000000000000 1 Stoke City 1.887E-17 18 3.017E-01 19 5.291E-01 14 0.999999999999998 17 Sunderland 2.496E-15 3 5.924E-01 2 6.679E-01 4 1.000000000000000 1 Swansea City 1.453E-16 10 3.615E-01 12 5.467E-01 13 1.000000000000000 1 Tottenham Hotspur 1.544E-15 5 4.903E-01 8 6.113E-01 9 1.000000000000000 1 Watford 9.272E-17 12 3.594E-01 13 5.271E-01 15 0.999999999999999 13 West Bromwich Albion 4.454E-17 17 3.185E-01 17 6.201E-01 8 1.000000000000000 1 West Ham United 1.673E-16 9 3.556E-01 14 6.878E-01 2 1.000000000000000 1 . Its superior performance with respect to the variables in the goals scored group, presented in Appendix II Appendix II - CPP 3rd stage results GV1. GV1 PP PP Rank PO PO Rank CP CP Rank CO CO Rank Arsenal 2.187E-10 4 5.136E-01 3 7.168E-01 9 0.999999999999741 5 Aston Villa 3.942E-15 20 1.281E-01 20 2.343E-01 20 0.999999780962030 20 Bournemouth 4.550E-13 12 2.853E-01 11 6.749E-01 13 0.999999999985799 15 Chelsea 4.978E-13 11 2.218E-01 12 6.452E-01 14 0.999999999996882 11 Crystal Palace 1.099E-13 17 1.881E-01 17 6.859E-01 12 0.999999999992223 13 Everton 3.727E-12 9 2.881E-01 10 7.913E-01 5 0.999999999999696 7 Leicester City 7.584E-09 1 6.816E-01 1 8.499E-01 2 0.999999999999983 1.5 Liverpool 2.108E-11 6 3.709E-01 6 7.652E-01 6 0.999999999999706 6 Manchester City 4.814E-10 3 4.824E-01 4 8.523E-01 1 0.999999999999981 3 Manchester United 6.244E-12 8 3.874E-01 5 7.401E-01 7 0.999999999997944 9 Newcastle United 8.274E-14 18 1.810E-01 18 6.049E-01 16 0.999999999942001 17 Norwich City 4.170E-14 19 1.626E-01 19 5.506E-01 18 0.999999999766941 18 Southampton 2.264E-11 5 3.673E-01 7 8.077E-01 4 0.999999999999803 4 Stoke City 2.345E-12 10 3.449E-01 8 6.219E-01 15 0.999999999985841 14 Sunderland 2.710E-13 14 2.043E-01 14 7.159E-01 10 0.999999999994008 12 Swansea City 1.416E-13 15 2.008E-01 15 5.686E-01 17 0.999999999983690 16 Tottenham Hotspur 4.452E-09 2 6.761E-01 2 8.395E-01 3 0.999999999999983 1.5 Watford 2.973E-13 13 2.111E-01 13 7.262E-01 8 0.999999999996923 10 West Bromwich Albion 1.121E-13 16 1.993E-01 16 4.545E-01 19 0.999999999416289 19 West Ham United 7.610E-12 7 3.423E-01 9 7.042E-01 11 0.999999999999514 8 - where it can be seen that Tottenham Hotspur occupies a second position with 1.82 goals per match - kept the team disputing the championship until the final rounds, but was not enough to grant it a better final rank under this point of view.
Other teams that call for analysis are Everton, which appears in the PP rank in the fourth position, Southampton, appearing in fifth position and the relegated Aston Villa, in the sixth position. All these three teams presented an interesting offensive organization, with passing accuracy of 78% to 81% and more than 400 passes per match.
Everton showed a median campaign this season, with 11 wins, 14 draws and 13 losses, demonstrated through its PP rank in ninth position in GV1, fourth position in GV2 and eighth position in GV3. In a closer look at the variables the difference of 0.10 between goals scored per match and goals conceded per match will call attention. The balance between making and conceding goals may be a problem to be more deeply investigated by the managers of this club.
In another case, the problems that Southampton presented in its defensive line are registered by its PP rank in thirteenth position. The team is among the top 5 teams in the PP rank for both the offensive phase and construction of goals. With 18 victories, 9 draws and 11 defeats, Southampton ended the competition in sixth place, 3 points behind the fourth team.
Aston Villa is an extreme case. It had its major problems in defense with an impressive number of 2 goals conceded per match. Its construction of goals was obtained with only 0.71 goals per match, ending the competition with a goal difference of minus 49.
The irregularity of Chelsea’s season may also be highlighted here, though its performance in Table 5 with respect to each group of variables is similar. A deeper analysis may reveal a large variability within the variables within the groups, primarily in the defensive phase. The numbers are very close to or worse than those of the relegated teams this season. This poor performance caused the team to change its coach and players during the season in such a way to improve its median campaign.
When the decision maker aims to differentiate alternatives near to worst performance by the idea of avoiding losses and, possibly, relegation, the CP point of view is the more adequate. In this case, none of the correlations presented in Table 8 shows a better performance than that obtained by CPP with the 23 variables. What shows that none of the groups of variables within a conservative view has a strong effect to the 2015/2016 Premier League Final Rank.
In Table 8, attention should be focused on those teams that wanted to avoid relegation. When we combine the conservative pessimistic GV scores, Newcastle United is not found among the possible candidates for relegation. Newcastle United, even with good construction in the offensive phase and being in a ninth position in this group of variables, was not successful in goal conversions, with just 1.16 goals per game and 1.71 goals conceded per match. Fundamentally, in football, goals are required. Of the last 24 available points, Newcastle United only managed to conquer 2 points, which determined the destiny of the team at the end of the season.
West Bromwich Albion was not relegated from the FA Premier League, but, when the variable groups GV1, GV2 and GV3 are analyzed, it appears in the nineteenth position in the CP Rank. This specially demonstrates the fragility of the team during the competition in building their offensive phase, totaling only 10 wins and a goal difference of −14 at the end of competition. This team also demonstrated inefficiency in its defense, with 1.26 goals conceded per match, which exceeds its mark of 0.89 goals scored per match. When analyzed from the CP point of view, West Bromwich Albion could not be better in the variables of GV1 and GV2 groups than other teams presented in Appendices II Appendix II - CPP 3rd stage results GV1. GV1 PP PP Rank PO PO Rank CP CP Rank CO CO Rank Arsenal 2.187E-10 4 5.136E-01 3 7.168E-01 9 0.999999999999741 5 Aston Villa 3.942E-15 20 1.281E-01 20 2.343E-01 20 0.999999780962030 20 Bournemouth 4.550E-13 12 2.853E-01 11 6.749E-01 13 0.999999999985799 15 Chelsea 4.978E-13 11 2.218E-01 12 6.452E-01 14 0.999999999996882 11 Crystal Palace 1.099E-13 17 1.881E-01 17 6.859E-01 12 0.999999999992223 13 Everton 3.727E-12 9 2.881E-01 10 7.913E-01 5 0.999999999999696 7 Leicester City 7.584E-09 1 6.816E-01 1 8.499E-01 2 0.999999999999983 1.5 Liverpool 2.108E-11 6 3.709E-01 6 7.652E-01 6 0.999999999999706 6 Manchester City 4.814E-10 3 4.824E-01 4 8.523E-01 1 0.999999999999981 3 Manchester United 6.244E-12 8 3.874E-01 5 7.401E-01 7 0.999999999997944 9 Newcastle United 8.274E-14 18 1.810E-01 18 6.049E-01 16 0.999999999942001 17 Norwich City 4.170E-14 19 1.626E-01 19 5.506E-01 18 0.999999999766941 18 Southampton 2.264E-11 5 3.673E-01 7 8.077E-01 4 0.999999999999803 4 Stoke City 2.345E-12 10 3.449E-01 8 6.219E-01 15 0.999999999985841 14 Sunderland 2.710E-13 14 2.043E-01 14 7.159E-01 10 0.999999999994008 12 Swansea City 1.416E-13 15 2.008E-01 15 5.686E-01 17 0.999999999983690 16 Tottenham Hotspur 4.452E-09 2 6.761E-01 2 8.395E-01 3 0.999999999999983 1.5 Watford 2.973E-13 13 2.111E-01 13 7.262E-01 8 0.999999999996923 10 West Bromwich Albion 1.121E-13 16 1.993E-01 16 4.545E-01 19 0.999999999416289 19 West Ham United 7.610E-12 7 3.423E-01 9 7.042E-01 11 0.999999999999514 8 and III Appendix III - CPP 3rd stage results GV2. GV1 PP PP Rank PO PO Rank CP CP Rank CO CO Rank Arsenal 3.666E-05 1 4.446E-01 1 8.861E-01 5 0.999999692650327 3 Aston Villa 4.236E-06 6 2.902E-01 2 7.509E-01 17 0.999996422713184 15 Bournemouth 1.003E-06 14 1.234E-01 15 8.121E-01 13 0.999997197567777 14 Chelsea 1.567E-06 11 1.547E-01 12 8.464E-01 8 0.999998368503557 9 Crystal Palace 3.184E-06 8 2.722E-01 3 8.378E-01 10 0.999997994219116 11 Everton 6.003E-06 4 1.934E-01 7 9.088E-01 2 0.999999748096891 2 Leicester City 7.315E-06 3 2.579E-01 5 8.357E-01 11 0.999999136470623 6 Liverpool 2.567E-06 10 1.716E-01 9 8.609E-01 7 0.999999084912791 7 Manchester City 1.678E-05 2 2.577E-01 6 9.187E-01 1 0.999999820804166 1 Manchester United 3.467E-06 7 1.868E-01 8 8.878E-01 4 0.999999393016960 5 Newcastle United 1.160E-06 13 1.351E-01 13 8.432E-01 9 0.999997859757944 12 Norwich City 4.203E-07 18 1.031E-01 18 7.723E-01 16 0.999988473080744 17 Southampton 4.320E-06 5 2.584E-01 4 8.081E-01 15 0.999998458732760 8 Stoke City 3.627E-07 19 9.842E-02 19 6.935E-01 18 0.999987233705528 18 Sunderland 1.617E-07 20 7.961E-02 20 5.794E-01 20 0.999891385142310 20 Swansea City 7.880E-07 15 1.170E-01 16 8.348E-01 12 0.999997241864082 13 Tottenham Hotspur 2.844E-06 9 1.615E-01 11 8.922E-01 3 0.999999572365489 4 Watford 1.262E-06 12 1.622E-01 10 8.087E-01 14 0.999995829855388 16 West Bromwich Albion 7.255E-07 17 1.241E-01 14 6.676E-01 19 0.999983557029980 19 West Ham United 7.643E-07 16 1.163E-01 17 8.615E-01 6 0.999998353540662 10 . Thus, even presenting an average performance in GV3, presented in Appendix IV Appendix IV - CPP 3rd stage results GV3. GV1 PP PP Rank PO PO Rank CP CP Rank CO CO Rank Arsenal 5.624E-15 2 5.850E-01 3 6.735E-01 3 1.000000000000000 1 Aston Villa 9.014E-17 14 3.777E-01 11 4.917E-01 17 0.999999999999999 13 Bournemouth 6.031E-16 7 4.575E-01 9 6.439E-01 6 1.000000000000000 1 Chelsea 1.784E-17 19 3.086E-01 18 4.705E-01 18 0.999999999999996 18 Crystal Palace 4.481E-17 16 3.194E-01 16 6.254E-01 7 1.000000000000000 1 Everton 5.558E-16 8 4.938E-01 6 6.033E-01 10 1.000000000000000 1 Leicester City 1.088E-13 1 6.616E-01 1 7.614E-01 1 1.000000000000000 1 Liverpool 6.094E-16 6 5.541E-01 4 5.099E-01 16 0.999999999999999 13 Manchester City 1.586E-15 4 4.917E-01 7 6.530E-01 5 1.000000000000000 1 Manchester United 7.361E-17 15 4.308E-01 10 3.521E-01 19 0.999999999999972 20 Newcastle United 1.666E-17 20 2.966E-01 20 5.603E-01 12 0.999999999999999 13 Norwich City 1.107E-16 11 4.990E-01 5 3.392E-01 20 0.999999999999984 19 Southampton 9.027E-17 13 3.416E-01 15 5.615E-01 11 1.000000000000000 1 Stoke City 1.887E-17 18 3.017E-01 19 5.291E-01 14 0.999999999999998 17 Sunderland 2.496E-15 3 5.924E-01 2 6.679E-01 4 1.000000000000000 1 Swansea City 1.453E-16 10 3.615E-01 12 5.467E-01 13 1.000000000000000 1 Tottenham Hotspur 1.544E-15 5 4.903E-01 8 6.113E-01 9 1.000000000000000 1 Watford 9.272E-17 12 3.594E-01 13 5.271E-01 15 0.999999999999999 13 West Bromwich Albion 4.454E-17 17 3.185E-01 17 6.201E-01 8 1.000000000000000 1 West Ham United 1.673E-16 9 3.556E-01 14 6.878E-01 2 1.000000000000000 1 , it appears between the teams that would have been relegated. Thus, its board should be attentive to improving these numbers next season, primarily in their offensive construction and goal conversion.
Combining analyses performed from a CP point of view through an optimistic perspective, the analysis depicted in Table 8 shows the reality of clubs who wish to stay in the elite of English Football, where they want to be better in each of the groups of variables presented. However, long term experience seems to indicate that teams fighting to avoid relegation should care about overall excellence and not only seeking to be better in one group of variables.
4 CONCLUSION
The purpose of this study was to explore football match related statistics in the Premier League for last season (2015/2016). Three different methods, Composition of Probabilistic Preferences (CPP), Fuzzy Multimoora Method and Fuzzy Vikor Method were employed to determine if it is possible to distinguish winning teams from losing teams on the basis of 23 performance indicators. On this point, CPP proved more efficient in predicting the final standings of the championship. The Spearman index for PL Official Rank × CPP Rank is around 0,85 and the Kendall index around 0,69.
The uncertain and imprecise football variables are well modeled by CPP with a triangular density function rather than by TFN. CPP algorithms consider all values of a probabilistic distribution while fuzzy logic, prioritizing minimum or maximum values of a fuzzy number, explores less information.
In addition, CPP analyses based on goals scored, attack phase and defensive phase from different points of view were performed. By this way, the effects of technical performance of the teams at each moment of a football match may be better understood. Thus, information is gathered to help in-depth understanding each phase of the game for different decision maker’s points of view.
Evidence was found that the variables in the group GV1, related to the final offensive steps of the team, presents a better correlation with the premier League final rank. This means that the best strategy would be to prioritize being able to transpose the defense to score goals against the opponent.
Several other issues can be raised. For instance: Are the teams that make more goals always the best? Better offensive performance always results in scoring more? How much the defensive performance improves the chances of winning the matches?
As a practical application, our findings suggest that technical match analyses are an important factor in the evaluation of team performance for the following season. Being able to observe the failures in each phase by the team may drive correction of methods of training or even acquisition of players for an improvement of performance.
Future investigations should attempt to apply CPP during the championship and not only at the end of the season. Useful information might also be gathered by looking at player individual rankings. In that case, CPP should be applied not only to technical performance variables but also to physical performance variables. Furthermore, it would also be interesting to apply CPP to different leagues, to determine if different aspects may be more important in different contexts.
ACKNOWLEDGMENTS
The authors are grateful for two Pesquisa Operacional referees, whose insightful analyses we evaluate that considerably improved the article.
REFERENCES
-
1ALMEIDA TA, YAMAKAMI A & TAKAHASHI MT. 2006. Sistema imunológico artificial para resolver o problema da árvore geradora mínima com parâmetros fuzzy, Pesquisa Operacional, 27(1): 131-154.
-
2ANVARI A, ZULKIFLI N & ARGHISH O. 2014. Application of a modified VIKOR method for decision-making problems in lean tool selection. International Journal of Advanced Manufacturing Technology, 71(5-8): 829-841.
-
3BALEŽENTIS T & BALEŽENTIS A. 2014. A Survey on Development and Applications of the Multicriteria Decision Making Method MULTIMOORA. Journal of Multi-Criteria Decision Analysis, 21(3-4): 209-222.
-
4BESTERS LM, VAN OURS JC & VAN TUIJL MA. 2016. Effectiveness of In-Season Manager Changes in English Premier League Football. De Economist, 164(3): 335-356.
-
5BRADLEY PS, CARLING C, ARCHER D, ROBERTS J, DODDS A, DI MASCIO M & KRUSTRUP P. 2011. The effect of playing formation on high-intensity running and technical profiles in English FA Premier League soccer matches. Journal of Sports Sciences, 29(8): 821-830.
-
6BRAUERS WKM, BALEŽENTIS A & BALEŽENTIS T. 2011. MULTIMOORA for the EU Member States updated with fuzzy number theory. Technological and Economic Development of Economy, 17(2): 259-290.
-
7BRAUERS WKM & ZAVADSKAS EK. 2006. The MOORA method and its application to privatization in a transition economy. Control and Cybernetics, 35(2): 445-469.
-
8BRAUERS WKM & ZAVADSKAS EK. 2010. Project management by MULTIMOORA as an instrument for transition economies. Technological and Economic Development of Economy, 16(1): 5-24.
-
9BRAUERS WKM & ZAVADSKAS EK. 2012a. A multi-objective decision support system for project selection with an application for the Tunisian textile industry. E&M Ekonomie a Management, 15(1): 28-43.
-
10BRAUERS WKM & ZAVADSKAS EK. 2012b. Robustness of MULTIMOORA: A Method for Multi-Objective Optimization. Informatica, 23(1): 1-25.
-
11CARLING C, WILLIAMS AM & REILLY T. 2005. Handbook of soccer Match Analysis. A systematic approach to improving performance.
-
12CASTELLANO J. 2010. Analysis of the possession ball in soccer: frequency, duration and transition. European Journal of Human Movement, 21: 179-196. Retrieved from http://www.eurjhm.com/index.php/eurjhm/article/view/214/401
» http://www.eurjhm.com/index.php/eurjhm/article/view/214/401 -
13CHIODO E & LAURIA D. 2015. Some Basic Properties of the Failure Rate of Redundant Reliability Systems in Industrial Electronics Applications. IEEE Transactions on Industrial Electronics, 62(8): 5055-5062.
-
14DELIGNETTE-MULLER ML & DUTANG C. 2014. Fitdistrplus: An R Package for Fitting Distributions. J. Stat. Softw., 64: 1-34.
-
15DRUST B, ATKINSON G & REILLY T. 2007. Future perspectives in the evaluation of the physiological demands of soccer. Sports Medicine, 37(9): 783-805.
-
16DUCKSTEIN L & OPRICOVIC S. 1980. Multiobjective optimization in river basin development. Water Resources Research, 16(1): 14-20.
-
17EAVES SJ. 2015. A history of sports notational analysis: a journey into the nineteenth century. International Journal of Performance Analysis in Sport, 15(3): 1160-1176.
-
18FERNANDEZ-NAVARRO J, FRADUA L, ZUBILLAGA A, FORD PR & MCROBERT AP. 2016. Attacking and defensive styles of play in soccer: analysis of Spanish and English elite teams. 414 (April).
-
19GARCIA PA DE A & SANT’ANNA AP. 2015. Vendor and Logistics Provider Selection in the Construction Sector: a Probabilistic Preferences Composition Approach. Pesquisa Operacional, 35(2): 363-375.
-
20GAVIÃO LO, SILVA RF DA, SANT’ANNA, AP & LIMA GBA. 2016. Ordenação de Municípios por Potencial de Contaminação de Águas com Fármacos Oncológicos por Composição Probabilística de Preferências [Powerpoint slides in Portuguese]. In Simpósio Brasileiro de Pesquisa Operacional, (p. 12). Vitória.
-
21GIBBONS JD & CHAKRABORTI S. 2011. Nonparametric statistical inference. In: International encyclopedia of statistical science. Springer Berlin Heidelberg, 977-979.
-
22GOVINDAN K, RAJENDRAN S, SARKIS J & MURUGESAN P. 2015. Multi criteria decision making approaches for green supplier evaluation and selection: a literature review. Journal of Cleaner Production, 98: 66-83.
-
23HAUKE J & KOSSOWSKI T. 2011. Comparison of values of Pearson’s and Spearman’s correlation coefficients on the same sets of data. Quaestiones Geographicae, 30(2): 87-93.
-
24JATO-ESPINO D, CASTILLO-LOPEZ E, RODRIGUEZ-HERNANDEZ J & CANTERAS-JORDANA JC. 2014. A review of application of multi-criteria decision making methods in construction. Automation in Construction, 45: 151-162.
-
25KENDALL MG. 1938. A new measure of rank correlation. Biometrika, 30(1/2): 81-93.
-
26LAGO-BALLESTEROS J & LAGO-PEÑAS C. 2010. Performance in Team Sports: Identifying the Keys to Success in Soccer. Journal of Human Kinetics, 25(July): 85-91.
-
27LAGO-PEÑAS C & LAGO-BALLESTEROS J. 2011. Game location and team quality effects on performance profiles in professional soccer. Journal of Sports Science and Medicine, 10(3): 465-471.
-
28LAGO-PEÑAS C, LAGO-BALLESTEROS J & REY E. 2011. Differences in Performance Indicators between Winning and Losing Teams in the UEFA Champions League. Journal of Human Kinetics, 27(March): 137-148.
-
29LARKIN P, CONNOR DO & WILLIAMS AM. 2016. Establishing validity and reliability of a movement awareness and technical skill (MATS) analysis instrument in soccer, 191-202.
-
30LEIVA V, SANTOS-NETO M, CYSNEIROS FJA & BARROS M. 2014. Birnbaum-Saunders statistical modelling: a new approach. Statistical Modelling, 14(1): 21-48.
-
31LEONETI AB. 2016. Considerations Regarding the Choice of Ranking Multiple Criteria Decision Making Methods. Pesquisa Operacional, 36: 259-277.
-
32LIU H, GÓMEZ M-A, GONÇALVES B & SAMPAIO J. 2016. Technical performance and match-tomatch variation in elite football teams. Journal of Sports Sciences, 34(6): 509-518.
-
33LIU H, GOMEZ M-A, LAGO-PEÑAS C & SAMPAIO J. 2015. Match statistics related to winning in the group stage of 2014 Brazil FIFA World Cup. Journal of Sports Sciences, 33(5): 1205-1213.
-
34LIU H, GOMEZ MA & LAGO-PENAS C. 2015. Match Performance Profiles of Goalkeepers of Elite Football Teams. International Journal of Sports Science & Coaching, 10(4): 669-682.
-
35LIU H, YI Q, GIMÉNEZ J-V, GÓMEZ MA & LAGO-PEÑAS C. 2015. Performance profiles of football teams in the UEFA Champions League considering situational efficiency. International Journal of Performance Analysis in Sport, 15 april, 371-390.
-
36MARDANI A, JUSOH A, MD NOR K, KHALIFAH Z, ZAKWAN N & VALIPOUR A. 2015. Multiple criteria decision-making techniques and their applications - a review of the literature from 2000 to 2014. Economic Research-Ekonomska Istraživanja, 28(1): 516-571.
-
37MARDANI A, JUSOH A & ZAVADSKAS EK. 2015. Fuzzy multiple criteria decision-making techniques and applications - Two decades review from 1994 to 2014. Expert Systems with Applications, 42(8): 4126-4148.
-
38MARDANI A, JUSOH A, ZAVADSKAS EK, KHALIFAH Z & NOR KMD. 2015. Application of multiple-criteria decision-making techniques and approaches to evaluating of service quality: a systematic review of the literature. Journal of Business Economics and Management, 16(5): 1034-1068.
-
39MILLARD SP. 2013. EnvStats, an R Package for Environmental Statistics. Wiley Online Library.
-
40MOURA FA, MARTINS LEB & CUNHA SA. 2014. Analysis of football game-related statistics using multivariate techniques. Journal of Sports Sciences, 32(20): 1881-1887.
-
41OPRICOVIC S. 1998. Multicriteria optimization of civil engineering systems. Faculty of Civil Engineering, Belgrade, 2(1): 5-21.
-
42OPRICOVIC S. 2007. A fuzzy compromise solution for multicriteria problems. International Journal of Uncertainty, Fuzziness and Knowledge-Based Systems, 15(3): 363-380.
-
43OPRICOVIC S. 2011. Fuzzy VIKOR with an application to water resources planning. Expert Systems with Applications, 38(10): 12983-12990.
-
44OPRICOVIC S & TZENG GH. 2004. Compromise solution by MCDM methods: A comparative analysis of VIKOR and TOPSIS. European Journal of Operational Research, 156(2): 445-455.
-
45SANT’ANNA AP. 2015. Probabilistic Composition of Preferences, Theory and Applications.
-
46SANT’ANNA AP, BARBOZA EU & SOARES DE MELLO JCCB. 2010. Classification of the teams in the Brazilian soccer championship by probabilistic criteria composition. Soccer & Society, 11(3): 261-276.
-
47SANT’ANNA AP, COSTA HG, NEPOMUCENO DO & PEREIRA V. 2016. A probabilistic approach applied to the classification of courses by multiple evaluators, 36: 469-485. https://doi.org/10.1590/0101-7438.2016.036.03.0469
» https://doi.org/10.1590/0101-7438.2016.036.03.0469 -
48SANT’ANNA AP & GOMES LFAM. 2003. New Evidence on the Formation of Preferences of Betters in horse races. In Encontro Nacional de Engenharia de Produção XXIII ENEGEP, (pp. 1-6). Ouro Preto - MG.
-
49SANT’ANNA AP & SANT’ANNA LAFP. 2001. Randomization as a stage in criteria combining. In International Conference on Industrial Engineering and Operations Management - VII ICIEOM, (pp. 248-256). Salvador.
-
50SANT’ANNA AP & SOARES DE MELLO JCCB. 2012. Validating Rankings in Soccer Championships. Pesquisa Operacional, 32(2): 407-422.
-
51SGRO F, BARRESI M & LIPOMA M. 2015. The analysis of discriminant factors related to team match performances in European football Championship 2012. Journal of Physical Education and Sport, 15(3): 460-465.
-
52SHAFIZADEH M, TAYLOR M & LAGO-PEÑAS C. 2013. Performance Consistency of International Soccer Teams in Euro 2012: a Time Series Analysis. Journal of Human Kinetics, 38(September): 213-226.
-
53SILVA RC. 2008. Relação entre modelos de programação não-linear com incerteza no conjunto de restrições. Pesquisa Operacional, 28(3): 383-398.
-
54SOLTANI A, HEWAGE K, REZA B & SADIQ R. 2015. Multiple stakeholders in multi-criteria decision-making in the context of municipal solid waste management: a review. Waste Management, 35: 318-328.
-
55SPEARMAN C. 1904. The proof and measurement of association between two things. The American Journal of Psychology, 15(1): 72-101.
-
56TENGA A, HOLME I, RONGLAN LT & BAHR R. 2010. Effect of playing tactics on achieving scorebox possessions in a random series of team possessions from Norwegian professional soccer matches. Journal of Sports Sciences, 28(3): 245-255.
-
57WOODS CT, RAYNOR AJ, BRUCE L, MCDONALD Z & ROBERTSON S. 2016. The application of a multi-dimensional assessment approach to talent identification in Australian football. Journal of Sports Sciences, 34(14): 1340-1345.
-
58YU P-L. 1973. A class of solutions for group decision problems. Management Science, 19(8): 936- 946.
-
59ZADEH LA. 1965. Information and control. Fuzzy Sets, 8(3): 338-353.
-
60ZELENY M. 1982. Multi criteria decision making. New York: McGraw-Hills.
Appendix I - CPP 2nd stage results.
Appendix II - CPP 3rd stage results GV1.
Appendix III - CPP 3rd stage results GV2.
Appendix IV - CPP 3rd stage results GV3.
Appendix V - CPP 3rd stage results Composition.
Appendix VI - R Code.
#### PROBABILISTIC COMPOSITION OF PREFERENCES ####
########### PREMIER LEAGUE 2015-2016 #################
### Main Reference
### Sant’Anna, A. P. (2015).
"Probabilistic Composition of Preferences, Theory and Applications." New York: Springer.
### "R" packages used in the modeling require(readxl)
require(triangle)
### Selecting the working directory where the database is located path = "COPY AND PASTE THE WORKING DIRECTORY"
setwd(path)
#####################
### CPP 1st STAGE ###
### Randomization of evaluations with triangular distributions
### Triangular PDF parameters: dtriangle(x,"min","max","mode")
### Triangular CDF parameters: ptriangle(x,"min","max","mode")
#####################
### CPP 2nd STAGE ###
### Importing database from positive impact criteria
PL.1 = read_excel("FILE NAME.xlsx", col_names = FALSE, sheet = "SHEET NUMBER") min.1 = apply(PL.1,2,min)
max.1 = apply(PL.1,2,max)
### Loop for computing the Prob.Max for each alternative/each positive criterion Prob.Max.p = PL.1
for (j in 1:ncol(PL.1))
{
for (i in 1:nrow (PL.1))
{
Prob.Max.p[i,j] = (integrate(Vectorize(function(x)
{prod(ptriangle(x,min.1[j]*0.99,max.1[j]*1.01,PL.1[,j][-i]))
*dtriangle(x,min.1[j]*0.99,max.1[j]*1.01,PL.1[,j][[i]])}),min.1[j]*0.99,max.1[j]*1.01))
$value
}}
### Loop for computing the Prob.Min for each alternative/each positive criterion Prob.Min.p = PL.1
for (j in 1:ncol(PL.1))
{
for (i in 1:nrow (PL.1))
{
Prob.Min.p[i,j]=(integrate(Vectorize(function(x)
{prod(1-ptriangle(x,min.1[j]*0.99,max.1[j]*1.01,PL.1[,j][-i]))
*dtriangle(x,min.1[j]*0.99,max.1[j]*1.01,PL.1[,j][[i]])}),min.1[j]*0.99,max.1[j]*1.01))
$value
}}
### Importing database from negative impact criteria
PL.2 = read_excel("FILE NAME.xlsx", col_names = FALSE, sheet = "SHEET NUMBER") min.2 = apply(PL.2,2,min)
max.2 = apply(PL.2,2,max)
### Loop for computing the Prob.Min for each alternative/each negative criterion Prob.Min.n = PL.2
for (j in 1:ncol(PL.2))
{
for (i in 1:nrow (PL.2))
{
Prob.Min.n[i,j]=(integrate(Vectorize(function(x)
{prod(1-ptriangle(x,min.2[j]*0.99,max.2[j]*1.01,PL.2[,j][-i]))
*dtriangle(x,min.2[j]*0.99,max.2[j]*1.01,PL.2[,j][[i]])}),min.2[j]*0.99,max.2[j]*1.01))
$value
}}
### Loop for computing the Prob.Max for each alternative/each negative criterion Prob.Max.n = PL.2
for (j in 1:ncol(PL.2))
{
for (i in 1:nrow (PL.2))
{
Prob.Max.n[i,j]=(integrate(Vectorize(function(x)
{prod(ptriangle(x,min.2[j]*0.99,max.2[j]*1.01,PL.2[,j][-i]))
*dtriangle(x,min.2[j]*0.99,max.2[j]*1.01,PL.2[,j][[i]])}),min.2[j]*0.99,max.2[j]*1.01))
$value
}}
### 2nd stage results for all criteria (Progressive-Conservative axis) Probs.PROG = cbind(Prob.Max.p,Prob.Min.n)
Probs.CONS = cbind(Prob.Min.p,Prob.Max.n)
#####################
### CPP 3rd STAGE ###
### Point of view "PP" ### PP = apply(Probs.PROG,1,prod) PP.rank = rank(-PP)
### Point of view "PO" ### Probs.m = 1-Probs.PROG
PO = 1-(apply(Probs.m,1,prod)) PO.rank = rank(-PO)
### Point of view "CP" ### Probs.mm = 1-Probs.CONS
CP = apply(Probs.mm,1,prod) CP.rank = rank(-CP)
### Point of view "CO" ###
CO = 1-(apply(Probs.CONS,1,prod)) CO.rank = rank(-CO)
Publication Dates
-
Publication in this collection
May-Aug 2017
History
-
Received
22 Nov 2016 -
Accepted
05 July 2017