
ABSTRACT
Team formation is a key aspect of football, being able to bring sporting and financial results, but also susceptible to great risks. Considering that this problem involves subjective decisions, it also becomes subject to failures. The use of quantitative approach methodologies can overcome such aspects and offer better results for football clubs. In this context, a systematic review was carried out on Operations Research techniques for player selection and formation of football teams, demonstrating the main references and authors of the area. A search on the scientific bases Web of Knowledge, Scopus, and ScienceDirect was carried out during the month of January of 2018, analyzing a total of 1,637 articles. Of these, only 12 were selected for analysis. The research of Boon and Sierksma (20034 BOON BH & SIERKSMA G. 2003. Team formation: Matching quality supply and quality demand. European Journal of Operational Research, 148(2): 277-292.) was identified as the main reference of the area, being referenced by four other authors. It is highlighted the low number of citations between the papers, as well as the lack of review articles like this one. All these aspects contribute to the relevance of this research, addressing a significant problem in one of the most popular sports in the world and unifying its main references.
Keywords:
Collective Sports; Decision Making; Player Selection; Team Lineup
1 INTRODUCTION
Kaplan (201014 KAPLAN T. 2010. Soccer Remains Least Statistical of Major Sports. The New York Times.) defined football as “the least statistic of sports”. Among its several characteristics, the author attributes this fact to the difficulty in describing, in statistical data, the capacity of a player. Such fact is related to the sport being marked by inefficiency, since the goal, its most important moment, occurs every 69 minutes of game, on average, while in other similar sports, like American Football, Rugby, and Hockey, its equivalent happens every nine, 12 and 22 minutes, respectively. Therefore, although companies like Opta and Stats provide, by match, thousands of statistical data, given the rarity of the goal, it’s possible that a game ends with none of its key data (Anderson & Sally, 20133 ANDERSON C & SALLY D. 2013. The Numbers Game: Why Everything You Know about Soccer Is Wrong. London: Penguin.).
The selection of human resources represents a fundamental problem for the good development of a team, be it in football, basketball, or any collective sport. It is necessary to analyze how to select the best athlete according to the interests of the team (Merig´o & Gil-Lafuente, 201116 MERIGÓ JM & GIL-LAFUENTE AM. 2011. Decision-making in sport management based on the OWA operator. Expert Systems with Applications, 38(8): 24-28.).
Qader et al. (201721 QADER MA, ZAIDAN BB, ZAIDAN AA, ALI SK, KAMALUDDIN MA & RADZI WB. 2017. A methodology for football players selection problem based on multimeasurements criteria analysis. Measurement: Journal of the International Measurement Confederation, 111: 38-50.) states that the selection of players is a crucial process for clubs being capable of delivering high sports and financial returns, but at the same time, susceptible to large risks if the deposited expectations are not met. The authors conclude by stating that it is customary for football clubs to consider various psychological assessments of the players analyzed, a fact that should be treated only as a part of a complex system. M¨uller et al. (2017) collaborates to this declaration, emphasizing the economic aspect, affirming that, among any investments made by football clubs, the most important ones are those made for hiring players. However, this action still does not receive due attention by the clubs, where data and statistics obtained are directed to other issues (Al-Madi et al., 20161 AL-MADI F, AL-TARAWNEH K & ALSHAMMARI MA. 2016. HR practices in the soccer industry: Promising research arena. International Review of Management and Marketing, 6(4): 2146-4405.).
According to Wright (200923 WRIGHT MB. 2009. 50 years of OR in sport. Journal of the Operational Research Society, 60(S1): 161-168.), the identification of an Operations Research (OR) technique, among other topics such as statistics and economics, involves the contribution that it has to decision making. Various contributions of OR to sport are found in the scientific literature. However, topics of player selection and team formation are not properly studied in the football industry, or in the scientific literature (Al-Madi et al., 20161 AL-MADI F, AL-TARAWNEH K & ALSHAMMARI MA. 2016. HR practices in the soccer industry: Promising research arena. International Review of Management and Marketing, 6(4): 2146-4405.). Since team formation involves decisions that pass through subjective criteria, making them prone to failures, the use of quantitative methodologies can overcome these aspects and offer better sports results (Ozceylan, 201619 OZCEYLAN EO. 2016. A mathematical model using ahp priorities for soccer player selection: a case study. South African Journal of Industrial Engineering, 27(2): 190-205.).
Therefore, this research will carry out a systematic review of operations research techniques applied for the formation of football teams, identifying its main researches and authors, also analyzing their proposed methods and solutions for the problematic.
2 METHODOLOGY
The research was conducted using the Web of Knowledge, Scopus, and ScienceDirect databases during the month of December, 2017. During the search, no temporal or language cut was performed. The following keywords were used for the search: “football or soccer and not “national football league” or “NFL or robot”, excluding from the search the American Football and robot soccer, subjects that would also be returned in the searches. Other terms included in the search referred to the formation of teams and hiring of players, as well as their respective synonyms. The results were also limited as to the type of document, being limited to articles.
Then, filters were applied about the articles area of knowledge, limiting the following areas: sports, decision, social, and computer sciences, economics, business, finance, management, mathematics, and engineering, as well as works classified as multidisciplinary, or uncategorized.
After the exclusion of duplicate papers, the remainder had their titles and abstracts evaluated for exclusion or maintenance in the analysis. To that end, it was verified whether the work was in accordance with the following criteria: (i) referring to professional football, (ii) proposing methodologies of a quantitative nature, (iii) addressing player selection topics, or team lineup. No search directly related to OR has been inserted, but it can be said that the union of (ii) and (iii) already perform this filter, indirectly.
The works were grouped according to their objectives, within the context of team formation. The groupings were made through the creation of graphs, using Gephi software, version 0.9.2. The first grouping identified the relation among the papers, through the citations between them; the second one illustrated the connectivity between the references of each of these researches. Finally, the articles were described, according to their objectives, and compared with technical aspects such as methods, variables used and results obtained.
3 RESULTS
The initial search resulted in 12,176 articles, considering the three scientific bases mentioned. Figure 1 shows the procedures performed during the analysis.
As shown in Figure 1, due to the large amount of research returned by Scopus and Web of Science, it was necessary to perform a per-area knowledge filtering, which led to the exclusion of 10,399 articles. Then, the remnants were grouped to the returns in the search done by ScienceDirect, which were imported to the Zotero reference management software, for verification of duplicates. There were 140 articles common to all three bases. Subsequently, the works were analyzed according to the eligibility criteria adopted, resulting in the selection of nine researches, which had their references evaluated, adding to the analysis three other articles, reaching a total of 12 papers.
Although they have in common the objective of team formation, each of the works differs in the way this is sought. Figure 2 demonstrates how papers are segmented from their primary purpose.
Figure 2 shows the two initial objectives for the tactical changes proposed during a game (1), with five articles, and for the definition and setting of the squad, either for a specific game or a season (2) with seven papers. The objectives of tactical changes were divided into two other purposes, regarding the substitutions made during a game, seeking patterns, or better ways to perform them (1.1) and the tactical formation of the team, translated as the distribution of players by functions in the field (1.2). As for the squad definition there were also two divisions: the first one where three works proposed methodologies for hiring players (2.1) and the second, where techniques were proposed to optimize the team lineup (2.2).
Figure 3 explains the relationships, between the 12 papers, through graphs visualization, where the edges (arrows) indicate the citations made between them and each one of the articles is represented as nodes.
Articles returned and their relationships. A1: Hirotsu & Wright (200210 HIROTSU N & WRIGHT MB. 2002. Using a markov process model of an association football match to determine the optimal timing of substitution and tactical decisions. Journal of the Operational Research Society, 53(1): 88-96.); A2: Hirotsu & Wright (200311 HIROTSU N & WRIGHT MB . 2003. Determining the best strategy for changing the configuration of a football team. Journal of the Operational Research Society, 54(8): 878-887.); A3: Boon & Sierksma (20034 BOON BH & SIERKSMA G. 2003. Team formation: Matching quality supply and quality demand. European Journal of Operational Research, 148(2): 277-292.); A4: Hirotsu & Wright (200612 HIROTSU N & WRIGHT MB. 2006. Modeling Tactical Changes of Formation in Association Football as a Zero-Sum Game. Journal of Quantitative Analysis in Sports, 2(2).); A5: Hirotsu et al. (20099 HIROTSU N, ITO M, MIYAJI C, HAMANO K & TAGUCHI A. 2009. Modeling Tactical Changes of Formation in Association Football as a Non-Zero-Sum Game. Journal of Quantitative Analysis in Sports, 5(3).); A6: Merigó & Gil-Lafuente (201116 MERIGÓ JM & GIL-LAFUENTE AM. 2011. Decision-making in sport management based on the OWA operator. Expert Systems with Applications, 38(8): 24-28.); A7: Myers (201218 MYERS BR. 2012. A proposed decision rule for the timing of soccer substitutions.Journal of Quantitative Analysis in Sports, 8(1).); A8: Jarvandi et al. (201313 JARVANDI A, SARKANI S & MAZZUCHI T. 2013. Modeling team compatibility factors using a semi-Markov decision process: A data-driven approach to player selection in soccer. Journal of Quantitative Analysis in Sports, 4(4): 347-366.); A9: Tavana et al. (201322 TAVANA M, AZIZI F, AZIZI F & BEHZADIAN M. 2013. A fuzzy inference system with application to player selection and team formation in multi-player sports. Sport Management Review, 16(1): 97-110.); A10: Ozceylan (201619 OZCEYLAN EO. 2016. A mathematical model using ahp priorities for soccer player selection: a case study. South African Journal of Industrial Engineering, 27(2): 190-205.); A11: Al-Shboul et al. (20172 AL-SHBOUL R, SYED T, MEMON J & KHAN F. 2017. Automated Player Selection for Sports Team using Competitive Neural Networks. International Journal of Advanced Computer Science and Applications, 8(8).); A12: Pantuso (201720 PANTUSO G. 2017. The Football Team Composition Problem: A Stochastic Programming approach. Journal of Quantitative Analysis in Sports, 13(3): 113-129.).
Observing Figure 3, and the citations relationship between articles, it is possible to visually identify the previously defined subgroups (“Squad Definition” and “Tactical Changes”). Except for Al-Shboul et al. (A11), all other works did or received, at least, one citation. Table 1 was elaborated to discriminate these citations among each paper.
Table 1 shows Hirotsu & Wright (200210 HIROTSU N & WRIGHT MB. 2002. Using a markov process model of an association football match to determine the optimal timing of substitution and tactical decisions. Journal of the Operational Research Society, 53(1): 88-96.),, as well as Boon & Sierksma (20034 BOON BH & SIERKSMA G. 2003. Team formation: Matching quality supply and quality demand. European Journal of Operational Research, 148(2): 277-292.), as the most cited works, each one being referenced four times. However, it is worth mentioning that three of the four quotations from the first work were made by other studies carried out by at least one of its authors, while none of the four references of Boon & Sierksma (20034 BOON BH & SIERKSMA G. 2003. Team formation: Matching quality supply and quality demand. European Journal of Operational Research, 148(2): 277-292.) were self-citations. This fact indicates the last one as a main reference in the literature for researches that deals with the formation of football teams. As for the works authors, only two appeared in more than one paper: Nobuyoshi Hirotsu and Michael Wright. The first one was the main author in four of the 12 articles (A1, A2, A4 and A5) and the second one was co-author in the first three works (A1, A2 and A4).
A posterior analysis was elaborated regarding the relations between the other references of the researches, excluding those carried out between the works, to verify the presence of common bibliographies, as illustrated Figure 4.
Analyzing Figure 4, the divisions between objectives are no longer visible when the relationship is established by bibliographies, where only half (six) of the articles share references (A1, A2, A3, A4, A5, and A11). To identify how many times there were shared bibliographies, Table 2 was created. This analysis was performed in two ways, one for all 12 papers and another one by the authors, grouping the references of articles A1, A2, A4, and A5, which share the same main author and tend to share references among themselves, as could be identified in Figure 4 by their node proximity.
Table 2 shows that, despite the large number of references analyzed (209) only three bibliographies were shared by more than one author: Maher (198215 MAHER MJ. 1982. Modelling association football scores. Statistica Neerlandica, 36(3): 109-118.), Dixon & Coles (19976 DIXON MJ & COLES SG. 1997. Modelling association football scores and inefficiencies in the football betting market. Journal of the Royal Statistical Society. Series C: Applied Statistics, 46(2): 265-280.) and Dixon & Robinson (19987 DIXON MJ & ROBINSON ME. 1998. A birth process model for association football matches. Journal of the Royal Statistical Society: Series D (The Statistician), 47(3): 523-538.), which places them as some of the main references for this type of study.
4 DISCUSSION
Previously to the discussion of the returned researches it is convenient to present other articles that have made similar search in the literature, like Wright (200923 WRIGHT MB. 2009. 50 years of OR in sport. Journal of the Operational Research Society, 60(S1): 161-168.) that highlighted several operational research contributions to sports in the 50 years that preceded the paper. Different topics were discussed such as strategic and tactical aspects of the teams, mentioning the works of Hirotsu & Wright (200210 HIROTSU N & WRIGHT MB. 2002. Using a markov process model of an association football match to determine the optimal timing of substitution and tactical decisions. Journal of the Operational Research Society, 53(1): 88-96., 200311 HIROTSU N & WRIGHT MB . 2003. Determining the best strategy for changing the configuration of a football team. Journal of the Operational Research Society, 54(8): 878-887.) and Boon & Sierksma (20034 BOON BH & SIERKSMA G. 2003. Team formation: Matching quality supply and quality demand. European Journal of Operational Research, 148(2): 277-292.), as did in the present research. Other topics involving sporting championship schedules and game outcome predictions are also covered in sports such as football, American football, baseball, basketball and cricket.
Gerchak (19948 GERCHAK Y. 1994. Chapter 14 Operations research in sports. In: Handbooks in operations research and management science, vol. 6. pp. 507-527. Elsevier.) also presents similar work, addressing other applications of operational research in sports. The research addresses strategic aspects such as the importance of correct player positioning to achieve a greater amount of points in American football, or when to replace the goalkeeper by a line player in hockey. Other themes are also addressed as the influence of positive sequences of pitches for basketball players (the so-called “hot hand”) and a check on the validity of the National Football League (NFL) drafts system goal to make the championship more disputed by giving weaker teams the priority for selection of the best athletes coming from the university leagues.
Although they are in the same field of research and presented some research in common, none of the articles focused on the formation of football teams as much as this research, which analyzed three scientific bases and more than a thousand articles to find the 12 works in question.
4.1 Player substitution
Hirotsu & Wright (200210 HIROTSU N & WRIGHT MB. 2002. Using a markov process model of an association football match to determine the optimal timing of substitution and tactical decisions. Journal of the Operational Research Society, 53(1): 88-96.) contextualized their study stating that, although soccer is a continuous sport, formed by discrete events, few works assimilate it to a multi-stage Markov process. In their work, the realization of this modeling is justified by the authors as an opportunity to estimate the distribution of goals and point expectation by teams during the championships. Which is the research goal: determine the correct timing of performing players transition (substitutions) during a football match. The data used in the paper were provided by The Carling Opta Football Yearbook which contains a wealth of information regarding players participating in the English premier league in the 1998-9 season.
The calculation of transition probabilities between stages is done according to a Poisson regression model with data of games played during the season. The case study was done by simulating games between three teams, “X”, “Y”, and “Z”, where the team “Y” had the option to choose between two players: “M” and “S”. Match data were entered into a dynamic programming model to identify the optimal replacement time between players, oriented to maximize the number of points expected from the match. The results showed an increase in point expectation with the substitution of player “M” by player “S”, in different situations and moments of the game.
Myers (201218 MYERS BR. 2012. A proposed decision rule for the timing of soccer substitutions.Journal of Quantitative Analysis in Sports, 8(1).) developed a replacement strategy that increases the possibilities of a club achieve better match results, using the decision tree technique for this purpose. Data on 485 substitutions were collected from the English Premier League, Bundesliga, MLS, the 2010 World Cup, Serie A, and La Liga using data provided by ESPN Soccernet. The following variables were analyzed: goal differential before and after substitution, home advantage and time (minutes) substitutions occurred.
The results showed that when a team was losing before the first substitution, it was able to improve its result in 41% of the time when the change was made before the 58th minute. As for the second substitution, the model indicated that this should be done before the minute 72, with an improvement of 30% of the cases. Finally, the last substitution was indicated to happen previously to the 78h minute of the match, which was effective in 24% of the times. Its main results, divided according to the championship analyzed, are shown by Table 3.
As shown by Table 3, the rule was tested in different championships games, where teams that followed it had success in, at least, 32% of the cases, with no more than 25% cases of success without the created rule. It is worth mentioning that Serie A was the championship where the rule obtained a higher success rate, superior to 50% of the analyzed cases.
Although both studies have presented methodologies that improve the moment of performing a substitution, they have some distinctions. It is possible to consider that Myers (201218 MYERS BR. 2012. A proposed decision rule for the timing of soccer substitutions.Journal of Quantitative Analysis in Sports, 8(1).) presented more expressive results, since it used a quantity of data superior to that of Hirotsu & Wright (200210 HIROTSU N & WRIGHT MB. 2002. Using a markov process model of an association football match to determine the optimal timing of substitution and tactical decisions. Journal of the Operational Research Society, 53(1): 88-96.) and still validated the rule of substitutions created in an even greater database. However, it’s necessary to consider their year’s difference, which may be related to the amount of data available, as well as its ease of treatment.
4.2 Tactical formation
Hirotsu & Wright (200311 HIROTSU N & WRIGHT MB . 2003. Determining the best strategy for changing the configuration of a football team. Journal of the Operational Research Society, 54(8): 878-887., 200612 HIROTSU N & WRIGHT MB. 2006. Modeling Tactical Changes of Formation in Association Football as a Zero-Sum Game. Journal of Quantitative Analysis in Sports, 2(2).) and Hirotsu et al. (20099 HIROTSU N, ITO M, MIYAJI C, HAMANO K & TAGUCHI A. 2009. Modeling Tactical Changes of Formation in Association Football as a Non-Zero-Sum Game. Journal of Quantitative Analysis in Sports, 5(3).) presented proposals for the improvement of team performance, through changes in tactical formations. These researches can be seen as sequences of the model proposed by Hirotsu & Wright (200210 HIROTSU N & WRIGHT MB. 2002. Using a markov process model of an association football match to determine the optimal timing of substitution and tactical decisions. Journal of the Operational Research Society, 53(1): 88-96.), however, they direct their objective to consider only substitutions that alter the tactical formation of the team in the field, to determine, which formations must be adopted for better results.
Hirotsu & Wright (200311 HIROTSU N & WRIGHT MB . 2003. Determining the best strategy for changing the configuration of a football team. Journal of the Operational Research Society, 54(8): 878-887.) focus on the offensive and defensive analysis of clubs, according to their lineups and the combinations of players used during the season. Five main positions were adopted: fullbacks, central defenders, defensive, and offensive midfielders, and forwards. Team’s offensive and defensive forces were estimated according to their formations and combinations by modeling the game in the same way as made in Hirotsu & Wright (200210 HIROTSU N & WRIGHT MB. 2002. Using a markov process model of an association football match to determine the optimal timing of substitution and tactical decisions. Journal of the Operational Research Society, 53(1): 88-96.), with the same case study (Premier League, 1998-9 Season). Different formations were shown as better, according to difference circumstances of the game. Thus, dynamic programming was used to determine strategies for tactical changes. The model was applied to game simulations between the so-called teams “X” and “Y” identifying, according to different game scores, the best formations changes to be used. Table 4 presents the results for five different starting formations, distributed according to the number of players in each analyzed position, and number of substitutions expected in a home match game.
According to Table 4, in a home match against Team “Y”, Team “X” should opt for the second formation (2-2-1-3-2), since it holds the highest possible point value in this scenario (1.428). At the end of the research, the authors suggested that future work should include game theory to the model, considering changes on the opposing team formation.
This recommendation was followed in Hirotsu & Wright (200612 HIROTSU N & WRIGHT MB. 2006. Modeling Tactical Changes of Formation in Association Football as a Zero-Sum Game. Journal of Quantitative Analysis in Sports, 2(2).), which considered the interaction between two teams, Yokohama FM (YFM), and Kashima A (KA), during a match and considering all the tactical changes caused, considering any changes in team configuration, not only by player substitution. The model was tested in the Japanese League, season of 2002, focusing on the teams offensive and defensive forces, calculated through their formations. Based on this analysis, a model was developed to ponder tactical changes and show how coaches decisions affects the club probability of victory.
Decisions were modeled on a zero-sum game where each coach makes only the best decisions for his club, disregarding the cooperation option (draws) for the outcome of the match. The odds of victory in a match between two teams were presented, considering different scenarios and tactical formations. A formation-exchange flowchart was also presented according to the match score and the number of substitutions available for the teams, as shown by Figure 5.
Figure 5 presents the tatics decisions that should be made by each team, with block (a) referring to tactical decisions that should be made by Yokohama FM, while (b) refers to the Kashima A tactical decisions. The upper left cell of each table represents the number of substitutions available for each team, ranging from 0 to 3. Each table represents a different situation, as the situation of the teams on the scoreboard, ranging from -2 to 2, which the negative numbers representing a partial defeat of Yokohama FM, 0 representing a draw and the positive numbers representing a victory of the team. Therefore, each team is guided, according to the remaining game time, to the tactical formation they must adopt to get a better match result.
The authors suggested future studies for the modeling of the problem as a non-zero-sum game, introducing the cooperation factor between teams.
This proposal is the main advance of Hirotsu et al. (20099 HIROTSU N, ITO M, MIYAJI C, HAMANO K & TAGUCHI A. 2009. Modeling Tactical Changes of Formation in Association Football as a Non-Zero-Sum Game. Journal of Quantitative Analysis in Sports, 5(3).), where the same data and case study were used, but the representation of the results of the game is made according to the number of points acquired by the teams, being zero for a defeat, one point for a draw and three points for a victory. The number of points expected for each team is shown in Figure 6.
As Figure 6 shows, both teams tend to lose expected number of points as they remain with their tactical formations unchanged and watch their opponents’ make modifications during the game. It can also be seen that Kashima A is the team with the highest number of points expected and is therefore the most likely to win the game.
A comparison was also made between the tactical flowcharts and team strategy made in their previous work, according to the progress of the game. The comparison indicated that in the case of a zero-sum game teams play more offensively while, with the introduction of point systems, the game became more dynamic.
4.3 Player hiring
Merigó & Gil-Lafuente (201116 MERIGÓ JM & GIL-LAFUENTE AM. 2011. Decision-making in sport management based on the OWA operator. Expert Systems with Applications, 38(8): 24-28.) developed new selection indices that eliminate preferences and subjectivities to the selection process assigned to a manager or decision maker. The proposed indexes consist of the combination of the Hamming distance, the adequacy coefficient and the maximum and minimum level index with the OWA (Ordered Weighted Averaging) operator.
An example is shown where a club seeks an optimal candidate for the forward position. Five criteria values were defined, and four candidates were analyzed for their respective performances, according to different distance operators. Initially, the authors stated that depending on the aggregation operator used in the model, the results may vary, which provides a complete scenario of the problem, contemplating different situations. However, in all the scenarios a single candidate was pointed out, being considered the optimal choice for the model.
In Jarvandi et al. (201313 JARVANDI A, SARKANI S & MAZZUCHI T. 2013. Modeling team compatibility factors using a semi-Markov decision process: A data-driven approach to player selection in soccer. Journal of Quantitative Analysis in Sports, 4(4): 347-366.) the authors state that transfer failures may be related to the adaptation of the new player to his team. The model seeks to assist clubs in quantifying compatibility effects, thus obtaining a better prediction of a new player’s potential. The interactions between players are analyzed through a semi-Markovian decision process.
The data from the study were collected from the 2008/2009 to 2011/2012 seasons of the English League. Player data were used to model the performance of the destination clubs before and after their transfer and thus calculate the expected change, as shown in Figure 7.
As sawn in Figure 7, the paper results showed that only 39 of 69 players made any contribution to the club that hired him, with the contribution being measured by the “Goal differential” provided by each one of the transfers, with values above 0 being considered as satisfactory in relation to the contribution of the athlete to the team. This ratio (57%) was used as the success rate of the model, and it was tested with a survey applied to a group of 25 individuals, made up of football coaches, journalists, and fans, questioned about the success of transfers made by major European clubs during the 2010 and 2011 seasons. The results showed a rate of success of 63%, which is in agreement with what was shown by the elaborated simulation.
In (2017) the author highlights the financial side involved in hiring players, which is his study goal: To improve the expected performance of teams in the assembly of their squads represented by the sum of the market value of their players. The model is tested in the English Premier League, where it is simulated during the “transfer windows” of 2014/2015 to 2016/2017 seasons. The whole scenario is adapted to a mathematical programming model with the objective of maximizing the present value of the team. Its main results, projected by the model, were compared with the team’s actual result, as shown by Figure 8.
The results shown in Figure 8 demonstrate that Pantuso’s model provides team values, in most cases, higher than those presented by the clubs over the years, with the exception of three among 20 analyzed teams (Crystal Palace, Southampton FC and West Ham United) a result that is better than 85% of the analyzed clubs.
Relating the three mentioned researches, it is considered that in (2013) and Pantuso (201720 PANTUSO G. 2017. The Football Team Composition Problem: A Stochastic Programming approach. Journal of Quantitative Analysis in Sports, 13(3): 113-129.), it was possible to propose more elaborate models when compared to Merigó & Gil-Lafuente (201116 MERIGÓ JM & GIL-LAFUENTE AM. 2011. Decision-making in sport management based on the OWA operator. Expert Systems with Applications, 38(8): 24-28.), which offers a smaller case study and little information on the variables treated in the research. It is relevant to consider that, although the first two works have proposed methodologies for player selection, each one aims at a different benefit, having Jarvandi et al.(201313 JARVANDI A, SARKANI S & MAZZUCHI T. 2013. Modeling team compatibility factors using a semi-Markov decision process: A data-driven approach to player selection in soccer. Journal of Quantitative Analysis in Sports, 4(4): 347-366.) given greater emphasis on sports success and Pantuso (201720 PANTUSO G. 2017. The Football Team Composition Problem: A Stochastic Programming approach. Journal of Quantitative Analysis in Sports, 13(3): 113-129.) focused on the financial aspects.
4.4 Team lineup
In Boon & Sierksma (20034 BOON BH & SIERKSMA G. 2003. Team formation: Matching quality supply and quality demand. European Journal of Operational Research, 148(2): 277-292.) the authors propose a system capable of assisting coaches to determine the optimum team lineup. In its first stage it is determined all qualities relevant to a team. The players considered are evaluated according to the qualities listed, for each position. The importance of their qualities is also determined, reflecting the game system and tactics that the coach prefers for his team. Through a mathematical programming model all possible choices for 11 positions and 26 individuals are calculated, seeking to acquire a team with the maximum weights per player position.
The research of Tavana et al. (201322 TAVANA M, AZIZI F, AZIZI F & BEHZADIAN M. 2013. A fuzzy inference system with application to player selection and team formation in multi-player sports. Sport Management Review, 16(1): 97-110.), explores the interaction between players. In the article it is proposed a fuzzy inference system, for team formation in soccer. The method is divided into two moments. Initially, rankings are made to choose the best team members according to their performance on criteria and their respective importance to positions. Then, in the combining phase, the fuzzy inference system is used to evaluate combinations between team members. Their variables are provided by coaches, based on combination factors such as the number of matches that athletes played together and number of passes between them. The result of the model is the combination percentage of the best sets of players in each sector of the field.
In Ozceylan (201619 OZCEYLAN EO. 2016. A mathematical model using ahp priorities for soccer player selection: a case study. South African Journal of Industrial Engineering, 27(2): 190-205.) a two-phase approach is applied to Fernerbahçe’s S. K. lineup. The first phase of the method consists in identifying the main attributes of a position, for which the AHP (Analytic Hierarchy Process) method is used. In the second phase, the problem is modeled using the integer programming to determine the best set of players. Football Manager 2015 game data were used as criteria and performances of the evaluated players. 44 attributes were evaluated, evaluated by a group of specialists. The objective function maximizes the total talent value of the lineup and several constraints guarantee the functionality of the model. Its main results, the team’s initial ranking, are presented in Figure 9.
The results shown by Figure 9, met all the restrictions and were compared to the 11 players who had the most playing time during the last 38 club games, which showed that eight players were present in both lineups, a 72% similar result.
Al-Shboul et al. (20172 AL-SHBOUL R, SYED T, MEMON J & KHAN F. 2017. Automated Player Selection for Sports Team using Competitive Neural Networks. International Journal of Advanced Computer Science and Applications, 8(8).) used historical game data between teams and player statistics, in pursuit of two goals: (i) To select the best combination of teams, according to their opponent; (ii) Predict probabilities of victory, according to the knowledge of the squad. In this objective, the authors used neural networks, where the inputs of the model are the performances of players selected by the analyzed team. The result of the match is then related to each player present, making it possible to evaluate their contributions to the final result. The validity of the model is calculated by the ratio between correctly predicted results and the total data set, generating an accuracy of 60%.
Analyzing the studies, it is possible to verify that team lineup can be influenced by different aspects, while Boon & Sierksma (20034 BOON BH & SIERKSMA G. 2003. Team formation: Matching quality supply and quality demand. European Journal of Operational Research, 148(2): 277-292.) and Ozceylan (201619 OZCEYLAN EO. 2016. A mathematical model using ahp priorities for soccer player selection: a case study. South African Journal of Industrial Engineering, 27(2): 190-205.) were similar in their methods and objective for maximizing team quality, considering individual player performances, Tavana et al. (201322 TAVANA M, AZIZI F, AZIZI F & BEHZADIAN M. 2013. A fuzzy inference system with application to player selection and team formation in multi-player sports. Sport Management Review, 16(1): 97-110.) and Al-Shboul et al. (20172 AL-SHBOUL R, SYED T, MEMON J & KHAN F. 2017. Automated Player Selection for Sports Team using Competitive Neural Networks. International Journal of Advanced Computer Science and Applications, 8(8).) sought to bring the individuality of the athletes to the benefit of the team by analyzing the teamwork and player’s contributions to the final result of the match, in order to establish the lineup with the highest chance of victory.
No similarity was found regarding the results of the articles, although in spite of being similar in their aims (team lineup) the objectives that each one has is different, being in Boon & Sierksma (20034 BOON BH & SIERKSMA G. 2003. Team formation: Matching quality supply and quality demand. European Journal of Operational Research, 148(2): 277-292.) and Ozceylan (201619 OZCEYLAN EO. 2016. A mathematical model using ahp priorities for soccer player selection: a case study. South African Journal of Industrial Engineering, 27(2): 190-205.) a maximization of performance of the team, according to the sum of the athletes performance, in Tavana et al. (201322 TAVANA M, AZIZI F, AZIZI F & BEHZADIAN M. 2013. A fuzzy inference system with application to player selection and team formation in multi-player sports. Sport Management Review, 16(1): 97-110.) a prioritization of teamwork of the athletes and in Al-Shboul et al. (20172 AL-SHBOUL R, SYED T, MEMON J & KHAN F. 2017. Automated Player Selection for Sports Team using Competitive Neural Networks. International Journal of Advanced Computer Science and Applications, 8(8).) being sought the team most likely to win certain games.
However, it is possible to identify similarities in the formation example used in the papers, where all of them used the 4-4-2 tactical formation for building the team lineup.
5 CONCLUSIONS
In football, wrong decisions about player selection can cost a championship, in addition to great losses. Therefore, it is necessary to organize the formation of a team to obtain better results. However, due to its high complexity, this process tends to be subjectively interpreted, depending on the experience of coaches and other managers (Tavana et al., 201322 TAVANA M, AZIZI F, AZIZI F & BEHZADIAN M. 2013. A fuzzy inference system with application to player selection and team formation in multi-player sports. Sport Management Review, 16(1): 97-110., Ozceylan 201619 OZCEYLAN EO. 2016. A mathematical model using ahp priorities for soccer player selection: a case study. South African Journal of Industrial Engineering, 27(2): 190-205.).
The present research worked in this context, searching in the literature papers that deal with the problem of football team formation, through OR techniques. In these circumstances, only 12 references were found, which had their relationships and other bibliographies analyzed to search the area main studies. The work of Boon & Sierksma (20034 BOON BH & SIERKSMA G. 2003. Team formation: Matching quality supply and quality demand. European Journal of Operational Research, 148(2): 277-292.) was identified as the main research, being referenced by four other authors.
It is important to note that none of the 12 works referenced more than three related researches. Also, other articles with similar objectives weren’t found, given the scientific bases analyzed, involving soccer and team formation. These facts demonstrate the relevance of this research to the environment that is inserted, dealing with an admittedly significant problem with one of the most popular sports in the world and unifying its main references.
REFERENCES
-
1AL-MADI F, AL-TARAWNEH K & ALSHAMMARI MA. 2016. HR practices in the soccer industry: Promising research arena. International Review of Management and Marketing, 6(4): 2146-4405.
-
2AL-SHBOUL R, SYED T, MEMON J & KHAN F. 2017. Automated Player Selection for Sports Team using Competitive Neural Networks. International Journal of Advanced Computer Science and Applications, 8(8).
-
3ANDERSON C & SALLY D. 2013. The Numbers Game: Why Everything You Know about Soccer Is Wrong. London: Penguin.
-
4BOON BH & SIERKSMA G. 2003. Team formation: Matching quality supply and quality demand. European Journal of Operational Research, 148(2): 277-292.
-
5DELOITTE. 2018. Football Money League. Available at: https://www2.deloitte.com/uk/en/pages/sports-business-group/articles/deloitte-football-money-league.html
» https://www2.deloitte.com/uk/en/pages/sports-business-group/articles/deloitte-football-money-league.html -
6DIXON MJ & COLES SG. 1997. Modelling association football scores and inefficiencies in the football betting market. Journal of the Royal Statistical Society. Series C: Applied Statistics, 46(2): 265-280.
-
7DIXON MJ & ROBINSON ME. 1998. A birth process model for association football matches. Journal of the Royal Statistical Society: Series D (The Statistician), 47(3): 523-538.
-
8GERCHAK Y. 1994. Chapter 14 Operations research in sports. In: Handbooks in operations research and management science, vol. 6. pp. 507-527. Elsevier.
-
9HIROTSU N, ITO M, MIYAJI C, HAMANO K & TAGUCHI A. 2009. Modeling Tactical Changes of Formation in Association Football as a Non-Zero-Sum Game. Journal of Quantitative Analysis in Sports, 5(3).
-
10HIROTSU N & WRIGHT MB. 2002. Using a markov process model of an association football match to determine the optimal timing of substitution and tactical decisions. Journal of the Operational Research Society, 53(1): 88-96.
-
11HIROTSU N & WRIGHT MB . 2003. Determining the best strategy for changing the configuration of a football team. Journal of the Operational Research Society, 54(8): 878-887.
-
12HIROTSU N & WRIGHT MB. 2006. Modeling Tactical Changes of Formation in Association Football as a Zero-Sum Game. Journal of Quantitative Analysis in Sports, 2(2).
-
13JARVANDI A, SARKANI S & MAZZUCHI T. 2013. Modeling team compatibility factors using a semi-Markov decision process: A data-driven approach to player selection in soccer. Journal of Quantitative Analysis in Sports, 4(4): 347-366.
-
14KAPLAN T. 2010. Soccer Remains Least Statistical of Major Sports. The New York Times.
-
15MAHER MJ. 1982. Modelling association football scores. Statistica Neerlandica, 36(3): 109-118.
-
16MERIGÓ JM & GIL-LAFUENTE AM. 2011. Decision-making in sport management based on the OWA operator. Expert Systems with Applications, 38(8): 24-28.
-
17MÜLLER O, SIMONS A & WEINMANN M. 2017. Beyond crowd judgments: Data-driven estimation of market value in association football. European Journal of Operational Research, 263(2): 611-624.
-
18MYERS BR. 2012. A proposed decision rule for the timing of soccer substitutions.Journal of Quantitative Analysis in Sports, 8(1).
-
19OZCEYLAN EO. 2016. A mathematical model using ahp priorities for soccer player selection: a case study. South African Journal of Industrial Engineering, 27(2): 190-205.
-
20PANTUSO G. 2017. The Football Team Composition Problem: A Stochastic Programming approach. Journal of Quantitative Analysis in Sports, 13(3): 113-129.
-
21QADER MA, ZAIDAN BB, ZAIDAN AA, ALI SK, KAMALUDDIN MA & RADZI WB. 2017. A methodology for football players selection problem based on multimeasurements criteria analysis. Measurement: Journal of the International Measurement Confederation, 111: 38-50.
-
22TAVANA M, AZIZI F, AZIZI F & BEHZADIAN M. 2013. A fuzzy inference system with application to player selection and team formation in multi-player sports. Sport Management Review, 16(1): 97-110.
-
23WRIGHT MB. 2009. 50 years of OR in sport. Journal of the Operational Research Society, 60(S1): 161-168.
Publication Dates
-
Publication in this collection
23 Sept 2019 -
Date of issue
May-Aug 2019
History
-
Received
11 June 2018 -
Accepted
14 May 2019

 Source: The authors (2018).
 Source: The authors (2018).
 Source: The authors (2018).
 Source: The authors (2018).
 Source:
  Source:
 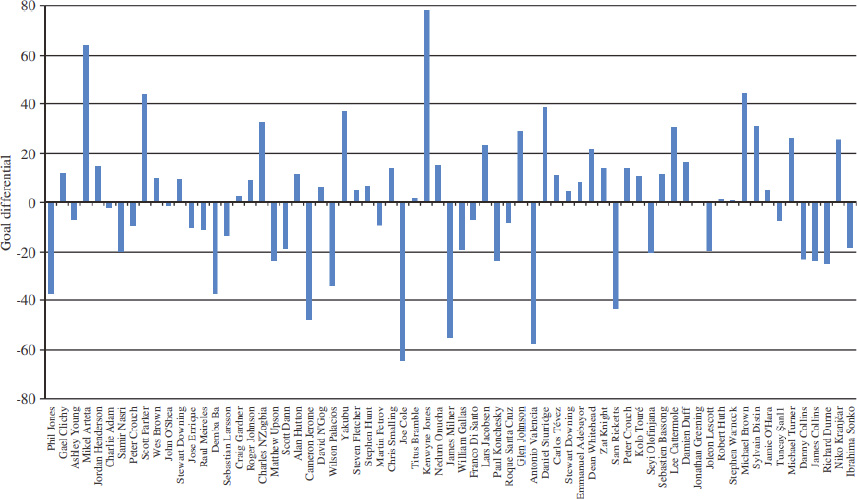 Source:
  Source:
  Source: