
ABSTRACT
The Flexible and Interactive Tradeoff (FITradeoff) method is a multicriteria decision making/aiding (MCDM/A) method that uses partial information about the decision maker’s (DM’s) preferences in order to build a recommendation. This method preserves the strong axiomatic structure of the traditional tradeoff procedure, with an interactive and flexible process that demands less cognitive effort from the DM. Although FITradeoff has already been applied for aiding several practical decision situations, there is no previous study that tests the performance of this method with respect to expected theoretical benefits such as time and effort reduction. In this context, this paper presents the results of a simulation experiment that aims to analyze the behavior of FITradeoff in a wide range of scenarios. Computational constraints were identified in the simulation process, such as the number of simulations for each iteration. Despite the memory limitation of the software used, the number of total simulations performed was greater than what is commonly found in literature. We investigate how the performance of FITradeoff can be affected by changes in number of criteria, number of alternatives and weight pattern, and therefore it is possible to have a deeper understanding of the method and its main features. Therefore, this work focuses on studying, through simulations, the behavior of the multicriteria method FITradeoff, developed by De Almeida et al. (20167 DE ALMEIDA AT, ALMEIDA JA, COSTA APCS & ALMEIDA-FILHO AT. 2016. A new method for elicitation of criteria weights in additive models: Flexible and interactive tradeoff. European Journal of Operational Research 250: 179-191.), filling a lack in the literature by analyzing said method in a wide array of scenarios by a simulation process in order to bring a better understanding of the method, as well as to validate it in a simulation study.
Keywords:
multi-criteria decision analysis; FITradeoff method; simulation experiments
1 INTRODUCTION
Multi-criteria decision support methods (MCDA) have emerged to facilitate decision-makers (DMs) learning and understanding of problems that deal with multiple, often conflicting, criteria, and to structure the decision-making process in order meet all the required criteria and to minimize the potential for regret after a decision is made (Belton & Stewart, 20023 BELTON V & STEWART T. 2002. Multiple Criteria Decision Analysis: An Integrated Approach. Springer Science & Business Media.).
Among various multicriteria methods, those of additive aggregation, which are based on the Multiatribute Value Theory (MAVT), are highlighted due to being widely used for their strong axiomatic base, with the global value of an alternative being obtained from the following equation 1 (Zheng & Lienert, 201733 ZHENG J & LIENERT J. 2017. Stakeholder Interviews with Two MAVT Preference Elicitation Philosophies in a Swiss Water Infrastructure Decision: Aggregation Using SWING Weighting and Disaggregation Using UTA. European Journal of Operational Research. 0 0 0 1-15.; Lima, 201720 LIMA ES, VIEGAS RA & COSTA APCS. 2017. A Multicriteria Method Based Approach to the BPMM Selection Problem. IEEE International Conference on Systems, Man, and Cybernetics (SMC). Banff Center, Banff, Canada.; Frej et al., 201913 FREJ EA, DE ALMEIDA AT & COSTA APCS. 2019. Using data visualization for ranking alternatives with partial information and interactive tradeoff elicitation. Operational Research, 1-23.), where v (a j ) is the global value of alternative a j for the decision maker, k i is the scale constant of criterion i and v i (x ij ) is the value of the performance of alternative a j in criterion i(x ij ) normalized in a 0-1 scale.
Criteria scale constants are normalized according to equation 2 below.
In additive models, the definition of the values of the scale constants is a complex and very important issue, since weights do not only represent the degree of importance of the criteria, but there is also a scaling factor related to the values of the consequences. Due to these factors, the determination of scale constants is considered as the core of any decision-making process in additive models (De Almeida et al., 20167 DE ALMEIDA AT, ALMEIDA JA, COSTA APCS & ALMEIDA-FILHO AT. 2016. A new method for elicitation of criteria weights in additive models: Flexible and interactive tradeoff. European Journal of Operational Research 250: 179-191.; De Almeida et al., 20158 DE ALMEIDA AT, CAVALCANTE CAV, ALENCAR MH, FERREIRA RJP, DE ALMEIDA-FILHO AT & GARCEZ TV. Multicriteria and Multiobjective Models for Risk, Reliability and Maintenance Decision Analysis. International Series in Operations Research & Management Science. Vol 231. New York: Springer, 2015.).
One of the main procedures for elicitation of criteria scale constants in additive models is the traditional tradeoff procedure, developed by Keeney & Raiffa (197617 KEENEY RL & RAIFFA H. 1976. Decision Analysis with Multiple Conflicting Objectives. Wiley & Sons, New York.) and considered the one with the strongest theoretical basis, and it also allows the use of a nonlinear intracriteria value function, differing from most others procedures (Weber & Borcherding, 199331 WEBER M & BORCHERDING K. 1993. Behavioral Influences on Weight Judgments in Multiattribute Decision Making. European Journal of Operational Research 67(1): 1-12.).
Despite the advantages of the tradeoff procedure, this method is not widely used because it demands the DM to give complete information in order to pinpoint the exact indifference between two consequences, which increases the cognitive effort of the process, generating high rates of inconsistency when applied (De Almeida et al., 20167 DE ALMEIDA AT, ALMEIDA JA, COSTA APCS & ALMEIDA-FILHO AT. 2016. A new method for elicitation of criteria weights in additive models: Flexible and interactive tradeoff. European Journal of Operational Research 250: 179-191.; Borcherding et al., 19914 BORCHERDING K, EPPEL T & VON WINTERFELDT D. 1991. Comparison of Weighting Judgments in Multiattribute Utility Measurement. Management Science 37(12).).
Complete information methods require the decision maker to have a well-defined and stable preference structure, which makes the process cognitively demanding, since it requires a lot of precision, time and effort from the DM (Belton & Stewart, 20023 BELTON V & STEWART T. 2002. Multiple Criteria Decision Analysis: An Integrated Approach. Springer Science & Business Media., Larsson et al., 201519 LARSSON A, RIABACKE M, DANIELSON M, EKENBERG L. 2015. Cardinal and rank ordering of criteria addressing prescription within weight elicitation. International Journal of Information Technology & Decision Making 14(06): 1299-1330.). The DM’s difficulty translates into high rates inconsistencies such as those found in the tradeoff procedure (Weber & Borcherding, 199331 WEBER M & BORCHERDING K. 1993. Behavioral Influences on Weight Judgments in Multiattribute Decision Making. European Journal of Operational Research 67(1): 1-12.) and may explain the discrepancy between the number of theoretical models used in decision making in relation to their actual applications (Weber, 198730 WEBER M. 1987. Decision making with incomplete information. European Journal of Operational Research 28(1): 44-57.).
In order to reduce cognitive effort during the elicitation of scale constants, several partial information methods were developed. Within the context of decision making, partial information situations are classified as circumstances in which the decision maker may be unable to specify their preferences with the detail required by traditional methods. The use of partial information also allows the DM to show his current form of structure of preferences that are permanently changing through learning and thinking (Marmol et al., 200221 MÁRMOL AM, PUERTO J & FERNÁNDEZ FR. 2002. Sequential incorporation of imprecise information in multiple criteria decision processes. European Journal of Operational Research 137(1): 123-133.; Kirkwood & Sarin, 198518 KIRKWOOD CW & SARIN RK. 1985. Ranking with partial information: a method and an application. Operations Research 33(1): 38-48.; Weber, 198730 WEBER M. 1987. Decision making with incomplete information. European Journal of Operational Research 28(1): 44-57.).
A wide variety of partial information methods that consider partial information can be found in the literature. Weber (198529 WEBER M. 1985. A method of multiattribute decision making with incomplete information. Management Science 31(11): 1365-1371.) created the Holistic Orthogonal Parameter of Incomplete Estimation (HOPIE) method, which presents the DM with a set of hypothetical alternatives, among which several pairwise comparisons are made, and further restrictions may be imposed on the utility function by assigning from value ranges to the alternatives. Salo & Hamalainen’s (199226 SALO AA & HÄMÄLÄINEN RP. 1992. Preference assessment by imprecise ratio statements. Operations Research 40(6): 1053-1061.) method PAIRS (Preference Assessment for Inaccurate Ratio Assertions) processes inaccurate statements of relative importance in dominance relationships and provides support for maintaining the consistency of the preference model by calculating the bounds of consistency. Edwards & Barron’s (199411 EDWARDS W & BARRON FH. 1994. SMARTS and SMARTER: improved simple methods for multiattribute utility measurement. Organizational behavior and human decision processes 60(3): 306-325.) SMARTER method obtains ordinal information about the relative importance of the criteria through a SWING weighting process, which is then converted to numerical weights using the ROC method. In Salo & Hamalainen’s (200127 SALO AA & HÄMÄLÄINEN RP. 2001. Preference ratios in multiattribute evaluation (PRIME) Elicitation and decision procedures under incomplete information. IEEE Transactions on Systems, Man, and Cybernetics-Part A: Systems and Humans 31(6): 533-545.) PRIME (Preference Ratios of Preference in Multi-Attributes Appraisal) method, the DM provides preference statements through holistic comparisons of alternatives, ordinal force of preference judgments or proportions of differences in value, seeking to balance the theoretical solidity of the Tradeoff procedure and the functionality of judgments through reason. The RICH method (Classification of Inclusion in Criteria Hierarchies), developed by Salo & Punkka (200528 SALO A & PUNKKA A. 2005. Rank inclusion in criteria hierarchies. European Journal of Operational Research 163(2): 338-356.), allows the decision maker to deal with incomplete information by specifying the subset of criteria that contains the most important criterion, and the decision recommendations are obtained through dominance relations and decision rules.
The FITradeoff method (de Almeida et al., 20167 DE ALMEIDA AT, ALMEIDA JA, COSTA APCS & ALMEIDA-FILHO AT. 2016. A new method for elicitation of criteria weights in additive models: Flexible and interactive tradeoff. European Journal of Operational Research 250: 179-191.) conducts elicitation of criteria scaling constants based on a flexible and interactive elicitation process with less cognitive effort from the DM. Therefore, the rate of inconsistencies tends to be lower, as instead of pointing points of indifference, the DM provides strict preference relations, while the strong axiomatic structure of the tradeoff is maintained, allowing for the inclusion of a nonlinear intracriteria value function (Gusmão & Medeiros, 201610 DE GUSMÃO APH, MEDEIROS CP. 2016. A model for selecting a strategic information system using the FITradeoff. Hindawi Publishing, Corporation Mathematical Problems in Engineering.; De Almeida et al., 20167 DE ALMEIDA AT, ALMEIDA JA, COSTA APCS & ALMEIDA-FILHO AT. 2016. A new method for elicitation of criteria weights in additive models: Flexible and interactive tradeoff. European Journal of Operational Research 250: 179-191.).
The FITradeoff method (De Almeida et al., 20167 DE ALMEIDA AT, ALMEIDA JA, COSTA APCS & ALMEIDA-FILHO AT. 2016. A new method for elicitation of criteria weights in additive models: Flexible and interactive tradeoff. European Journal of Operational Research 250: 179-191.) was successfully applied in several practical cases of MCDM, in most diverse themes. Frej et al. (201714 FREJ EA, ROSELLI LRP, DE ALMEIDA JA & DE ALMEIDA AT. 2017. A Multicriteria Decision Model for Supplier Selection in a Food Industry Based on FITradeoff Method. Mathematical Problems in Engineering.) applied it in the selection of suppliers; Kang et al. (201816 KANG TAH, SOARES JÚNIOR ADC & DE ALMEIDA AT. 2018. Evaluating Electric Power Generation Technologies: A Multicriteria Analysis Based on The FITradeoff Method. Energy.) and Fossile et al (202012 FOSSILE DK, FREJ EA, DA COSTA SEG, DE LIMA EP & DE ALMEIDA AT. (2020). Selecting the Most Viable Renewable Energy Source for Brazilian Ports Using the FITradeoff method. Journal of Cleaner Production, 121107.) in the field of energy; Carrillo et al (20185 CARRILLO PAA, ROSELLI LRP, FREJ EA & DE ALMEIDA AT. 2018. Selecting an agricultural technology package based on the flexible and interactive tradeoff method. Annals of Operations Research 1-16.) in agriculture problems; Roselli et al. (201924 ROSELLI LRP, DE ALMEIDA AT & FREJ EA. 2019. Decision neuroscience for improving data visualization of decision support in the FITradeoff method. Operational Research 19: 1-21.) in the field of neuroscience; and Pergher et al. (202022 PERGHER I, FREJ EA, ROSELLI LRP & DE ALMEIDA AT. (2020). Integrating simulation and FITradeoff method for scheduling rules selection in job-shop production systems. International Journal of Production Economics 227: 107669.) in scheduling rules problems. Despite the positive results of these (and other) applications, so far, no studies have used successive simulations in order to generate a large amount of data and investigate the performance of the FITradeoff method in reducing questions asked during the elicitation phase.
Therefore, this work focuses on studying, throughout simulations, the behavior of the FITradeoff method developed by De Almeida et al. (20167 DE ALMEIDA AT, ALMEIDA JA, COSTA APCS & ALMEIDA-FILHO AT. 2016. A new method for elicitation of criteria weights in additive models: Flexible and interactive tradeoff. European Journal of Operational Research 250: 179-191.), filling a lack in the literature by analyzing said method in a wide array of scenarios, in order to bring a better understanding of the method, as well as to validate it in a simulation study.
This paper is organized in the following manner. First, the FITradeoff method is detailed in Section 2. Then, Section 3 presents the research questions that this paper aims to investigate. In Section 4, the design of the experiment is shown, and Section 5 presents the results of the experiment; finally, in Section 6 the results found are discussed and Section 6 presents the main conclusions of this work.
2 FLEXIBLE AND INTERACTIVE TRADEOFF (FITRADEOFF)
The FITradeoff preferences elicitation process selects, based on the partial information obtained from the DM, a subset of potentially optimal alternatives (POAs), allowing the DM great flexibility as it can interrupt the decision making process at any time. The comparison of consequences is made according to the statements of strict preference relations indicated by the DM, in order to calibrate the process, making it easier for the DM to state his indifference points when necessary. This method does not require exact indifference statements to be provided, in such a way that a reduction in cognitive effort is expected (De Almeida et al., 20167 DE ALMEIDA AT, ALMEIDA JA, COSTA APCS & ALMEIDA-FILHO AT. 2016. A new method for elicitation of criteria weights in additive models: Flexible and interactive tradeoff. European Journal of Operational Research 250: 179-191.; Roselli et al., 201924 ROSELLI LRP, DE ALMEIDA AT & FREJ EA. 2019. Decision neuroscience for improving data visualization of decision support in the FITradeoff method. Operational Research 19: 1-21.).
To exemplify the elicitation process of the FITradeoff method, consider the following situation: in a generical multicriteria decision problem, four hypothetical criteria are analyzed. The consequences of these criteria represent the best (bi) to worst (wi) performance for criterion i, while an intermediate performance is represented by xi, given the preference relation bi P xi P wi. It is assumed, by definition, that the value of the best consequence of criterion i, v(bi), is equal to 1 and the value of the worst consequence v(wi) is equal to 0, as illustrated by Figure 1. Let us assume that the DM has ordered the criteria scaling constants, and that he stated that .

Comparison of Consequences in the FITradeoff Method (adapted from De Almeida et al., 20167 DE ALMEIDA AT, ALMEIDA JA, COSTA APCS & ALMEIDA-FILHO AT. 2016. A new method for elicitation of criteria weights in additive models: Flexible and interactive tradeoff. European Journal of Operational Research 250: 179-191.).
Consequence Z has the worst performance for criteria 1, 3 and 4 and the best performance for criterion 2, while consequence Y has the worst performance for criteria 2, 3 and 4 and an intermediate performance for criterion 1, which means that:
In Figure 1, for example, if point is the point of indifference between the two consequences, the DM will declare preference for consequence Y if x1 = x1 u , so that the value of consequence Y in this case is greater than the value of consequence Z, which leads to the inequality in (5). If the value of x1 = x1 l , then the DM will declare preference for consequence Z, which leads to the inequality in (6).
The inequalities are then used to construct the space of the scale constants (φn ):
The values that the scale constants of the criteria can assume are limited from the constraints formed by the DM’s preferences in relation to the analyzed pairs of consequences. Then, a linear programming model (LPP) proposed by de Almeida et al. (20167 DE ALMEIDA AT, ALMEIDA JA, COSTA APCS & ALMEIDA-FILHO AT. 2016. A new method for elicitation of criteria weights in additive models: Flexible and interactive tradeoff. European Journal of Operational Research 250: 179-191.) is run to verify, at each iteration, which alternatives are still potentially optimal, with the process ending when only a single element remains in the subset.
The following flowchart (Figure 2) summarizes the FITradeoff elicitation process.

FITradeoff Elicitation Process (adapted from De Almeida et al., 20167 DE ALMEIDA AT, ALMEIDA JA, COSTA APCS & ALMEIDA-FILHO AT. 2016. A new method for elicitation of criteria weights in additive models: Flexible and interactive tradeoff. European Journal of Operational Research 250: 179-191.).
As shown in the flowchart, the elicitation is conducted with the DM through an interactive and flexible process, as with each question asked, the model tries to find a solution to the problem, with the possibility of interrupting the elicitation procedure as soon as possible (De Almeida et al., 20167 DE ALMEIDA AT, ALMEIDA JA, COSTA APCS & ALMEIDA-FILHO AT. 2016. A new method for elicitation of criteria weights in additive models: Flexible and interactive tradeoff. European Journal of Operational Research 250: 179-191.).
3 RESEARCH QUESTIONS
In this study, we aim to investigate how the FITradeoff method behaves regarding number of questions made for DMs in order to find a unique optimal solution, which is a measure of effort during the elicitation process. A decision process that demands too many questions from the DM has a high cognitive cost, which means the process becomes long and difficult for the DM, and possibly increasing the inconsistencies rate during the process (Holloway & White III, 200315 HOLLOWAY HA & WHITE III CC. 2003. Question selection for multi-attribute decision-aiding. European Journal of Operational Research 148(3): 525-533.; Borcherding et al., 19914 BORCHERDING K, EPPEL T & VON WINTERFELDT D. 1991. Comparison of Weighting Judgments in Multiattribute Utility Measurement. Management Science 37(12).).
In order to analyze the FITradeoff method regarding its performance, it is important to, first of all, define benchmarks on the number of questions asked during the elicitation process. Here we consider the traditional tradeoff procedure for building those benchmarks. In the traditional tradeoff procedure, at least N-1 questions are required to be answered in order to find a recommendation for the DM (Keeney & Raiffa, 197617 KEENEY RL & RAIFFA H. 1976. Decision Analysis with Multiple Conflicting Objectives. Wiley & Sons, New York.), in which N is the number of criteria. These questions correspond to indifference statements given by the DM. This means that, for example, a problem with 5 criteria would have a minimum of 4 questions to be considered as the benchmark for said problem. Behaviorally speaking, however, it is more appropriate to ask preference questions before asking the indifference point directly. By considering two preference questions before the indifference statement, above and below the indifference point, it would be necessary to make at least 3(N-1) questions for the DM. In the same example, given a problem with 5 criteria, a more appropriate benchmarking would be 12 questions, and these questions are considered easier to answer than those that demand a precise point of indifference from the decision maker. Therefore, it is suggested that 3(N-1) questions would better suit as a benchmark (de Almeida et al., 20167 DE ALMEIDA AT, ALMEIDA JA, COSTA APCS & ALMEIDA-FILHO AT. 2016. A new method for elicitation of criteria weights in additive models: Flexible and interactive tradeoff. European Journal of Operational Research 250: 179-191.). We therefore consider both measures (N-1) and 3(N-1) in our evaluation.
In addition, it is also important to analyze the variation in the number of questions with regard to changes in the number of criteria, number of alternatives and pattern distribution of weights. Therefore, some research questions (RQ) were defined in order to better orientate this paper and its experiment. The questions investigated by this research are described below, with the results of said questions being presented in Section 5.
RQ1: What is the percentage of problems that can be solved by FITradeoff method using only the information of criteria scale constants order?
As shown in Figure 2, step 2 of FITradeoff consists in the ranking of criteria scaling constants, and therefore inequalities of type are obtained. This research question aims to analyze how often a single optimal solution can be found by considering only this information from the DM, and no additional information. Solving the problem only with the information of criteria weights ranking is a particular case in which minimal effort is required from the DM, and thus lots of time and effort can be saved in the elicitation process.
RQ2: How does the pattern distribution of scale constants values affect the number of questions asked by FITradeoff?
This question was defined by the need to investigate how the values of scale constants, one of the most important parts of a decision problem, affect FITradeoff’s performance in relation to the number of questions the decision maker needs to answer. Four types of weight pattern were chosen as to broaden the research, by analyzing a weight distribution where all the weights are the same, one that is more uniform and two others that are not uniform. Such weight patterns are further detailed in the next section. With this, it will be possible to present a broad analysis of how FITradeoff behaves in different weights distributions scenarios.
RQ3: By considering benchmarks of (N-1) and 3(N-1), how reasonable is it to say that FITradeoff solves problems with fewer questions than the traditional tradeoff?
This question provides insights into the advantage of the FITradeoff over the traditional tradeoff by showing how the method behaves concerning those two benchmarks. The first benchmark was chosen as it is traditionally used in most cases, including the tradeoff procedure. The second benchmark was chosen because it better represents real situations, as it is cognitively easier for the DM to answer questions related to strict preference relations rather than harder ones related to indifference points. This may lead to a reduction of inconsistencies by making the DM judgment more consistent through a calibration of the process, which leads to a benchmarking of 3(N-1) questions.
RQ4: How is the number of questions asked to the decision maker influenced by an increase in the number of alternatives?
This research question aims to investigate how the increase in the number of alternatives affects FITradeoff’s performance with regards to the number of questions the decision maker needs to answer to find an optimal solution. Since in problems with a high number of alternatives, many of them may be dominated, it is expected that the influence of the increase in the number of alternatives will not lead to a huge increase in the number of questions the DM needs to answer in order to find an optimal alternative.
RQ5: How is the number of questions asked to the decision maker influenced by an increase in the number of criteria?
This question seeks to analyze how the increase in the number of criteria influences the performance of FITradeoff with regards to the number of questions that the DM needs to answer. Seeing that problems with many criteria tend to be more complex and demand more effort from the DM, it is expected that those kinds of problems will require more questions in order to find a solution than problems with few criteria.
4 DESIGN OF THE EXPERIMENT
Before introducing the design and modeling of our simulation experiment, it is worth mentioning previous studies that have also used simulation tools in order to better understand the test and the behavior of MCDM techniques. Barron and Barret (19962 BARRON FH & BARRETT BE. 1996. Decision Quality Using Ranked Attribute Weights. Management Science 42(11):1515-1523.) analyzed the quality of decisions to use different weights through a simulation study that includes criteria ranging from {3, 6, 9, 12, 15} and alternatives varying from {5, 10, 15, 20, 25}, giving rise to 100 arrays of random value, as well as 100 sets of random weights, thus generating 10,000 problems. The study demonstrated that choosing the distribution to generate random and non-scaled values does not produce large qualitative differences in results. The simulation study done by Ahn & Park (20081 AHN BS & PARK KS. 2008. Comparing Methods for Multiattribute Decision Making with Ordinal Weights. Computers & Operations Research 35: 1660-1670.) to validate a new approach in which the use of dominance of alternatives replaced the development of approximate weights, involved four different levels of alternatives (3, 5, 7, 10) and five different attribute levels (3, 5, 7, 10, 15). The process of generating and analyzing decision problems was repeated until 10 replications of 10,000 attempts were obtained, generating a total of 2,000,000 of simulations. To evaluate several models using surrogate weights, Danielson & Ekenberg (20166 DANIELSON M, EKENBERG L. 2016. The CAR Method for Using Preference Strength in Multi-criteria Decision Making. Group Decision and Negotion 25: 775.) worked with a variable number of criteria (3, 6, 9, 12) and alternatives (3, 6, 9, 12, 15) generating a total of 20 simulation scenarios, each being simulated 10 times, each time with 10,000 attempts, generating a total of 2,000,000 simulations.
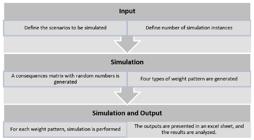
The design of the experiment to evaluate the performance of the FITradeoff method was based in the works of Barron & Barret (19962 BARRON FH & BARRETT BE. 1996. Decision Quality Using Ranked Attribute Weights. Management Science 42(11):1515-1523.), Ahn & Park (20081 AHN BS & PARK KS. 2008. Comparing Methods for Multiattribute Decision Making with Ordinal Weights. Computers & Operations Research 35: 1660-1670.) and Danielson & Ekenberg (20166 DANIELSON M, EKENBERG L. 2016. The CAR Method for Using Preference Strength in Multi-criteria Decision Making. Group Decision and Negotion 25: 775.), and it is shown by the flowchart (Figure 3) below, which gives a summary of said design. The software used to make the simulations was developed in the Center for Decision System and Information (CDSID). The proposed experiment assumes that the problematic posed by the problems was that of choice (P.α), which seeks to aid the DM to choose a single alternative in a subset that is as small as possible (Roy, 199625 ROY B. 1996. Multicriteria Methodology for Decision Aiding. Berlim, Heidelberg, Springer Science & Business Media, 293p.).
Despite being based on previous works, the design of this experiment was unique, as the program utilized was made to attend the objectives set in this research. Therefore, to start designing this experiment, it was necessary to determine what would be the variation in the number of criteria, the variation in the number of alternatives, as well as the forms of weights that would be used, as detailed in the next subsections.
4.1 Definition of the forms of weights standards to be simulated
For this variation on weights standards to bring a broad analysis, it was considered necessary to use uniform and non-uniform weight forms as well as a weight standard where all weights were equal, which means that the optimal solution would be found immediately without any additional information provided by the DM. Thus, the variation of the weights standards to be used was:
-
1. Weight Pattern 1: Equal weights.
-
i.
-
2. Weight Pattern 2: Random weights, with a more uniform distribution, and the following restrictions:
-
i.
-
ii.
-
3. Weight Pattern 3: Random weights, with the following restrictions:
-
i.
-
ii.
-
4. Weight Pattern 4: Random weights, with the following restrictions:
-
i.
-
ii.
An example of the behavior of these weights patterns for a problem with 5 criteria is provided by Figure 4, to illustrate the four different weight patterns that were used in the simulation process.

4.1 Definition of the number of criteria and alternatives to be simulated
Empirically, it is possible to observe that most MCDA problems found in the literature do not deal with a very high number of criteria (above 7), since problems with many criteria have a great chance of having preferential dependence relationships and/or redundancy. Such preferential dependence relations and the existence of redundant criteria should be verified, however, before starting the elicitation process, in the problem structuring phase (de Almeida et al., 20158 DE ALMEIDA AT, CAVALCANTE CAV, ALENCAR MH, FERREIRA RJP, DE ALMEIDA-FILHO AT & GARCEZ TV. Multicriteria and Multiobjective Models for Risk, Reliability and Maintenance Decision Analysis. International Series in Operations Research & Management Science. Vol 231. New York: Springer, 2015.). Despite this, simulation scenarios with a high number of criteria can be considered, in order to analyze the behavior of the method in these rarer situations. Therefore, to analyze the variation that the increase in criteria causes in the performance of FITradeoff in relation to the number of questions asked to the decision maker, it was defined that the following numbers of criteria would be used: .
In order to verify how much the number of questions asked by FITradeoff is influenced by an increase in the number of alternatives, a wide range of variation was considered for alternatives amount. It is plausible to assume that a problem with less than 5 alternatives would be too much simple, while a problem with more than 70 alternatives would be uncommon in practice, since many of these could be dominated by others and therefore would not be part of the multicriteria analysis. Therefore, the following amounts of alternatives were considered in or analysis: .
4.2 Definition of simulation scenarios
Based on combinations of the different weights patterns, number of alternatives and number of criteria described above, several simulation scenarios were created. As problems with 5 criteria are usually common in the literature, it was defined that N = 5 would be combined with all possible values of M and all possible weights patterns. In order to be able to analyze all the criteria in general, it was established that all the numbers of criteria studied would be simulated for problems with an average number of alternatives, M = {20, 30}. In order to avoid a biased study (negatively or positively), simulation scenarios with many criteria and many alternatives or simulation scenarios with few criteria and few alternatives were not considered.
In this way, 120 simulation scenarios were created, as described in Table 1 Simulated Scenarios. A number of 3,000 instances was established, replicated 40 times for each of the simulated scenarios, that is, a total of 120,000 iterations were made per simulated scenario. Therefore, a total of 14,400,000 different problems were simulated. This sample was considered large enough for the purpose of this research, to study the behavior of FITradeoff in relation to the issues described.
After the initial stage of Input, the simulation began. In the simulation process, each consequence matrix generated with random numbers simulated the FITradeoff method for each weight pattern analyzed. The outputs were presented in an excel (.xlsx) sheet, the results were later analyzed and presented in the form of line charts, as described in the next topic.
5 SIMULATION RESULTS
In this section, we describe the results reached by the simulation experiment. The results will be presented in such a way to answer the research questions described in Section 3.
5.1 RQ1: What is the percentage of problems that can be solved by FITradeoff method using only the information of criteria scale constants order?
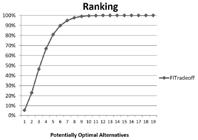
The graphic in Figure 5 is a summary of the results obtained by considering all simulated scenarios. In the X axis, the number of potentially optimal alternatives obtained by FITradeoff only with the information of criteria weights is displayed; and the Y axis is the correspondent percentage of cases. By analyzing this graphic, it is possible to see that 5% of the cases can be solved (i.e., results in a unique potentially optimal alternative) only with the information of the ranking of criteria weights. It is also possible to see that, in 81% of cases, the problem comes down to 5 potentially optimal alternatives after criteria weights ranking. Moreover, in 97% of cases, up to 8 potentially optimal alternatives are left. These results indicate that, by solving an MCDM problem with the FITradeoff method, the set of potentially optimal alternatives is substantially reduced by using only the information of criteria weights order, which is minimal effort from DMs.
5.2 How does the pattern distribution of scale constants values affect the number of questions asked by FITradeoff?
The results have shown that the distribution of the values of the scale constants (or pattern of the weights) is the factor that most affects FITradeoff’s performance regarding the number of questions to be answered by the DM. It was observed that the results found in the weight pattern 2 (more uniform) are better than those found by the forms of weights 3 and 4, that is, with a more uniform weight pattern, a solution can be found with fewer questions. As for the weight distributions 3 and 4, in most cases, there were no significant variations in the amount of questions asked. Figures 6 and 7 graphically demonstrate these results.

Results of the simulation experiment regarding the different weight patterns for problems with 3, 4 and 5 criteria.
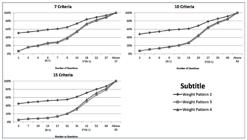
Results of the simulation experiment regarding the different weight patterns for problems with 7, 10 and 15 criteria.
For the weight pattern 2 (k1 = 1,5kN), a solution was found with: 6 questions for 3 criteria problems (approximately 92% of cases); 11 questions for 4 criteria problems (approximately 93% of cases); 15 questions for problems with 5 criteria (approximately 91% of cases).
As for weight patterns 3 and 4, which in all cases, with the exception of cases with 3 criteria, showed no significant differences between the problems analyzed, a solution was found with: 9 questions for problems with 3 criteria (approximately 91% of cases); 13 questions for problems with 4 criteria (approximately 89% of cases); 18 questions for problems with 5 criteria (approximately 88% of cases).
In weight pattern 2 (k1 = 1,5kN), a single solution was found with: 18 questions for 7 criteria problems (approximately 81% of cases); 27 questions for 10 criteria problems (approximately 76% of cases); 42 questions for problems with 15 criteria (approximately 66% of cases).
The Weight Pattern 3 and Weight Pattern 4 found a single solution with: 27 questions for 7 criteria problems (approximately 86% of cases); 40 questions for 10 criteria problems (approximately 81% of cases); 52 questions for 15 criteria problems (approximately 60% of cases).
5.3 By considering benchmarks of (N-1) and 3(N-1), how reasonable is it to say that FITradeoff solves problems with fewer questions than the traditional tradeoff?
To answer this question, a comparison between two benchmarks was made. The first benchmark is the minimum number of questions for the traditional tradeoff procedure (N-1 questions), as previously explained. The second one is considering two preference statements before getting into the indifference point, which results in 3(N-1) questions, as mentioned in Section 3.
It was observed that, for N criteria, the method can find a solution for most cases with up to 3(N-1) questions, validating one of the advantages of FITradeoff in finding a single solution with questions that are considered easier to answer than the ones of the traditional tradeoff. A comparison between the two benchmarks is shown in Figure 8.

As shown in Figure 8, for problems with weight pattern 2, the following results were found: with the first benchmark (N-1 questions), a solution was found in approximately 71% of cases with 3 criteria; 62% of cases with 4 criteria; 63% of cases with 5 criteria; 59% of cases with 7 criteria; 58% of cases with 10 criteria and 52% of cases with 15 criteria. For the second benchmark (3(N-1) questions), a solution was found in approximately 92% of cases with 3 criteria; 89% of cases with 4 criteria; 88% of cases with 5 criteria; 84% of cases with 7 criteria; 79% cases with 10 criteria and 71% of cases with 15 criteria.
With weight pattern 3, it was verified that, with the N-1 benchmark, a solution was found in approximately 35% of cases with 3 criteria, 31% of cases with 4 criteria, 31% of cases with 5 criteria, 24% of cases with 7 criteria, 16% of cases with 10 criteria and 10% of cases with 15 criteria. With the 3(N-1) benchmark, a solution was found in approximately 75% of cases with 3 criteria, 74% of cases with 4 criteria, 75% of cases with 5 criteria, 71% of cases with 7 criteria, 67% cases with 10 criteria and 49% of cases with 15 criteria. Similarly, the results found in cases with weight standard 4 showed that with the N-1 benchmark a solution was found in approximately 20% of cases with 3 criteria, 30% of cases with 4 criteria, 32% of cases with 5 criteria, 27% of cases with 7 criteria, 17% of cases with 10 criteria and 10% of cases with 15 criteria. With 3(N-1) benchmark, a solution was found in approximately 71% of cases with 3 criteria, 75% of cases with 4 criteria, 77% of cases with 5 criteria, 74% of cases with 7 criteria, 65% cases with 10 criteria and 54% of cases with 15 criteria.
When looking at the N-1 benchmark, there was some variation in the results of problems with 3 criteria, but, overall, the results of the weight pattern 3 and weight pattern 4 were very similar.
5.4 How is the number of questions asked to the decision maker influenced by an increase in the number of alternatives?
The simulation experiment showed that an increase in the number of alternatives has little influence on the number of questions asked to the DM, as shown in Figure 9.

The results for the weight pattern 2 showed that, when the number of alternatives was increased from 5 to 15, there was a decrease of 9% in the number of cases that were solved, considering the N-1 benchmark. This decrease was of 3% when considering the 3(N-1) benchmark. By increasing the number of alternatives from 15 to 30, there was a reduction of 4% in the number of problems solved, considering the N-1 benchmark, and of only 1% when considering the 3(N-1) benchmark. Finally, an increase from 30 to 70 alternatives resulted in a decrease of 3% in the number of problems solved for the N-1 benchmark and 1% for the 3(N-1) benchmark.
The results for the weight pattern 3 were very similar to those of weight pattern 4, and are represented as such: an increase in the number of alternatives from 5 to 15, resulted in a decrease of 13% in the number of problems solved, considering the N-1benchmark, with this decrease being of 6% when considering the 3(N-1) benchmark. The increase in the number of alternatives from 15 to 30 increased in 6% in the number of questions asked, considering the N-1 benchmark, and of 3% when considering the 3(N-1) benchmarking. Finally, an increase from 30 to 70 alternatives resulted in a reduction of 5% in the number of questions asked for the N-1 benchmark and 3% for the 3(N-1) benchmark.
5.5 How is the number of questions asked to the decision maker influenced by an increase in the number of criteria?
The experiment results demonstrated that by increasing the number of criteria there is a significant decrease in the number of problems resolved with fewer questions, especially in problems with a high number of criteria (N = {10, 15}). This was expected, as the complexity of a problem increases with the number of criteria, so does the cognitive effort of the process, meaning that the DM will need to answer more questions in order to find the optimal alternative. Figure 10 summarizes the results.

It was observed that, for the weight pattern 2, a problem with 3 criteria can resolve 72% of the cases with 2 questions, 92% of the problems with 6 questions and 100% of the problems with 18 questions. Increasing the number of criteria from 3 to 4, there is a decrease in the number of problems that are resolved in each interval of questions, as with 2 questions, 62% of the problems are resolved, with 6 questions, 80% and with 18 questions, 99%. Raising the number of criteria from 4 to 5, the following results were obtained: with 2 questions, 56% of the problems find a solution; with 6 questions, 70% of the problems find a solution, and finally, with 18 questions, 95% of the problems find a solution.
It was also shown that, going from 5 to 7 criteria, the results were: with 6 questions, 56% of the problems can be resolved; with 18 questions, 82% of the problems find a solution; with 27 questions, 93% of the problems find a solution and with 42 questions, 99% of the problems are resolved. By increasing the number of criteria from 7 to 10, the results were: with 6 questions, 51% of the problems can be resolved; with 18 questions, 63% of the problems find a solution; with 27 questions, 77% of the problems find a solution and with 42 questions, 92% of the problems are resolved. Finally, rising the number of criteria from 10 to 15, there is a significate decrease in the number of problems resolved: with 6 questions, 43% of the problems can be resolved; with 18 questions, 50% of the problems find a solution; with 27 questions, 55% of the problems find a solution and with 42 questions, 69% of the problems are resolved.
The results for the weight pattern 3 were very similar to those of weight pattern 4, and are presented as such: a problem with 3 criteria can resolve 42% of the cases with 2 questions, 78% of the problems with 6 questions and 100% of the problems with 18 questions. Increasing the number of criteria from 3 to 4, there is a decrease in the number of problems that are resolved in each interval of questions, as with 2 questions, 23% of the problems are resolved; with 6 questions, 58% and with 18 questions, 97%. Raising the number of criteria from 4 to 5, the following results were obtained: with 2 questions, 15% of the problems find a solution; with 6 questions, 41% of the problems find a solution, 90% of the problems were resolved with 18 questions, and finally, with 27 questions, 98% of the problems find a solution.
It was also possible to see that, by increasing the number of criteria from 5 to 7, the results were: with 6 questions, 20% of the problems can be resolved; with 18 questions, 68% of the problems find a solution; with 27 questions, 87% of the problems find a solution and with 42 questions, 98% of the problems are resolved. Augmenting the number of criteria from 7 to 10, the results were: with 6 questions, 10% of the problems can be resolved; with 18 questions, 34% of the problems find a solution; with 27 questions, 59% of the problems find a solution and with 42 questions, 85% of the problems are resolved. Finally, rising the number of criteria from 10 to 15, there is a significant decrease in the number of problems resolved: with 6 questions, 5% of the problems can be solved; with 18 questions, 12% of the problems find a solution; with 27 questions, 21% of the problems find a solution and with 42 questions, 45% of the problems are resolved.
6 DISCUSSIONS
This work presented a design of an experiment with numerical simulations for the FITradeoff method, focusing on the analysis of some factors considered of high importance for the method’s performance. The design of the experiment was based on the existing literature, and a large number of simulations performed allowed us to conduct a detailed analysis of factors such as weight distribution, increase in the number of criteria and alternatives. Thus, two groups of problems were assigned to the analysis of this experiment, one with alternatives ranging from 20, 30, 50 and 70, and criteria ranging from 3, 4 and 5, and the other with alternatives ranging from 5, 10, 15, 20 and 30, and criteria ranging from 5, 7, 10 and 15. With this, it became possible to identify how an increase in the number of alternatives and criteria affects the performance of FITradeoff with respect to the number of questions that the process demands of the DM. Four different weight patterns were simulated, so that it was possible to evaluate how the weight distribution affects the performance of the method.
Through the application of this experiment, promising results were found, which have shown that, in the ranking stage, in 98% of cases, FITradeoff is able to reduce problems with high number of alternatives and high number of criteria for problems with up to 8 potentially optimal alternatives.
It was also found that the method is very effective for problems with more uniform weight patterns, finding an optimal solution with fewer questions than for less uniform weight pattern. This is evident from the fact that the weight pattern 2 (k1 = 1,5kN) required far fewer questions to find a single potentially optimal alternative when compared to the weight patterns 3 (k1 = 4kN) and 4 (k1 = 10kN). It was observed that the difference found between weight patterns 3 and 4 is not significant.
Regarding the influence that the increase in the number of alternatives has on the number of questions to be answered, it was shown that, regardless of the weight pattern analyzed, this increase is only significant if we consider problems with few alternatives (5, 10 and 15). Therefore, for problems with more than 20 alternatives, this increase does not influence the decision process, which is consistent with the fact that in problems with many alternatives, most of them will be dominated. More specifically, the variation between 20 and 70 alternatives is insignificant for the weight pattern 2 (in the order of 3%) and little significant for the weight pattern 3 and 4 (in the order of 5%).
The results found by analyzing the increase in the number of criteria revealed that the lower the number of criteria, the fewer questions the DM will have to answer to find a solution. The best results were found in problems with 3, 4 and 5 criteria, which were able to find a single solution with approximately 6, 9 and 12 questions, respectively. The worst results were found in problems with 15 criteria, as for these problems, 22 to 63 questions were needed to find a solution. That is, considering that an increase in the number of criteria augments the complexity of the problem, which raises the cognitive effort of the produces for the DM, it can be inferred from the study by Borcherding et al. (19914 BORCHERDING K, EPPEL T & VON WINTERFELDT D. 1991. Comparison of Weighting Judgments in Multiattribute Utility Measurement. Management Science 37(12).) that the method inconsistency will be greater for problems with many criteria, as in the ones with 15 criteria. Since most multicriteria decision problems do not deal with a large quantity of criteria, the results of the FITradeoff method were considered to be positive.
The analysis of the benchmarks showed that, for weight pattern 2, the first benchmark (N-1) embraces 48% to 70% of cases (varying according to the number of criteria and alternatives), whereas for the weight patterns 3 and 4, this benchmark aggregates between 5% and 42% of cases (again, varying according to the number of criteria and alternatives). The results found with the benchmark 3(N-1) were in the range of 66% to 92% for weight pattern 2, and 42% to 78% for weight patterns 3 and 4. Therefore, the FITradeoff method can find a solution for most cases with up to 3(N-1) questions, validating one of its advantages, by finding a single solution with less and easier to answer questions than those of the traditional tradeoff.
Through this study, it was possible to realize that a variation in the weight pattern affects the performance of the FITradeoff method more intensely than a variation in the increase in number of criteria, which in turn influences the method more than an augmentation in the number of alternatives. Finally, this study made it possible to verify, through simulations, several points described in the FITradeoff method theory, bringing greater validation to the method, and filling a gap found in the literature, in relation to simulated studies with FITradeoff.
7 CONCLUSIONS
This work showed that, regarding the percentage of problems that can be solved by the FITradeoff method using only the information of criteria scale constants order, there is no variation between weight patterns 2, 3 and 4, with FITradeoff being able to give a recommendation in 5% of the cases. Also, in 97% of cases, the method reduces the number of potentially optimal alternatives up to 8 potentially optimal alternatives after criteria weights ranking.
When analyzing how the pattern distribution of scale constants values affect the number of questions asked by FITradeoff, it was possible to identify that weight patterns which are less uniform, like weight pattern 3 and weight pattern 4, did not performed as well as weight pattern 2, which is more uniform. This means that more uniform weight patterns can make a recommendation with less questions than less uniform weight patterns. Moreover, this work showed that for a problem with N criteria, FITradeoff was able to make a recommendation for most cases with up to 3(N-1) questions, which validates the advantage of the method in giving a recommendation to the DM with less - and easier to answer questions than the traditional tradeoff procedure.
On what concerns the way in which the number of questions asked to the decision maker is influenced by an increase in the number of alternatives, it was possible to observe that the influence of the increase of the number of alternatives is not much significant. In most cases, increasing the number of alternatives from 20 to 70 alternatives that is, increasing the number of alternatives 3 times and a half there is a small increase on the number of questions asked to the DM, which varies from 1% to 6%, depending on the weight pattern and number of criteria of the problem. This shows that a significant increase in the number of alternatives does not result in a proportional increase in the number of questions that will be asked, which proves the theoretical advantage of a method like FITradeoff, that is, a large number of alternatives has little impact on the cognitive difficulties of the elicitation process.
Regarding how the number of questions asked can be influenced by an increase in the number of criteria, the results obtained by this study showed that increasing the number of criteria does have an impact on the performance of the method with regards to the number of questions asked. For instance, in a problem with 20 alternatives, it was shown that going from 3 criteria to 15 criteria reduces the number of times the method was able to make a recommendation within the benchmark of 3(N-1) questions in 23% for problems with a uniform weight pattern and in 33% for problems with less uniform weight pattern. Taking into account that going from 3 to 15 criteria means an increase of 5 times in the number of criteria - and also the fact that problems with more than 7 criteria tend to be rare in practical situations -, it can be concluded that the FITradeoff method can perform well even with problems that present a large number of criteria.
In conclusion, the focus on a simulation study allowed this work to give an original contribution to the FITradeoff method, as it proved the method’s main theoretical advantage while at the same time, helped future researches with a greater understanding of the multicriteria method FITradeoff. Furthermore, this work provided contributions to the decision-making field as it presented a simulation study that differs from the studies found in the literature; it focused on the behavior of a multicriteria method and analyzed its main features, bringing a better understanding of the method’s performance in regards to the number of questions asked to the decision maker.
ACKNOWLEDGEMENTS
This study is part of a research program funded by the Higher Education Personnel Improvement Coordination (CAPES) and the Brazilian Research Council (CNPq).
References
-
1AHN BS & PARK KS. 2008. Comparing Methods for Multiattribute Decision Making with Ordinal Weights. Computers & Operations Research 35: 1660-1670.
-
2BARRON FH & BARRETT BE. 1996. Decision Quality Using Ranked Attribute Weights. Management Science 42(11):1515-1523.
-
3BELTON V & STEWART T. 2002. Multiple Criteria Decision Analysis: An Integrated Approach. Springer Science & Business Media.
-
4BORCHERDING K, EPPEL T & VON WINTERFELDT D. 1991. Comparison of Weighting Judgments in Multiattribute Utility Measurement. Management Science 37(12).
-
5CARRILLO PAA, ROSELLI LRP, FREJ EA & DE ALMEIDA AT. 2018. Selecting an agricultural technology package based on the flexible and interactive tradeoff method. Annals of Operations Research 1-16.
-
6DANIELSON M, EKENBERG L. 2016. The CAR Method for Using Preference Strength in Multi-criteria Decision Making. Group Decision and Negotion 25: 775.
-
7DE ALMEIDA AT, ALMEIDA JA, COSTA APCS & ALMEIDA-FILHO AT. 2016. A new method for elicitation of criteria weights in additive models: Flexible and interactive tradeoff. European Journal of Operational Research 250: 179-191.
-
8DE ALMEIDA AT, CAVALCANTE CAV, ALENCAR MH, FERREIRA RJP, DE ALMEIDA-FILHO AT & GARCEZ TV. Multicriteria and Multiobjective Models for Risk, Reliability and Maintenance Decision Analysis. International Series in Operations Research & Management Science. Vol 231. New York: Springer, 2015.
-
9DE ALMEIDA-FILHO AT, DE ALMEIDA AT & COSTA APCS. 2017. A flexible elicitation procedure for additive model scale constants. Annals of Operations Research 259(1-2): 65-83.
-
10DE GUSMÃO APH, MEDEIROS CP. 2016. A model for selecting a strategic information system using the FITradeoff. Hindawi Publishing, Corporation Mathematical Problems in Engineering.
-
11EDWARDS W & BARRON FH. 1994. SMARTS and SMARTER: improved simple methods for multiattribute utility measurement. Organizational behavior and human decision processes 60(3): 306-325.
-
12FOSSILE DK, FREJ EA, DA COSTA SEG, DE LIMA EP & DE ALMEIDA AT. (2020). Selecting the Most Viable Renewable Energy Source for Brazilian Ports Using the FITradeoff method. Journal of Cleaner Production, 121107.
-
13FREJ EA, DE ALMEIDA AT & COSTA APCS. 2019. Using data visualization for ranking alternatives with partial information and interactive tradeoff elicitation. Operational Research, 1-23.
-
14FREJ EA, ROSELLI LRP, DE ALMEIDA JA & DE ALMEIDA AT. 2017. A Multicriteria Decision Model for Supplier Selection in a Food Industry Based on FITradeoff Method. Mathematical Problems in Engineering.
-
15HOLLOWAY HA & WHITE III CC. 2003. Question selection for multi-attribute decision-aiding. European Journal of Operational Research 148(3): 525-533.
-
16KANG TAH, SOARES JÚNIOR ADC & DE ALMEIDA AT. 2018. Evaluating Electric Power Generation Technologies: A Multicriteria Analysis Based on The FITradeoff Method. Energy.
-
17KEENEY RL & RAIFFA H. 1976. Decision Analysis with Multiple Conflicting Objectives. Wiley & Sons, New York.
-
18KIRKWOOD CW & SARIN RK. 1985. Ranking with partial information: a method and an application. Operations Research 33(1): 38-48.
-
19LARSSON A, RIABACKE M, DANIELSON M, EKENBERG L. 2015. Cardinal and rank ordering of criteria addressing prescription within weight elicitation. International Journal of Information Technology & Decision Making 14(06): 1299-1330.
-
20LIMA ES, VIEGAS RA & COSTA APCS. 2017. A Multicriteria Method Based Approach to the BPMM Selection Problem. IEEE International Conference on Systems, Man, and Cybernetics (SMC). Banff Center, Banff, Canada.
-
21MÁRMOL AM, PUERTO J & FERNÁNDEZ FR. 2002. Sequential incorporation of imprecise information in multiple criteria decision processes. European Journal of Operational Research 137(1): 123-133.
-
22PERGHER I, FREJ EA, ROSELLI LRP & DE ALMEIDA AT. (2020). Integrating simulation and FITradeoff method for scheduling rules selection in job-shop production systems. International Journal of Production Economics 227: 107669.
-
23ROSELLI LRP, FREJ EA & DE ALMEIDA AT. 2018. Neuroscience experiment for graphical visualization in the FITradeoff Decision Support System. In: Chen Y, Kersten G, Vetschera R, Xu H. (eds.) GDN. LNBIP vol. 315, pp. 56-69. Springer, Cham.
-
24ROSELLI LRP, DE ALMEIDA AT & FREJ EA. 2019. Decision neuroscience for improving data visualization of decision support in the FITradeoff method. Operational Research 19: 1-21.
-
25ROY B. 1996. Multicriteria Methodology for Decision Aiding. Berlim, Heidelberg, Springer Science & Business Media, 293p.
-
26SALO AA & HÄMÄLÄINEN RP. 1992. Preference assessment by imprecise ratio statements. Operations Research 40(6): 1053-1061.
-
27SALO AA & HÄMÄLÄINEN RP. 2001. Preference ratios in multiattribute evaluation (PRIME) Elicitation and decision procedures under incomplete information. IEEE Transactions on Systems, Man, and Cybernetics-Part A: Systems and Humans 31(6): 533-545.
-
28SALO A & PUNKKA A. 2005. Rank inclusion in criteria hierarchies. European Journal of Operational Research 163(2): 338-356.
-
29WEBER M. 1985. A method of multiattribute decision making with incomplete information. Management Science 31(11): 1365-1371.
-
30WEBER M. 1987. Decision making with incomplete information. European Journal of Operational Research 28(1): 44-57.
-
31WEBER M & BORCHERDING K. 1993. Behavioral Influences on Weight Judgments in Multiattribute Decision Making. European Journal of Operational Research 67(1): 1-12.
-
32WHITE CC & HOLLOWAY HA. 2008. Resolvability for imprecise multiattribute alternative selection. IEEE Transactions on Systems, Man, and Cybernetics-Part A: Systems and Humans 38(1): 162-169.
-
33ZHENG J & LIENERT J. 2017. Stakeholder Interviews with Two MAVT Preference Elicitation Philosophies in a Swiss Water Infrastructure Decision: Aggregation Using SWING Weighting and Disaggregation Using UTA. European Journal of Operational Research. 0 0 0 1-15.
Publication Dates
-
Publication in this collection
10 Aug 2020 -
Date of issue
2020
History
-
Received
18 Nov 2019 -
Accepted
17 Apr 2020


