Abstracts
Tuna are highly prized in Oriental cuisine, and the bigeye tuna (Thunnus obesus) is of great commercial importance. Quality is assessed by the tuna meat quality, freshness, texture and fat, which can be altered by factors inherent to capture, such as days of onboard storage, months of the year, whether the catch was living or dead, fish weight and year. These factors were correlated to identify those that affect quality. We obtained data from nine vessels, from January 2007 to April 2010, creating an information bank of 21,908 bigeye tuna. Fish quality and parameters were related using multiple linear regression analysis, in which the variables were included in the model by a stepwise procedure (F>4). We found that live catch, heavier fish and fewer days of storage positively affected the quality, and that there is a seasonality of quality related to biological factors, which are not amenable to control.
fishing; Thunnus obesus; tuna; sensory analysis
Os atuns são peixes muito apreciados na culinária oriental, e a albacora-bandolim (Thunnus obesus) é de grande importância comercial. A qualidade do atum é avaliada pela qualidade da carne, frescor, textura e gordura, a qual pode ser alterada por fatores inerentes à captura, tais como: dias de armazenamento a bordo, meses do ano, capturado vivo ou morto, peso e ano. Esses fatores foram correlacionados para se identificarem aqueles que afetam a qualidade da carne. Foram obtidos dados de nove embarcações, de janeiro de 2007 a abril de 2010, e criou-se um banco de informações de 21.908 atuns. A qualidade do pescado e os parâmetros foram relacionados utilizando-se análise de regressão linear múltipla, em que as variáveis foram incluídas no modelo de stepwise (F> 4). Descobriu-se que captura do animal vivo, peixe mais pesado e menos dias de armazenamento afetaram positivamente a qualidade da carne e que há uma sazonalidade da qualidade relacionada a fatores biológicos que não são passíveis de controle.
pesca; Thunnus obesus; atum; análise sensorial
INTRODUCTION
The Bigeye tuna (Thunnus obesus) is the second most caught tuna species by longline fleets in Brazil, occurring along the coastline of the country. In 2008, 958 t were caught (FAO, 2010FAO. Fisheries Department, Fishery Information, Data and Statistics Unit. FISHSTAT Plus: Universal software for fishery statistical time series. Version 2.3. 2010.; Hazin, 2005HAZIN, F.H.V. Grandes peixes pelágicos no Nordeste (atuns, agulhões e tubarões). Avaliação do Potencial Sustentável de Recursos Vivos na Zona Econômica Exclusiva MMA - REVIZEE, 2005.).
The majority of tuna are processed in the state of Rio Grande do Norte, because the tuna fleet in Brazil is concentrated in this state (ICCAT, 2010ICCAT. Report for biennial period, 2008-09 PART II (2009) - Vol. 3 Annual Reports. Madrid, Spain, 2010.). In 2007, the largest number of catches with a longline was recorded (Hazin and Travassos, 2008HAZIN, F.H.V.; TRAVASSOS, P. Annual Report of Brazil. Meeting of the Standing Committee on Reasearch and Statistics, International Commission for the Conservation of the Atlantic Tuna (ICCAT), 2008.).
A quarter of the world's captured tunas ends up as sashimi (Jiménez-Toribio et al., 2010JIMÉNEZ-TORIBIO, R.; GUILLOTREAU, P.; MONGRUEL, R. Global integration of European tuna markets. Progress in Oceanography, v.86, p.166-175, 2010.), which makes the control of product quality extremely important (Mateo et al., 2006MATEO A.; SOTO, F.; VILLAREJO J.A.; ROCA-DORDA, J. et al. Quality analysis of tuna meat using an automated color inspection system. Aquac. Engineering, v.35, p.1-13, 2006.), because only fish of excellent quality are used for its preparation.
Currently, quality is one of the biggest concerns facing the food industry (Huss, 2003HUSS, H.H.; ABABOUCH, L.; GRAM, L. Assessment and management of sea food safety and quality. FAO Fisheries Technical Paper, n.444. 2003. 44p.), because consumers are demanding appearance, odor, flavor and nice texture (Warm et al., 2000WARM, K.; NIELSEN, J.; HYLDIG, G.; MARTENS, M. Sensory quality criteria for five fish species. J. Food Quality, v.23, p.583-601, 2000.). To assess the quality, quick methods are needed. Sensory evaluation is used for most fish because of the speed, reliability and ease, and this evaluation uses only the human organs of sense to generate accurate and direct information about the quality attributes (Veciana-Nogue's et al., 1997Veciana-Nogue's, M.T.; Marine'-Font, A.; Vidal-Carou, M.C. Biogenic Amines as Hygienic Quality Indicators of Tuna. Relationships with Microbial Counts, ATP-Related Compounds,Volatile Amines, and Organoleptic Changes. J. Agric. and Food Chem., v.45, p.2036-2041, 1997.; Warm et al., 2001WARM, K.; MARTENS, H.; NIELSEN, J. Sensory quality criteria for five fish species measurement predicted from near-infrared (NIR) reflectance. J. Food Quality, v.24, p.389-403, 2001.; Pons-Cascada-Sa'nchez et al., 2006PONS-SA'NCHEZ-CASCADO S.; VIDAL-CAROU M.C.; NUNES M.L.; VECIANA-NOGUE'S M.T. Sensory analysis to assess the freshness of Mediterranean anchovies (Engraulis encrasicholus) stored in ice. Food Cont., v.17, p.564-569, 2006.; Pe'rez Elortondo et al., 2007PE'REZ ELORTONDO, F.J.; OJEDA, M.; ALBISU, M. et al. Food quality certification: An approach for the development of accredited sensory evaluation methods. Food Qual. and Preference, v.18, p.425-439, 2007.).
Hackney and Garrett (1985)HACKNEY, C.R.; GARRETT, E.S. Safety and Quality of Seafood. Recip. Meat Conf. Proceed., v.38, 1985. p. 135-140. reported that the quality of fish is influenced by the environment and fishing practices. Blanc et al. (2005)BLANC, M.; DESURMONT, A.; BEVERLY, S. Onboard handling of sashimi-grade tuna: a practical guide for crew members. Secretariat of the Pacific Community, Noumea, New Caledoni, 2005. also noted that the classification of tuna is determined by several factors, some with little influence from the boat crew and others that are the sole responsibility of the crew.
Several factors influence the resistance of fish to decomposition, but the changes will occur regardless of how the fish is handled (Vieira, 2003VIEIRA, R.H.S.F. Microbiologia, higiene e qualidade do pescado, São Paulo: Livraria Varela, 2003. 380p.). However, the speed at which they will occur can be reduced, so it is important to apply systematic methods to obtain good quality products (Ogawa and Maia, 1999OGAWA, M.; MAIA, E.L. Manual de Pesca, São Paulo: Livraria Virela, 1999. 430p.).
Fish quality is directly influenced by several factors that may be physiological. Thus, based on the collected data, we aimed to contribute to the strategies for fishing and handling of bigeye tuna in order to maintain quality after capture.
MATERIAL AND METHODS
The data used in this study were obtained from a Brazilian fishing company, based in Natal, Rio Grande do Norte, Brazil. Data from nine vessels were collected, these vessels capture the tuna in the western tropical Atlantic Ocean, using the pelagic longline as fishing gear. The boats left for fishing at the crescent moon and returned at the waning moon. The release of the fishing material began at sunset, and the catch was collected the next day just before dawn. The hooks used were "J" hooks, which were gradually replaced over time by the circular type (by the end of the study replacements reached 80%). The bait used was squid (Illex argentinus), imported from Argentina and Uruguay. Bright attractors were used, such as light-sticks, attached to the lines near the hooks.
Data collection began in January 2007 and ended in May 2010 with the formation of a database of 21,908 bigeye tuna (Thunnus obesus). Each fish was numbered and cataloged separately, with information on the day of capture, if it was alive or dead, how long it remained stored on board until the return to land, the quality ratings from sensory analysis and the weight.
When they boarded, live fish were stunned by piercing the skull and bled through a cut just below the pectoral fin, such that the heart was still beating, pumping blood to the outside. The bleeding of dead fish on board was also conducted, using water pressure to expel the remaining blood, following the technique described by Blanc et al. (2005)BLANC, M.; DESURMONT, A.; BEVERLY, S. Onboard handling of sashimi-grade tuna: a practical guide for crew members. Secretariat of the Pacific Community, Noumea, New Caledoni, 2005..
After bleeding, the fish were gutted and decapitated, washed with sea water and wrapped in cloth to protect the scales from direct contact with ice.
Later, the fish were sent to the polls for storage on the boats, which were packed in ice scale made with chlorinated water. All of the processing on board, boarding up, and packing on ice, was carried out within 10 minutes, as recommended by Ali (1995)ALI, B.B.M. Landings of Indian ocean tuna by foreign vessels in Malaysia. Indian Ocean Tuna Comm. (IOTC), Malásia, 1995., who said that the handling on board must be performed gently to avoid bruising, and quickly to prevent the condition called Yake niku (a Japanese term for Burnt Tuna Syndrome (BTS)). The handling on board was the same on all fishing boats.
For traceability during the on-board processing, each fish was individually identified with a numbered seal and tied with colorful ribbons to indicate which day it was captured, one color for each day. A cut on the caudal peduncle marked those that were caught alive.
Fish landings were performed in two fish processing industries located in Natal, Rio Grande do Norte, Brazil, which follow Hazard Analysis and Critical Control Points (HACCP) and the Federal Inspection Service (SIF) of the Ministry of Agriculture, Livestock and Supply (MAPA).
The classification used was the American model, which uses numbers and the "+" and "-" signs, quoted by Beverly (2003)BEVERLY, S. Fish aggregating device (fAD) fishing skills, horizontal longline fishing, and tuna handling and grading workshops in Koror, Palau. Secretariat of the Pacific Community FIELD REPORT, No. 20, Noumea, New Caledonia, 2003., separating the parameters of meat quality, freshness, texture and fat (Tab. 1), being held at the time of unload within the processing plant for sensory examination by a single classifier, who had previous experience with the classification of tuna.
Meat quality is considered the most important parameter for tuna and is evaluated by removing a piece of muscle (Blanc, 2002BLANC, M. (2002). Grading of tunas for the sashimi market, SPC Fisheries Newsletter No.100: January/March, 2002.), obtained using a tool called a sashibu. For the evaluation of meat three parameters were observed: color, brightness and transparency. For tuna type "1", the meat was an intense red color, bright, smooth and of uniform transparency. Any variation in these parameters decreased the classification of meat quality.
The freshness of the tuna was evaluated by sensory analysis, similar to that employed with fish in general, where the outer glow is present, the scales are well bonded, the visceral cavity is clean and there is an absence of mucus and odor. Texture was evaluated by touch, passing the hand across the surface of the tuna, to feel the firmness and presence or absence of bruises, as quoted by Sveinsdottir (2002)SVEINSDOTTIR, K.; MARTINSDOTTIR, E.; HYLDIG, G. et al. Application of Quality Index Method (QIM) Scheme in Shelf-life Study of Farmed Atlantic Salmon (Salmo salar). J. Food Science, v.67, p.1570-1579, 2002..
To evaluate the apparent fat, a cut was made in the caudal region, and a fragment of the muscles in the shape of a half-flitch was removed. A visual analysis determined the presence or absence of fat.
To statistically analyze the data, each fish was listed separately for different quality parameters (meat quality, freshness, texture and fat) with the weight, days of onboard storage, catch status (alive or dead), months and year of capture. Multiple linear regression (Cordeiro and Neto, 2004CORDEIRO, G.C.; NETO, E.A.L. Modelos Paramétricos. Associação Brasileira de Estatística, 2004. 246p.) was used, according to the following equation:

Where "VR" is variable response (meat quality, freshness, texture or fat); "λ" is the transformer Box and Cox; "β0, β1, β16..." are the model parameters; "st" is the storage time (days); "l" is the condition of catch (living or dead), "w" is the weight (kg) , "m" are the months of the year, as follows: 1 - January, 2 - February, 3 - March, 4 - April, 5 - May, 6 - June, 7 - July; 8 - August, 9 - September, 10 - October, 11 - November, 12 - December; "y" is the year and "ε" is the error associated with each observation in which: ε ~ (0, σ2), "i" is the i-th observation.
The alive or dead and month of capture variables were included in the model as binary variables, with the assigned values 1 or 0, respectively, for the presence or absence of the variable, as recommended by Mendes et al. (2006)MENDES, P.P. Analise estatística dos parâmetros aquicolas, com fins a otimização da Produção. In: SIMPOSIO DA 430 REUNIAO ANUAL DA SBZ, 2006, João Pessoa, Anais..., João Pessoa, 2006. p.886-903.. The estimation of the parameters "β" of the independent variables was made using the minimum squares technique, as expressed by Draper and Smith (1981)DRAPPER, N.R.; SMITH, H. Applied Regression Anelysis. 2. ed. New York: Jonh Wiley, 1981. 709p.; Weisberg (1985)WEISBERG, G.S. Applied Linear Regression. New York: John Wiley & Sons. 2.ed. 1985. 324p.; Montgomery and Peck (1992)MONTGOMERY, D.C.; PECK, E.A. Introduction to Linear Regression Analysis. New York: Jonh Wiley & Sons, Inc, 1982. 504p.; Mendes et al. (2006)MENDES, P.P. Analise estatística dos parâmetros aquicolas, com fins a otimização da Produção. In: SIMPOSIO DA 430 REUNIAO ANUAL DA SBZ, 2006, João Pessoa, Anais..., João Pessoa, 2006. p.886-903.. To select the significant variables in the models, we used the stepwise method (variable selection). The response variables (quality of meat and fat) were entered into the equation with values from 1 to 4 and the freshness and texture variables were entered into the equation with values from 1 to 3. For all variables, value 1 is the best quality.
RESULTS AND DISCUSSION
Data were collected from 21,908 fish, 13,193 of which were captured alive, representing 60.22% of the catch, while 8,715 were captured dead (39.78%). The mean weight of the captured fish was 35.98kg, ranging between 8.2kg and 123kg. The onboard storage lasted up to 33 days, although some fish were caught on the same day that they were brought ashore. Thus, the average time of storage was 9.8 days.
A total of 11,035 fish were classified as quality meat in the "2 +" category, representing 50.37%. With regard to the others, 2,471 (11.26%) were rated "1", 5,595 (25.54%) were rated "2" and 2,807 (12.81%) were rated "2 -". Blanc (2002)BLANC, M. (2002). Grading of tunas for the sashimi market, SPC Fisheries Newsletter No.100: January/March, 2002. stated that the color of the flesh is of paramount importance, ranging from bright red, which indicates good quality, to brown, which is considered poor quality.
As for freshness, 16,618 (75.85%) of fish were classified as "B +", 4,584 (20.92%) as "B" and 706 (3.22%) as "B-". For texture the vast majority, 18,067 (82.47%), were rated "B +", while the rest were classified as "B" and "B-". The appearance of fat was not as frequent, given that 98% (21,469) of fish caught showed no significant fat.
With the application of statistics, it was possible to see that the factors that directly interfere with the quality of the meat of bigeye were boarding dead or alive, the months of March, April, May, October and November, the number of days of onboard storage, fish weight and year. As shown in Table 2, the closer to "1" a value is, the better the quality; the results with lw coefficients low show better meat quality.
The fish were fresher and heavier when captured alive, and when captured in May, June and July, with interference from the year of capture. The greater the number of days of storage, the less the freshness, those captured in the months of January, April and October were less fresh as well. The condition of catch alive, the largest weight, the months of July and August and the year of capture interfered for the better texture. The number of days stored on board and the months of January, February, March and October, interfered with a decrease in freshness (Tab. 2).
Fat fish were the heaviest and were those captured in July, August, October and November, the less fat fish were captured in the months of February, March and April (Tab. 2).
For the variable of average days of storage of tuna on board there was a visible decrease in the first quarter of the year, a fact possibly related to the greater number of catches during this period. Of the total number of fish, 40% were captured in the first quarter, which could be called the bigeye season in the western tropical Atlantic Ocean, which allows the fishing boats to reach their goal more quickly and therefore return to port more quickly, resulting in a shorter storage of fish.
The storage time on board ranged from 0 to 33 days and quality was lost with an increase in the number of days of storage. The loss of quality occurred in the quality of meat (Fig. 1), freshness (Fig. 2) and texture (Fig. 3). There was no statistical relationship between the fat and the days of storage, which shows that the storage time does not change the amount of fat.
A variation for all quality parameters of bigeye (meat quality, freshness, texture and fat) in the same months every year was observed. There was a better quality in all aspects of the fish caught between December and February as well as between July and September, with decreases between the months of March and May as well as the months of October and November. According to Figueiredo (2007)FIGUEIREDO, M.B. Biologia reprodutiva da albacora bandolim Thunnus obesus (Lowe, 1839) no oceano Atlântico Oeste tropical, 2007. 62p. Dissertação (Mestrado em Recursos Pesqueiros e Aquicultura) - Universidade Federal Rural de Pernambuco, Recife., the gonad index (GI) of this species, caught in the same study area, showed a slight variation in the first and fourth quarter of the year, suggesting that the variation in quality may be related to the reproductive biology of the species.
Relationship between the number of days of onboard storage and meat quality of bigeye tuna caught between January 2007 and April 2010.
Relationship between the number of days of onboard storage and freshness of bigeye tuna caught between January 2007 and April 2010.
Relationship between the number of days of storage on board and the texture of the bigeye tuna caught between January 2007 and April 2010
Taking an average of the quality parameters of meat quality, freshness, texture and fat, we obtained a value of overall quality, which can range from 1 to 3.5 (best quality to worst quality). Based on this average, it was observed that better quality occurred at two times of the year between December and February and between July and August.
The percentage of fish captured alive was uniform in all months of the year, with only a small decrease in the third quarter. However, when comparing the annual catch of fish living to dead, we find an increase in live fish between the years 2007 and 2008, showing the influence of the circular hooks, which gradually replaced the hook type "J" from 2007, as reported by Kerstetter and Graves (2006)KERSTETTER, D.W.; GRAVES, J.E. Effects of circle versus J-style hooks on target and non-target species in a pelagic longline fishery. Fish. Research, v.80, p.239-250, 2006.; Pacheco et al. (2011)PACHECO, J.C.; KERSTETTER, D.W.; HAZIN, F.H. et al. Comparison of circle hook and J hook performance in a western equatorial Atlantic Ocean pelagic longline fishery. Fisheries Rese., v.107, p.39-45, 2011..
After an experiment conducted in Brazil compared the two types of fishhook ("J" and circular), between 2006 and 2007 (Pacheco et al., 2011PACHECO, J.C.; KERSTETTER, D.W.; HAZIN, F.H. et al. Comparison of circle hook and J hook performance in a western equatorial Atlantic Ocean pelagic longline fishery. Fisheries Rese., v.107, p.39-45, 2011.), fishing companies adhered to new technology. Ward and Hindmarsh (2007)WARD, P.; HINDMARSH, S. An overview of historical changes in the fishing gear and practices of pelagic longliners, with particular reference to Japan's Pacific fleet. Rev. Fish Biol. Fisheries,. v.17, p.501-516, 2007. mentioned that the fishing gear and practices are continuously modified to achieve improvements in size, quality and quantity of the target species.
Taking an average of the parameters statistically influenced by the condition of boarding alive or dead (meat quality, freshness and texture), we obtained a large difference between the overall quality of living and dead fish caught, with an average total quality 1.47 for the living and 1.85 and the dead, with the reminder that the closer to 1 the better the quality (Tab. 3).
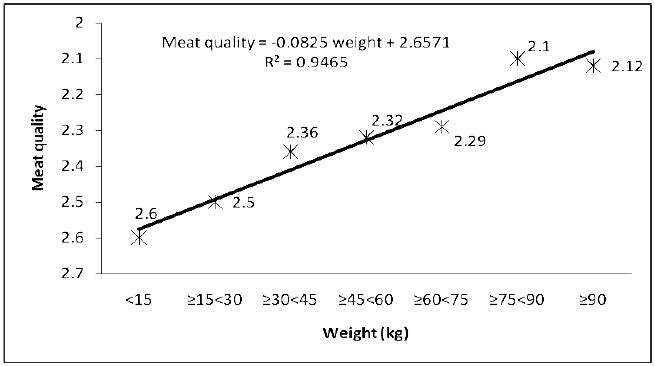
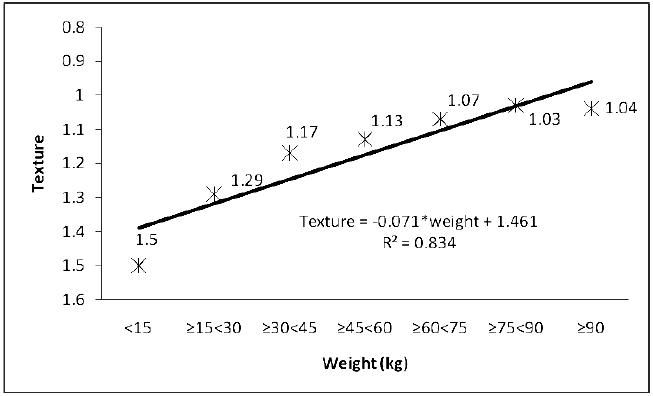
The weight of the tuna significantly influenced the quality, and the best fish were those of higher weight, as quoted by Blanc et al. (2005)BLANC, M.; DESURMONT, A.; BEVERLY, S. Onboard handling of sashimi-grade tuna: a practical guide for crew members. Secretariat of the Pacific Community, Noumea, New Caledoni, 2005.. In all parameters, meat quality (Fig. 4), freshness (Fig. 5) and texture (Fig. 6), there was a considerable improvement in the proportion to higher weight. The quality variation apparently results from the fact that the most massive individuals tend to start the decomposition process later.
The fat content should be highlighted, because all fish weighing less than 45kg showed no significant amount of fat, scoring 4 points in the rating scale, which equals zero fat. Fish weighing between 45kg and 60kg had 3.95 points, and a peak of 2.08 points was reached for the fat fish over 90kg, showing that the amount of fat is concentrated in the larger individuals as stated by Blanc (2002)BLANC, M. (2002). Grading of tunas for the sashimi market, SPC Fisheries Newsletter No.100: January/March, 2002.; he also reported that the amount of fat is more abundant in tuna caught in temperate waters (Fig. 7).
Despite the influence of other factors, the overall quality during the year remained stable from 2007 to 2008. However, this stability was due to the compensation parameters, with improved meat quality and texture and decreased fat content and freshness. As early as 2009, meat quality and freshness was maintained, and the texture improved, causing the overall quality to be improved in that year. The fat content was the only parameter that fell every year, probably due to the annual decrease in the percentage of fish caught that are heavier than 60kg. It is noteworthy that the year 2010 was studied for only the first four months; therefore it was not compared with other years.
When analyzing the factors affecting the overall quality of bigeye tuna, it was found that the quality improved significantly in all parameters when it comes to weight gain. Thus, the fact that most fish of higher weights were caught dead did not affect their quality; those heavier fish maintained a qualitative progress, regardless of their boarding alive or dead.
One fact that is surprising is the decrease in the number of days of storage with the increased weight. The larger fish tend to spend fewer days stored on board, which positively influences the quality. The possible cause of this finding must be related to the shape of these fishing boats that go fishing in the waxing moon and return in the waning moon, which suggests that the largest fishes are closer to the ocean surface during or after the full moon, enabling capture using the longline.
CONCLUSIONS
It is concluded that the factors that most positively affect the quality of bigeye tuna are size, alive or dead catch and shorter storage period. Biological factors, over which we do not have control, interfere, but can be lessened by proper planning by the fish companies.
ACKNOWLEDGEMENTS
We would like to thank the Graduate Program in Resource Fisheries and the Aquaculture Federal Rural University of Pernambuco, where the work described here was performed, the Coordination of Improvement of Higher Education Personnel - CAPES for financial assistance and the company Norpeixe Fish Industry and Trade Ltd.
REFERENCES
- ALI, B.B.M. Landings of Indian ocean tuna by foreign vessels in Malaysia. Indian Ocean Tuna Comm. (IOTC), Malásia, 1995.
- BLANC, M. (2002). Grading of tunas for the sashimi market, SPC Fisheries Newsletter No.100: January/March, 2002.
- BLANC, M.; DESURMONT, A.; BEVERLY, S. Onboard handling of sashimi-grade tuna: a practical guide for crew members. Secretariat of the Pacific Community, Noumea, New Caledoni, 2005.
- BEVERLY, S. Fish aggregating device (fAD) fishing skills, horizontal longline fishing, and tuna handling and grading workshops in Koror, Palau. Secretariat of the Pacific Community FIELD REPORT, No. 20, Noumea, New Caledonia, 2003.
- CORDEIRO, G.C.; NETO, E.A.L. Modelos Paramétricos. Associação Brasileira de Estatística, 2004. 246p.
- DRAPPER, N.R.; SMITH, H. Applied Regression Anelysis. 2. ed. New York: Jonh Wiley, 1981. 709p.
- FAO. Fisheries Department, Fishery Information, Data and Statistics Unit. FISHSTAT Plus: Universal software for fishery statistical time series. Version 2.3. 2010.
- FIGUEIREDO, M.B. Biologia reprodutiva da albacora bandolim Thunnus obesus (Lowe, 1839) no oceano Atlântico Oeste tropical, 2007. 62p. Dissertação (Mestrado em Recursos Pesqueiros e Aquicultura) - Universidade Federal Rural de Pernambuco, Recife.
- HACKNEY, C.R.; GARRETT, E.S. Safety and Quality of Seafood. Recip. Meat Conf. Proceed., v.38, 1985. p. 135-140.
- HAZIN, F.H.V. Grandes peixes pelágicos no Nordeste (atuns, agulhões e tubarões). Avaliação do Potencial Sustentável de Recursos Vivos na Zona Econômica Exclusiva MMA - REVIZEE, 2005.
- HAZIN, F.H.V.; TRAVASSOS, P. Annual Report of Brazil. Meeting of the Standing Committee on Reasearch and Statistics, International Commission for the Conservation of the Atlantic Tuna (ICCAT), 2008.
- HUSS, H.H.; ABABOUCH, L.; GRAM, L. Assessment and management of sea food safety and quality. FAO Fisheries Technical Paper, n.444. 2003. 44p.
- ICCAT. Report for biennial period, 2008-09 PART II (2009) - Vol. 3 Annual Reports. Madrid, Spain, 2010.
- JIMÉNEZ-TORIBIO, R.; GUILLOTREAU, P.; MONGRUEL, R. Global integration of European tuna markets. Progress in Oceanography, v.86, p.166-175, 2010.
- KERSTETTER, D.W.; GRAVES, J.E. Effects of circle versus J-style hooks on target and non-target species in a pelagic longline fishery. Fish. Research, v.80, p.239-250, 2006.
- MATEO A.; SOTO, F.; VILLAREJO J.A.; ROCA-DORDA, J. et al. Quality analysis of tuna meat using an automated color inspection system. Aquac. Engineering, v.35, p.1-13, 2006.
- MENDES, P.P. Analise estatística dos parâmetros aquicolas, com fins a otimização da Produção. In: SIMPOSIO DA 430 REUNIAO ANUAL DA SBZ, 2006, João Pessoa, Anais..., João Pessoa, 2006. p.886-903.
- MONTGOMERY, D.C.; PECK, E.A. Introduction to Linear Regression Analysis. New York: Jonh Wiley & Sons, Inc, 1982. 504p.
- OGAWA, M.; MAIA, E.L. Manual de Pesca, São Paulo: Livraria Virela, 1999. 430p.
- PACHECO, J.C.; KERSTETTER, D.W.; HAZIN, F.H. et al. Comparison of circle hook and J hook performance in a western equatorial Atlantic Ocean pelagic longline fishery. Fisheries Rese., v.107, p.39-45, 2011.
- PE'REZ ELORTONDO, F.J.; OJEDA, M.; ALBISU, M. et al. Food quality certification: An approach for the development of accredited sensory evaluation methods. Food Qual. and Preference, v.18, p.425-439, 2007.
- PONS-SA'NCHEZ-CASCADO S.; VIDAL-CAROU M.C.; NUNES M.L.; VECIANA-NOGUE'S M.T. Sensory analysis to assess the freshness of Mediterranean anchovies (Engraulis encrasicholus) stored in ice. Food Cont., v.17, p.564-569, 2006.
- SVEINSDOTTIR, K.; MARTINSDOTTIR, E.; HYLDIG, G. et al. Application of Quality Index Method (QIM) Scheme in Shelf-life Study of Farmed Atlantic Salmon (Salmo salar). J. Food Science, v.67, p.1570-1579, 2002.
- Veciana-Nogue's, M.T.; Marine'-Font, A.; Vidal-Carou, M.C. Biogenic Amines as Hygienic Quality Indicators of Tuna. Relationships with Microbial Counts, ATP-Related Compounds,Volatile Amines, and Organoleptic Changes. J. Agric. and Food Chem., v.45, p.2036-2041, 1997.
- VIEIRA, R.H.S.F. Microbiologia, higiene e qualidade do pescado, São Paulo: Livraria Varela, 2003. 380p.
- WARD, P.; HINDMARSH, S. An overview of historical changes in the fishing gear and practices of pelagic longliners, with particular reference to Japan's Pacific fleet. Rev. Fish Biol. Fisheries,. v.17, p.501-516, 2007.
- WARM, K.; MARTENS, H.; NIELSEN, J. Sensory quality criteria for five fish species measurement predicted from near-infrared (NIR) reflectance. J. Food Quality, v.24, p.389-403, 2001.
- WARM, K.; NIELSEN, J.; HYLDIG, G.; MARTENS, M. Sensory quality criteria for five fish species. J. Food Quality, v.23, p.583-601, 2000.
- WEISBERG, G.S. Applied Linear Regression. New York: John Wiley & Sons. 2.ed. 1985. 324p.
Publication Dates
-
Publication in this collection
June 2014
History
-
Received
31 July 2013 -
Accepted
20 Dec 2013