ABSTRACT
The high consumption of water and uncontrolled wastewater generation commonly seen in fish processing plants are a matter of concern. Sustainable actions must be taken to addres this issue. The present study aimed to quantify the water used in the processing of Atlantic Salmon (Salmo salar) and Dolphinfish (Coryphaena hippurus) in a fish warehouse in Rio de Janeiro, Brazil, through water balance and mass balance at each development stage. According to the data obtained, the warehouse showed higher total water use, both in general (7,173.28±265.77m3/month), with most water use intended for processing support activities, approximately 45.00% (3,186.82±407.57m3/month); specifically, in the processing of the selected raw materials, with greater consumption of water for obtaining one kg of Dolphinfish fillets and slices, around 4.80 x 10³m3/kg in both. This suggests the use of sustainable methodologies that result in decreased water consumption and in reuse of solid waste, since the three processing stages studied generated a high amount of solid waste, with emphasis to filleting in both species, with 55.00% of residual production each. The present study will also serve as the basis to other studies on the same issue in the fishing area.
Keywords:
fish processing; water resources; sustainability
RESUMO
Comumente relacionado à indústria de pescado, o alto consumo de água e geração de efluentes de forma não controlada é preocupante. Ações sustentáveis são necessárias diante do problema. Objetivou-se, com o presente estudo, quantificar a água utilizada no processamento de salmão-do-atlântico (Salmo salar) e dourado-do-mar (Coryphaena hippurus), em um entreposto de pescado localizado no Rio de Janeiro, Brasil, por meio dos balanços hídrico e de massa de cada etapa de processamento. Com base nos dados obtidos, observou-se que o entreposto apresentou um elevado uso de água total, tanto de forma geral, 7.173,28±265,77m3/mês, com o maior gasto destinado às atividades de apoio ao processamento, aproximadamente 45,00%, quanto de forma específica, no processamento das matéria-prima selecionada, com o maior consumo de água para obtenção de um kg de filé e um kg de posta de dourado, cerca de 4,80 x 10³m3/kg em ambos os processos. Sugere-se a aplicação de metodologias sustentáveis de redução no uso hídrico, além do reaproveitamento de resíduos sólidos, uma vez que os três beneficiamentos estudados geram elevada quantidade de resíduos sólidos, com destaque para a filetagem em ambas as espécies, com produção residual de 55,00% cada. O presente estudo também serve como base para outros de mesma temática na área de pescado.
Palavras-chave:
processamento de pescado; recursos hídricos; sustentabilidade
INTRODUCTION
Over the past few years, Brazil experienced a gradual increase in its share in the world production of fish from extractive fishing and aquaculture. In 2010, it accounted for 0.75% of the total 168.00 million of tons of fish produced in the world, which ranks the country in the 19th position in the world (Brazil, 2013). The high production values encourage many food-processing industries to diversify their products and prolong the storage life of their fish. In 2012, around 54.00% of the world’s fish production has undergone some form of processing (The state…, 2014).
Water is a valuable asset that is highly used in food industries, both for cleaning facilities and equipment and ensuring safety and high quality at the different production stages (Mierzwa and Hespanhol, 2005MIERZWA, J.C.; HESPANHOL, I. Água na indústria: uso racional e reúso. Sao Paulo: Oficina de Textos, 2005. 143p.). In Brazil, there has been a high consumption of industrial water, particularly in the 2006-2010 period, with an increase of 25.8 x 10¹¹m3 compared to an increase of 2.00 x 10¹¹m3 from 1996 to 2006, i.e. a lower growth in a higher period of time (FAO's…,, 2016).
For example, the average consumption of water resources by tuna canning in Thailand is 1.30 x 10²m3/kg of processed products (Uttamangkabovorn et al., 2005UTTAMANGKABOVORN, M.; PRASERTSAN, P.; KITTIKUN, H.A. Water conservation in canned tuna (pet food) plant in Thailand. J. Clean. Prod., v.13, p.547-555, 2005.), while the processing of Nile tilapia (Oreochromis niloticus), in Brazil, consumes 1.58 x 10²m3/kg (Souza et al., 2008SOUZA, M.A.; VIDOTTI, R.M.; OLIVEIRA NETO, L.A. Redução no consumo de efluente gerado em abatedouro de tilápia do Nilo através da implantação de conceitos de produção mais limpa (P+L). Bol. Inst. Pesca, v.34, p.289-296, 2008.). However, excessive consumption of water resources and waste generation in fishing industries often represents an environmental problem, since use of these resources is usually done in an uncontrolled manner because of the lack of technical regulation in Brazil, and little research on the sector.
Associated with the high use of water resources in the fisheries, another major concern worldwide is the scarcity of water. Currently, several segments of the world community are gradually competing for daily water supply. In 2050, if there is no improvement in water policies and management, water shortage poses a serious threat (Leflaive et al., 2012LEFLAIVE, X.; WITMER, M.; MARTIN-HURTADO, R. et al. Water: OECD (Ed.). OECD environmental outlook to 2050 - the consequences of inaction. France: OECD, 2012. p.207-274.). Although Brazil has a 7,367km long coastline and approximately 13.80% of all fresh surface water available in the world, with a high annual indicator of total renewable water resources, the referred situation indicates the presence of areas of higher vulnerability regarding water supply, both in quantitative and qualitative terms. The most affected Brazilian regions are the Northeast region (semiarid area in the states of Bahia, Sergipe, Alagoas, Pernambuco, Paraíba, Rio Grande do Norte, Ceará and Piauí), and Southeast region (particularly in the states of São Paulo, Rio de Janeiro and Minas Gerais) (Brazil, 2015). Therefore, some Brazilian states are imposing restriction on the use of water at some periods of the year
In this context, in order to contribute to the mapping of water use by the fishing processing industry, this study aimed to perform the water balance of a fish warehouse in Rio de Janeiro, Brazil, with the quantification of water use during the processing of captive-bred Atlantic salmon (Salmo salar) and Dolphinfish (Coryphaena hippurus) and the yields of finished products and solid waste. Both species are widely produced in the cold storage warehouse used as a model in this study and are very representative in the world and Brazilian markets.
MATERIAL AND METHODS
A fish cold storage warehouse in the State of Rio de Janeiro was used as a model in the study. In order to obtain information on production, operation and number of collaborators, warehouse specialists were interviewed, and internal documents were examined.
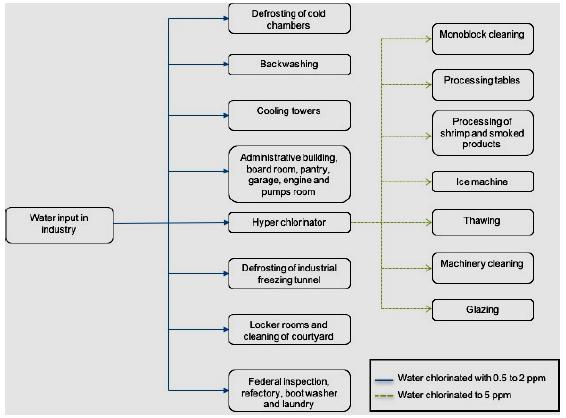
In order to determine water balance (water use) during the general operation of the warehouse, not specifying the consumption of the species selected for the study, the industry was divided into three sectors (administrative sector, processing sector and sector of support to processing) and 20 water meters were installed at strategic points. The administrative sector comprised the administrative building, board room, pantry, garage, engine and pumps room; the processing sector comprised the consumption of processing tables, processing of shrimp and smoked products, thawing and glazing; and the sector of support to processing concerned the ice machines, defrosting of cold chambers, locker rooms and cleaning of courtyard, Federal inspection, refectory, boot washer and laundry, cooling towers, thawing of industrial freezing tunnel, backwashing and monoblock and machinery cleaning.
Daily reading of water meters was performed for three months, in 2014, always at 8 a.m. The measurements were performed according to the applicable technical standards (Associação..., 1999), with record of water use and indication of the flow rate. At specific stages (thawing of freezing tunnels, glazing, and thawing of Dolphinfish), measurements were based on time and flow rate of the hose.
Also, material balance during processing was divided into water balance and mass balance, and two species of sea fish were selected for this study, namely Atlantic Salmon (Salmo salar) and Dolphinfish (Coryphaena hippurus). The data were collected in three study cases: 1) processing of whole eviscerated Atlantic salmon for the production of boneless and skinless fillet, 2) processing of frozen Dolphinfish for obtaining skinless fillet and 3) processing frozen Dolphinfish for slicing.
In the observation of water use in the processing of both fish species, water meter reading was performed before and after processing at the points where water fed the processing tables. Data were collected in quintuplicate, or else, five times in random days, shifts and batches. Figure 1 includes a flowchart with the activities in which water use was quantified in the cold storage warehouse. It can be seen that the water that supplies the warehouse is chlorinated with 0.50 to 2.00ppm of free residual chlorine, according to the applicable legislation on the quality of water for human consumption (Brazil, 2011), and when it feeds the hyper chlorinator, water is chlorinated to 5.00ppm of free residual chlorine and then passes through the points where there is direct or indirect contact with the fish. Thus, it was considered that the values obtained at the point of collection of the hyper chlorinator were distributed to the following points: monoblock cleaning and tables; processing tables; processing of shrimp and smoked products; ice equipment; thawing and glazing.
In mass balance, the average values of the inputs, raw materials and outgoing products and waste were collected at the processing stages of each product, also in quintuplicate, i.e. five times in random days, shifts and batches. Based on this data, calculation of water use per kilogram of product generated was made and the yields of finished products and solid waste were obtained. It should be stressed that samples used in the present study were obtained after technological processing in the warehouse; there was not manipulation of live animals by the project's technical team. Also, the solid waste generated in this cold storage farm are intended for selective collection, except for the skin and head of the Dolphinfish, which will be marketed.
RESULTS AND DISCUSSION
The fish cold storage warehouse processes different fish species, including Atlantic salmon and Dolphinfish, and most often receives the finished frozen product. The cold storage warehouse operates Monday through Friday, 16 hours per day, in two 8-hour shifts and has 983 employees. The area is cleaned three times per shift, including floor and equipment washing. The maximum processing capacity is 60.00 tons of raw materials, day, and during the low production period, from April to October, 35.00 tons of fish are daily processed. The fish species selected for the study account for 25.00% of the total products. These samples produce 15.00 tons of raw material per day.
Based on the data collected from the water meters installed in the months of the study, it can be affirmed that the total average consumption in the warehouse is estimated in 7,173.28±265.77m3/month, not specifying the consumption obtained exclusively with the species selected for the study.
Table 1 includes the monthly levels of water consumption for each consumer unit surveyed. The average monthly value of the hyperchlorinator reading is diluted in the collection points there is direct or indirect contact with the fish.
Approximately 45.00% (3,186.82±407.57m3/month) of the monthly consumption of industrial water is intended for processing support activities, industrial routine actions in daily operations, with the greatest consumption observed in the water consumed in the cooling towers.
Concerning administrative activities, water consumption represented around 41.00% of the total, or else, 2,967.76±147.17m3/month. Regarding the processing stages analyzed in this study, water consumption accounted for around 14.00% (1,018.67±298.25m3/month) of the total consumption. The highest level of consumption in the processing stages occurred in the seven processing tables, being equivalent to approximately 12.00% of the total water consumption of the warehouse and 84.00% of these stages, i.e. 851.16±26.65m3/month. Of this value, 22.86% concerns the cleaning of these tables and the remaining percentage (77.14%) is related to water consumption during fish processing for activities such as evisceration, head removal and scaling. The lowest monthly consumption occurred in the processing of shrimp and smoked products, with an average value of 30.32±18.35m3/month (0.33% of the total consumption in the warehouse).
The levels of water consumption during the processing stages of this study are lower (1,018.67±298.25m3/month) than the ones obtained in processing stages of similar previous experiments. The water consumption of nine small fish processing industries engaged in the curing of small anchovies (Engraulis encrasicolus) and sardines (Sardine pilchardus) in Croatia, ranged from 300.00 to 4,200.00m3/month, depending on the size of the facility and monthly production (Krželj et al., 2011KRŽELJ, M.; ŠIMAT, V.; BOSNIĆ, N. Wastewater discharge from fish processing plants in Croatia. In: INTERNATIONAL CONGRESS OF FOOD TECHNOLOGISTS, BIOTECHNOLOGISTS AND NUTRITIONISTS, 7., 2011, Croatia. Proceedings… Croatia:[Croatian Society of Food Technologists, Biotechnologists and Nutritionists], 2011. p.23-27.). In another example, in a salmon cannery with capacity of 8.00 tons/day, lower than the present study (60.00 tons/day), total water consumption in the processing stages (processing line, sterilization and others) was 9,600.00m3/month. It is important to mention that in the canning line, there are more water consuming steps, which may explain the higher consumption in the study.
Oddly, in the comparison of water consumption during the processing stages in relation to the maximum production capacity of the abovementioned fisheries, it is assumed that water use per fish unit rapidly increases with decrease in production volume. This can be explained by the fact that a high percentage of the water used in the processing unit is intended for the cleaning of facilities and equipment (Murphy, 2006MURPHY, N. Meat processing environmental impacts: environmental impacts from meat and fish processing.[s.l.]: Waste Reduction Resource Center. 2006. Available in: <http://e4r4.tetradyn.com/chem-bio-med-health-docmts/IDLH-toxic-chemicals/industry-emission-exposure/air-emissions-meta-fish-processing-industry.htm>. Accessed: 6 Feb. 2016.
http://e4r4.tetradyn.com/chem-bio-med-he...
).
In the fish warehouse of this study, 16.70% of the total water consumed (1,198.56± 146.91m3/month) is intended for cleaning and sanitation of equipment and processing areas (including monoblock and machinery cleaning, defrosting of cold chambers and freezing tunnel and cleaning of processing tables). This value did not include cleaning of the courtyard because the water meter reading also involves water consumption in the locker rooms. Also, the amount of water consumed in the cleaning of filleting tables between shifts in the fish warehouse used as model in this study, regardless of the production obtained, was equivalent to 2.16m3. Based on the estimate of daily water consumption in the cleaning of processing tables (six daily cleaning activities), a level of water consumption of 259.44m3/month was obtained.
The study of Ferraciolli (2016FERRACIOLLI, L.M.R.V.D. Estratégias auxiliares ao gerenciamento hídrico em indústrias processadoras de pescado: minimização do uso da água e possibilidade de reciclo e/ou reuso de efluente. 2016. 86f. Dissertação (Mestrado) - Programa de Pós-Graduação em Ciências do Ambiente, Universidade Federal do Tocantins, Palmas, TO.) corroborates the information provided by Murphy (2006MURPHY, N. Meat processing environmental impacts: environmental impacts from meat and fish processing.[s.l.]: Waste Reduction Resource Center. 2006. Available in: <http://e4r4.tetradyn.com/chem-bio-med-health-docmts/IDLH-toxic-chemicals/industry-emission-exposure/air-emissions-meta-fish-processing-industry.htm>. Accessed: 6 Feb. 2016.
http://e4r4.tetradyn.com/chem-bio-med-he...
). One mid-sized fish processing plant for fish evisceration, mostly of species Tambaqui (Colossoma macropomum), Matrinxã (Brycon sp.) and Pintado (Pseudoplatystoma corruscans), with average production of 3.40 tons/day consumed around 28.00% of the water destined for administrative areas, 52.00% of water destined for fish processing and approximately 20.00% of water for cleaning and sanitation of floor and equipment (Ferraciolli, 2016). In the present study, in contrast, there was a higher consumption of water destined for administrative tasks (41.00%), and lower consumption in processing (14.00%) and in cleaning and sanitation (16.70% of the total amount of water used). Such data suggest staff awareness of the need for minimization of water consumption in the fish warehouse used as model in this study.
The case studies used in the present experiment to assess water consumption and mass balance were slicing and filleting of Dolphinfish and filleting of Atlantic salmon.
The flowchart of the slicing of frozen Dolphinfish, as well as water use and yield of products per stage in the processing of 100.00kg of raw material is shown in Figure 2. In general, the process resulted in the average consumption of 0.48±0.02m3/100kg, that is, 4.80 x 10³±0.20 x 10³m3/kg. The highest water consumption in the slicing of Dolphinfish occurs in the stages of evisceration, scaling, head removal and cleaning (52.08%). The thawing stage demands 35.42% of water and glazing, 12.50%. For every 100.00kg of Dolphinfish, around 65.00kg (65.00%) of slices and 35.00kg (35.00%) of solid waste were obtained, considering head, skin and trimmings, viscera and meat waste after cutting.
Water balance and mass balance in slicing of 100.00kg of Frozen Dolphinfish, showing the average yield of the final product and solid waste of each step.
Figure 3 includes a flowchart with water consumption and yields obtained in the processing of frozen skinless Dolphinfish fillets for 100.00kg of raw material. In this process, the average consumption was 0.48±0.01m3/100kg, that is, 4.80 x 10³±0.10 x 10³m3/kg. Overall, 35.51% of the water consumption occurred during thawing; 34.33% during skin removal; 21.83%, during evisceration, filleting and washing; and 9.33% during glazing. The yield of the finished product in the flowchart is around 46.00kg (46.00%) compared to 54.00kg (54.00%) of solid waste (head, backbone, skin, viscera and trimmings) production.
Water balance and mass balance in filleting of 100.00kg of Frozen Dolphinfish, showing the average yield of the final product and solid waste of each step.
The processing of 100.00kg of Dolphinfish for production of slices or fillets consumed a similar amount of water. Slicing used 0.48±0.02m3 and filleting used 0.48±0.01m3. Regarding the yields in filleting and slicing processes of Dolphinfish, slicing showed a higher yield in the finished product (65.00%), hence lower production of waste solid (35.00%). In contrast, filleting generated a higher amount of waste (46.00%) and lower yield of the finished product (54.00%).
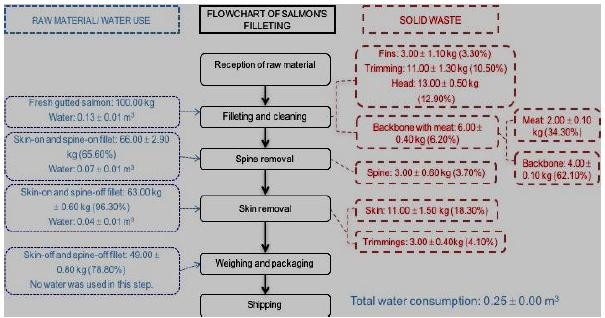
The process of filleting of Atlantic salmon showed a water consumption of 0.25±0.00m3 of water for the production of 100.00kg of fillets, as shown in Figure 4. Of the total water consumed (0.25±0.00m3/100kg or 2.50 x 10³±0.00m3/kg), 53.00% was intended for filleting, 29.00% for spine removal and 18.00% for skin removal. For every 100.00kg of fresh and previously eviscerated Atlantic salmon to be filleted, approximately 47.00kg (47.00%) of boneless and skinless fillets were obtained, and 53.00kg (53.00%) were generated in solid waste (head, bone, skin, fin, mea, trimmings).
Water balance and mass balance in filleting of 100.00kg of Fresh gutted Atlantic salmon, showing the average yield of the final product and solid waste of each step.
Comparison of water consumption in the three processes assessed showed that the highest water consumption occurred in the slicing of 100.00kg of Dolphinfish (0.48±0.02m3), followed by its filleting (0.48±0.01m3) and the lowest consumption occurred in the filleting of Atlantic salmon (0.25±0.00m3), which can be explained by the differences in processing steps of the both species, in particular in the lack of thawing and glazing stages in the processing of Salmon, which were present in both processes of Dolphinfish.
Besides, there was higher consumption of water in skin removal during filleting of Dolphinfish compared to Atlantic salmon, because Dolphinfish has a more brittle texture compared to Salmon, according to the employees of the warehouse, and thus the frozen product is used in the process, which requires higher water consumption.
The results obtained showed high water consumption in the stages of evisceration and filleting in the three study cases reported, with emphasis to the slicing of Dolphinfish, which suggests broad mismanagement of the process.
The average water consumption in the filleting of Nile tilapia (Oreochromis niloticus) in a similar study was 5.05 x 10³m3/kg, which was higher that the results obtained in the present study: 4.80 x 10³±0.20 x 10³m3/kg in the slicing of Dolphinfish, 4.80 x 10³±0.10 x 10³m3/kg in its filleting, and 2.50 x 10³±0.00m3/kg in the Atlantic salmon filleting. The referred study also reported an average consumption of 1.18 x 10³m3/kg in the storing of tilapias, which was not specifically addressed in the present study (Souza et al., 2008SOUZA, M.A.; VIDOTTI, R.M.; OLIVEIRA NETO, L.A. Redução no consumo de efluente gerado em abatedouro de tilápia do Nilo através da implantação de conceitos de produção mais limpa (P+L). Bol. Inst. Pesca, v.34, p.289-296, 2008.).
In a study on water consumption in five herring processing plants in Denmark, supported by sustainable practices, the results ranged from 1.00 x 10³ to 3.20 x 10³m3/kg of processed raw material (Thrane et al., 2009THRANE, M.; NIELSEN, E.H.; CHRISTENSEN, P. Cleaner production in Danish fish processing - experiences, status and possible future strategies. J. Clean. Prod., v.17, p.380-390, 2009.). In the present experiment, both processes of Dolphinfish showed higher levels of consumption than those reported in Denmark: 4.80 x 10³m3/kg in slicing and 4.80 x 10³m3/kg in filleting. Although Dolphinfish is larger in size than the herring, the discrepancy in the results indicate the need for practices that minimize water consumption. The levels obtained in the filleting of Atlantic salmon (2.50 x 10³m3/kg) were close to those of the reported study.
Similarly to the present study and in contrast with the study of Souza et al. (2008SOUZA, M.A.; VIDOTTI, R.M.; OLIVEIRA NETO, L.A. Redução no consumo de efluente gerado em abatedouro de tilápia do Nilo através da implantação de conceitos de produção mais limpa (P+L). Bol. Inst. Pesca, v.34, p.289-296, 2008.), canning of 1 ton of frozen tuna in a Thai plant resulted in a total water consumption of 4.80 x 10³m3/kg in raw material processing, which is close to the values obtained in both processes of Dolphinfish (4.80 x 10³ and 4.80 x 10³), though lower than the consumption levels in Atlantic salmon filleting (2.50 x 10³m3/kg) (Uttamangkabovorn et al., 2005UTTAMANGKABOVORN, M.; PRASERTSAN, P.; KITTIKUN, H.A. Water conservation in canned tuna (pet food) plant in Thailand. J. Clean. Prod., v.13, p.547-555, 2005.).
Observing the experiment of Uttamangkabovorn et al. (2005UTTAMANGKABOVORN, M.; PRASERTSAN, P.; KITTIKUN, H.A. Water conservation in canned tuna (pet food) plant in Thailand. J. Clean. Prod., v.13, p.547-555, 2005.), thawing, that is performed in 1.5m3 tanks, accounted for a water consumption of 0.7 x 10³m3/kg (16.00%); the value is lower than the level of consumption in the present study for Dolphinfish, performed in smaller tanks (0.50 to 0.30m3), approximately 1.70m3/kg, which corresponds to 35.42% in slicing and 35.51% in filleting of the fish. The difference in values between the studies can be explained by the size of the tanks used.
Another finding obtained in the current experiment is the higher use of water in the processing stages than in thawing. Water consumption in the thawing of 100.00kg of Dolphinfish was 0.17±0.01 m3 and 0.25±0.01m3 of water were used in Dolphinfish slicing (evisceration and cutting); 0.26±0.02m3 were used in the filleting of Dolphinfish (values of evisceration and skin removal added). However, the opposite situation was reported in the study of Uttamangkabovorn et al. (2005UTTAMANGKABOVORN, M.; PRASERTSAN, P.; KITTIKUN, H.A. Water conservation in canned tuna (pet food) plant in Thailand. J. Clean. Prod., v.13, p.547-555, 2005.), which obtained a water consumption of 16.00% in thawing and 1.00% in evisceration and washing. The high values in the processing stages proper in the present study are suggestive of the need for greater control and sustainability of water consumption, and even the alteration of equipment and utensils, such as a dispersing nozzle in the taps, directing the flow of water.
Comparison of the yields of the products obtained in the three processes (slicing and filleting of Dolphinfish and filleting of Atlantic salmon) showed that filleting of both species generates high amounts of solid waste in relation to the final product. Slicing of Dolphinfish, with high water consumption, showed the highest finished product yield in relation to the amount of solid waste produced.
Experiments on the amount of solid waste generated in different processes of fish are reported in the literature, as shown in Table 2.
In the present study, the processes of filleting of Atlantic salmon and Dolphinfish resulted in 55.00% of solid waste each, which is consistent with the findings of Arvanitoyannis and Kassaveti (2008ARVANITOYANNIS, I.S.; KASSAVETI, A. Fish industry waste: treatments, environmental impacts, current and potential uses. Int. J. Food. Sci. Tech., v.43, p.726-745, 2008.), who reported 49.00 to 64.00% of solid waste in the filleting of White fish. However, the levels obtained in the present study are relatively higher when compared to the study of Uttamangkabovorn et al. (2005UTTAMANGKABOVORN, M.; PRASERTSAN, P.; KITTIKUN, H.A. Water conservation in canned tuna (pet food) plant in Thailand. J. Clean. Prod., v.13, p.547-555, 2005.), who observed a total yield of 30.57% of solid waste, as follows: 22.70% of head and viscera and 7.30% of bones, caudal fins, skin, and dark meat in tuna canning.
In the processing of whitefish (Arvanitoyannis and Kassaveti, 2008ARVANITOYANNIS, I.S.; KASSAVETI, A. Fish industry waste: treatments, environmental impacts, current and potential uses. Int. J. Food. Sci. Tech., v.43, p.726-745, 2008.) obtained values ranging from 21.00 to 25.00% for head weight. The present experiment showed results similar to the abovementioned findings in the slicing of Dolphinfish with 19.70% of head weight and 7.30% of skin and fins, as well as around 67.00% of slices. Nevertheless, the yields obtained in the filleting of both species were less significant (21.00% of head weight and 46.00% of Dolphinfish frozen skinless and 12.90% of head weight, 3.30% of fins, and 49.00% of boneless and skinless fillets of Atlantic salmon).
Based on these findings related to solid waste production in the plant, and its current disposal by selective collection (except for skin and head of Dolphinfish), reuse of plant waste is recommended to mitigate environmental impact, as well as to generate new products with financial return for the establishment. Therefore, we suggest the construction of rendering facilities for the production of by-products such as fish meal and/or oil, despite the high initial investment (Lima, 2013LIMA, L.K.F. Reaproveitamento de resíduos sólidos na cadeia agroindustrial do pescado. Palmas: Embrapa Pesca e Aquicultura, 2013. 28p.).
CONCLUSION
Based on the water consumption data obtained, it is concluded that control of water use and implementation of sustainable practices for reducing water consumption are key to reducing water consumption and ensuring its sustainable use. The findings of the present study may contribute to the minimization in water consumption in other plants. The levels of industrial water balance reported in this study (total and during each processing stage) must be minimized since water is a limited natural resource that is becoming scarce in some areas in Brazil and worldwide. It was observed at the end of the study that fish companies are currently interested in environmental management and the reduction of business costs. Also, cleaner production practices are recommended for reducing water consumption, such as the installation of electrical devices that control water flow in manual cleaning processes, reuse of relatively clean waste water for other applications, monitoring water flow through water meters, among others. In addition, mass balance of the species revealed high levels of solid waste production, mainly in the filleting processes of Dolphinfish and Atlantic Salmon. Thus, it is suggested the reuse of solid wast, for example, the investment in fish meal production, and a possible expansion in the processing plant to produce fish by-products, increasing the company's financial income and generating less waste and environmental impacts.
REFERENCES
- ARVANITOYANNIS, I.S.; KASSAVETI, A. Fish industry waste: treatments, environmental impacts, current and potential uses. Int. J. Food. Sci. Tech., v.43, p.726-745, 2008.
- ASSOCIAÇÃO BRASILEIRA DE NORMAS TÉCNICAS - ABNT. NBR NM 212. It establishes the technical, metrological and tests methods of velocimetric meters of cold potable water up to 15 m3/h. Rio de Janeiro, 1999. 19p.
- BRASIL. Agência Nacional de Águas. Encarte Especial sobre a Crise Hídrica - Conjuntura dos Recursos Hídricos no Brasil: informe 2014. Brasilia: ANA, 2015. 31p.
- BRASIL. Ministério da Pesca e Aquicultura. Boletim Estatístico da Pesca e Aquicultura - Brasil 2011. Brasilia: MPA, 2013. 60p.
- BRASIL. Ministério da Saúde. Portaria no 2,914, de 12 de dezembro de 2011. It regulates the procedures for control and monitoring of water quality for human consumption and its potability standards. Brasilia: Diário Oficial da União, 14 dez. 2011. Seção 1.
- FAO's global information system on water and agriculture. Rome: Aquastat, 2016. Available in: <http://www.fao.org/nr/water/aquastat/main/index.stm>. Accessed: 25 Feb. 2016.
» http://www.fao.org/nr/water/aquastat/main/index.stm - FERRACIOLLI, L.M.R.V.D. Estratégias auxiliares ao gerenciamento hídrico em indústrias processadoras de pescado: minimização do uso da água e possibilidade de reciclo e/ou reuso de efluente. 2016. 86f. Dissertação (Mestrado) - Programa de Pós-Graduação em Ciências do Ambiente, Universidade Federal do Tocantins, Palmas, TO.
- KRŽELJ, M.; ŠIMAT, V.; BOSNIĆ, N. Wastewater discharge from fish processing plants in Croatia. In: INTERNATIONAL CONGRESS OF FOOD TECHNOLOGISTS, BIOTECHNOLOGISTS AND NUTRITIONISTS, 7., 2011, Croatia. Proceedings… Croatia:[Croatian Society of Food Technologists, Biotechnologists and Nutritionists], 2011. p.23-27.
- LEFLAIVE, X.; WITMER, M.; MARTIN-HURTADO, R. et al. Water: OECD (Ed.). OECD environmental outlook to 2050 - the consequences of inaction. France: OECD, 2012. p.207-274.
- LIMA, L.K.F. Reaproveitamento de resíduos sólidos na cadeia agroindustrial do pescado. Palmas: Embrapa Pesca e Aquicultura, 2013. 28p.
- MIERZWA, J.C.; HESPANHOL, I. Água na indústria: uso racional e reúso. Sao Paulo: Oficina de Textos, 2005. 143p.
- MURPHY, N. Meat processing environmental impacts: environmental impacts from meat and fish processing.[s.l.]: Waste Reduction Resource Center. 2006. Available in: <http://e4r4.tetradyn.com/chem-bio-med-health-docmts/IDLH-toxic-chemicals/industry-emission-exposure/air-emissions-meta-fish-processing-industry.htm>. Accessed: 6 Feb. 2016.
» http://e4r4.tetradyn.com/chem-bio-med-health-docmts/IDLH-toxic-chemicals/industry-emission-exposure/air-emissions-meta-fish-processing-industry.htm - SOUZA, M.A.; VIDOTTI, R.M.; OLIVEIRA NETO, L.A. Redução no consumo de efluente gerado em abatedouro de tilápia do Nilo através da implantação de conceitos de produção mais limpa (P+L). Bol. Inst. Pesca, v.34, p.289-296, 2008.
- THE STATE of world fisheries and aquaculture 2014. Rome: FAO, 2014. 223p.
- THRANE, M.; NIELSEN, E.H.; CHRISTENSEN, P. Cleaner production in Danish fish processing - experiences, status and possible future strategies. J. Clean. Prod., v.17, p.380-390, 2009.
- UTTAMANGKABOVORN, M.; PRASERTSAN, P.; KITTIKUN, H.A. Water conservation in canned tuna (pet food) plant in Thailand. J. Clean. Prod., v.13, p.547-555, 2005.
Publication Dates
-
Publication in this collection
Jul-Aug 2018
History
-
Received
20 May 2017 -
Accepted
04 Nov 2017