Abstract
Cardiovascular disease (CVD) is one of the most serious health issues and the leading cause of death worldwide, causing 30% of deaths in Brazil alone in recent years. However, CVD mortality rates are not uniformly distributed across the country. Brazil is marked by important regional differences resulting from socioeconomic inequality and limited access to health services. Given the spatial distribution of causes and heterogeneity of deaths from cardiovascular disease in Brazil, both at macro and micro levels, the goal of this paper is to investigate how age composition effects and age-specific mortality rates are related to the observed difference in deaths from cardiovascular disease in the adult population (over 30 years of age), by sex, in Brazilian micro-regions from 1996 to 2015. The results suggest there has been a decrease in mortality rates resulting from cardiovascular disease, and that both the effects of age structure and level may have influenced the variation of these deaths in Brazil over the period analyzed. These findings indicate that the Brazilian epidemiological transition is not uniform across and within regions of the country.
Keywords
Decomposition; Mortality; Cardiovascular mortality; Demography; Spatial analysis; Brazilian micro-regions
Resumo
As mortes por doenças cardiovasculares constituem um dos mais sérios problemas de saúde, pois representam a primeira causa de morte em todo o planeta, inclusive no Brasil (algo em torno de 30% nos últimos anos). Entretanto, a mortalidade devido a essa causa não se apresenta de maneira uniforme no território brasileiro, uma vez que o país ainda possui importantes disparidades regionais resultantes das desigualdades socioeconômicas e de acesso aos sistemas de saúde. Diante disso, o objetivo deste artigo é verificar como efeitos de idade e taxas podem explicar o diferencial observado de mortes por doenças cardiovasculares na população adulta, por sexo, nas microrregiões brasileiras, no período de 1996 a 2015. Para tanto, e após a correção dos sub-registro de óbitos, foi utilizada a técnica de decomposição. Os resultados sugerem que há uma diminuição nas taxas de mortes por doenças cardiovasculares e que tanto o efeito da estrutura etária como o do nível podem ter influenciado na variação destas mortes registradas no Brasil ao longo do período analisado. Estes achados indicam que a transição epidemiológica brasileira não é uniforme entre e mesmo dentro dos próprios estados e, consequentemente, o Brasil ainda tem um extenso percurso para caminhar.
Palavras-chave
Decomposição; Mortalidade; Mortalidade cardiovascular; Demografia; Análise espacial; Microrregiões brasileiras
Resumen
El número de muertes por enfermedades cardiovasculares es uno de los más graves problemas de salud, ya que representan la principal causa de muerte en toda la Tierra, incluso en Brasil (alrededor del 30% en los últimos años). Sin embargo, la mortalidad por esta causa no se presenta de manera uniforme en el territorio brasilero, ya que el país todavía tiene importantes diferencias regionales que resultan de las desigualdades socioeconómicas y del acceso a los sistemas de salud. En este sentido, el propósito de este artículo es ver cómo los efectos de edad y tasas pueden explicar la diferencia que se observa entre muertes por enfermedades cardiovasculares en la población adulta por sexo en las microrregiones brasileñas en el período 1996-2015. Para ello, luego de la corrección del subregistro de muertes, se utilizó la técnica de descomposición. Los resultados sugieren una disminución en las tasas de muertes por enfermedades cardiovasculares, y que tanto el efecto de la estructura de edad como el nivel pueden haber influido en la variación de estas muertes registradas en Brasil durante el período de análisis. Estos hallazgos indican que la transición epidemiológica brasileña no es uniforme entre, e incluso dentro, de los propios estados y que, en consecuencia, Brasil aún tiene un largo camino por recorrer.
Palabras clave
Descomposición; Mortalidad; Enfermedad cardiovascular; Demografía; Análisis espacial; Microrregiones brasileñas
Introduction
The epidemiological transition in Brazil presents important regional variations resulting from socioeconomic differences and inequality in the access to health services (FRENK et al., 1991FRENK, J. et al. La transición epidemiológica en América Latina. Boletín de la Oficina Sanitaria Pan-americana, v. 111, n. 6, p. 485-496, 1991.; ARAÚJO, 1992ARAÚJO, J. D. de. Polarização epidemiológica no Brasil. Informe Epidemiológico do SUS, Brasília, ano I, n. 2, p. 5-16, 1992.; SCHRAMM et al., 2004SCHRAMM, J. M. et al. Transição epidemiológica e o estudo de carga de doença no Brasil. Ciência & Saúde Coletiva, v. 9, n. 4, p. 897-908, 2004.; ARAÚJO, 2012ARAÚJO, J. D. de. Polarização epidemiológica no Brasil. Epidemiologia e Serviços de Saúde, v. 21, n. 4, p. 533-538, 2012.; FRANÇA et al., 2017FRANÇA, E. et al. Cause-specific mortality for 249 causes in Brazil and states during 1990–2015: a systematic analysis for the global burden of disease study 2015. Population Health Metrics, v. 15, n. 39, 2017.; BORGES, 2017BORGES, G. M. Health transition in Brazil: regional variations and divergence/convergence in mortality. Cadernos de Saúde Pública [online], v. 33, n. 8, 2017.). This transition has, in different Brazilian regions, been typified by a high incidence of infectious diseases and an increase in mortality from chronic non-communicable diseases (NCDs), in particular, cardiovascular ones, which account for almost 20% of deaths among individuals aged 30 and above (GUIMARÃES et al., 2015GUIMARÃES, R. M. et al. Regional differences in cardiovascular mortality transition in Brazil, 1980 to 2012. Revista Panamericana de Salud Pública, v. 37, n. 2, p. 83-89, 2015.; FRANÇA et al., 2017). Although there is no uniformity regarding the epidemiological transition in Brazil between and within states, one point seems clear: the number of cases involving cardiovascular diseases increased considerably and became the main cause of death in recent years (ARAÚJO, 1992; PRATA, 1992PRATA, P. R. A transição epidemiológica no Brasil. Cadernos de Saúde Pública, v. 8, n. 2, p. 168-175, 1992.; LOTUFO, 2000LOTUFO, P. A. Mortalidade pela doença cerebrovascular no Brasil. Revista Brasileira de Hipertensão, v. 7, n. 4, p. 387-91, 2000.; LOTUFO et al, 2009LOTUFO, P. A.; BENSEÑOR, I. M. Stroke mortality in Brazil: one example of delayed epidemiological cardiovascular transition. International Journal of Stroke, v. 4, n. 1 p. 40-41, 2009., 2013LOTUFO, P. A. et al. A reappraisal of stroke mortality trends in Brazil (1979-2009). International Journal of Stroke, v. 8, n. 3, p. 155-163, 2013.; LESSA, 2004LESSA, I. Doenças crônicas não-transmissíveis no Brasil: um desafio para a complexa tarefa da vigilância. Ciência & Saúde Coletiva, v. 9, n. 4, p. 931-943, 2004.; SOUZA et al., 2006SOUZA, M. F. M. de et al. Epidemiologia das doenças do aparelho circulatório no Brasil: uma análise da tendência da mortalidade. Revista da Sociedade de Cardiologia do Estado de São Paulo, v. 16, n. 1, p. 48-62, 2006.; BARRETO; CARMO, 2007BARRETO, M. L.; CARMO, E. H. Padrões de adoecimento e de morte da população brasileira: os renovados desafios para o Sistema Único de Saúde. Ciência & Saúde Coletiva, v. 12, supl., p. 1179-1790, 2007.; BRASIL, 2011BRASIL. Ministério da Saúde. Sistema de Informações sobre Mortalidade (SIM). 2011. Available at: <http://www2.datasus.gov.br/DATASUS/index.php?area=0205>. Access at: 22 Mar. 2014.
http://www2.datasus.gov.br/DATASUS/index...
; GUIMARÃES et al., 2015; MANSUR; FAVARATO, 2016MANSUR, A. D. P.; FAVARATO, D. Trends in mortality rate from cardiovascular disease in Brazil, 1980-2012. Arquivos Brasileiros de Cardiologia, v. 107, n. 1, p. 20-25, 2016.; BRANT et al., 2017BRANT, L. C. C. et al. Variations and particularities in cardiovascular disease mortality in Brazil and Brazilian states in 1990 and 2015: estimates from the Global Burden of Disease. Revista Brasileira de Epidemiologia [online], v. 20 (supl 1), p. 116-128, 2017.).
However, some studies suggest that mortality rates for cardiovascular disease have decreased since the 1980s (MANSUR et al., 2002MANSUR, A. D. P. et al. Trends of the risk of death due to circulatory, cerebrovascular, and ischemic heart diseases in 11 Brazilian capitals from 1980 to 1998. Arquivos Brasileiros de Cardiologia, v. 79, n. 3, p. 277-284, 2002.; GUIMARÃES et al., 2015; MANSUR; FAVARATO, 2016; BRANT et al., 2017). This trend was observed in each of Brazil’s regions, but the rates of decline have not been uniform. In more recent years, the trend has shifted and mortality resulting from CVD has begun to rise again. One of the main explanations for this is the growth of Brazil’s aging population in recent decades. The importance of cardiovascular mortality is observed by its impact on mortality levels. If cardiovascular diseases were eliminated, there would be an additional gain of two years, the highest recorded among all causes of death in the period (IHME, 2015). In parallel, mortality from CVD in 2015 represented 14.83% of all DALYs (Disability-Adjusted Life Years) registered in Brazil (IHME, 2015). It is also worth noting that the improvement of basic health conditions is another important aspect of this process because it depends on a population’s access to basic health serves, regardless of the quality.
In this paper, we investigate the spatial and temporal evolution of CVD mortality and how population age structure and age-specific mortality rates are related to observed differences in mortality levels from cardiovascular disease in the adult population (over 30 years of age), by sex, in Brazilian micro-regions from 1996 to 2015. Understanding the heterogeneity in the distribution of causes of deaths across regions and time in Brazil is vital in order to develop better public health interventions as well as to explain the variation and differentials in life expectancy at birth throughout the country.
We use a combination of demographic and standard decomposition methods to study this issue. Our analysis indicates there has been a decrease in the mortality rates resulting from cardiovascular disease, and that both the effects of age structure and level may have influenced the variation of deaths in Brazil over the period analyzed.
Contextualization
In general, most studies on cardiovascular diseases have focused on the entire country, major geographic regions (Southeast, Northeast, etc.), or very specific municipalities in Brazil (MANSUR et al., 2002; ISHITANI et al., 2006ISHITANI, L. H. et al. Desigualdade social e mortalidade precoce por doenças cardiovasculares no Brasil. Revista de Saúde Pública, v. 40, n. 4, p. 684-91, 2006.; MELO et al., 2006MELO, E. C. P.; CARVALHO, M. S.; TRAVASSOS, C. Distribuição espacial da mortalidade por infarto agudo do miocárdio no Município do Rio de Janeiro, Brasil. Cadernos de Saúde Pública, v. 22, n. 6, p. 1225-1236, 2006.; SOUZA et al., 2006; GODOY et al., 2007GODOY, M. F. de et al. Mortalidade por doenças cardiovasculares e níveis socioeconômicos na população de São José do Rio Preto, estado de São Paulo, Brasil. Arquivos Brasileiros de Cardiologia, v. 88, n. 2, p. 200-206, 2007.; ASARIA et al., 2012ASARIA, P. et al. Trends and inequalities in cardiovascular disease mortality across 7932 English electoral wards, 1982-2006: Bayesian spatial analysis. International Journal of Epidemiology, v. 41, n. 6, p. 1737-1749, 2012.; NOWBAR et al., 2014NOWBAR, A. N. et al. Global geographic analysis of mortality from ischaemic heart disease by country, age and income: statistics from World Health Organisation and United Nations. International Journal of Cardiology, v. 174, n. 2, p. 293-298, 2014.; RASELLA et al., 2014RASELLA, D. et al. Impact of primary health care on mortality from heart and cerebrovascular diseases in Brazil: a nationwide analysis of longitudinal data. BMJ, n. 349, 2014.; GUIMARÃES et al., 2015). There is an absence and need for studies investigating the variation of cardiovascular disease mortality, taking both time frame and spatial factors into consideration. The relevance of this study is explained by the need to update public policies on health and well-being and spatially focus them to meet the demands of an aging population subject to the risk of cardiovascular mortality.
Guimarães et al. (2015) estimate, temporally, the probabilities of death from ischemic heart disease (IHD) and cerebrovascular disease in Brazil. They note that the richest regions of the country, Southeast and South, have the highest rates for both diseases. Furthermore, the North and Northeast regions, the poorest regions, have the lowest rates. Souza et al. (2006) analyze trends in the risk of death from IHD and cerebrovascular disease in five regions of Brazil between 1981 and 2000. The authors point to a downward trend in mortality from cerebrovascular disease in the more developed regions of the country across all age groups and both sexes. Specifically, mortality from IHD dropped in the Southeast and South, while in the Center-West region, IHD deaths remained stable. Despite this, it is also apparent that there were increases in rates in the Northeast.
Ishitani et al. (2006) examine the association between socioeconomic indicators and adult mortality from CVD in Brazil. They analyze the deaths of people between the ages of 35 and 64 during the period 1999 and 2001 and found negative associations between mortality from CVD and the subgroup cerebrovascular-hypertensive disease and “income and education”, as well as “a direct association with poverty rates and poor housing conditions. […] For ischemic heart disease, there was an inverse association with poverty rates and education indicators, and a direct association with poor housing conditions”. Education levels continue to be associated with mortality from CVD and its subgroups. Specifically, they estimate that for every percentage point increase in the proportion of adults with higher levels of education, the mortality rate from cardiovascular disease decreases by 3.25 per 100,000 inhabitants. They conclude that the analysis of mortality in municipalities demonstrates the inverse relationship between cardiovascular disease and socioeconomic status, particularly levels of education. It is likely that better education results in improved living conditions and, consequently, has a positive impact on early mortality. Rasella et al. (2014) evaluate the possible impact of Brazil’s Family Health Program (FHP) on CVD mortality (heart and cerebrovascular disease) throughout the first decade of this century. The authors discovered a negative association between the “Family Health Program and mortality rates from in both unadjusted and adjusted models for demographic, social, and economic confounders”. Additionally, the implementation of the Family Health Program “increased the number of health education activities, home visits, and medical consultations and reduced hospitalization rates for cerebrovascular and heart disease”.
Melo et al. (2006) analyzed the spatial behavior of deaths from acute myocardial infarction (AMI) in the municipality of Rio de Janeiro for the year 2000. They show that the distribution of mortality from AMI in the city is heterogeneous and follows a pattern correlated with a steep social gradient, i.e., the study showed a higher concentration of risk of dying of a heart attack in poorer areas of the city. Godoy et al. (2007) analyzed mortality indicators for cardiovascular diseases in São José do Rio Preto (São Paulo/Brazil) and assessed mortality rates according to socioeconomic levels of the local population. The results show that the mortality rates for the municipality, the state and the country decreased between 1980 and 2002. In 2003, the national rate was “195.9 deaths per 100,000 inhabitants, the proportional mortality was 31.3% and the three main causes of death were cerebrovascular disease, myocardial infarction and hypertension”. The mortality rate of census tracts with the lowest socioeconomic level was 40% higher than those with the highest socioeconomic conditions.
Nowbar et al. (2014) performed a geographical study of mortality from ischemic heart disease (IHD) by country, age and income using data collected by the United Nations (WHO). Of the countries that provide mortality data, Russia, the USA and Ukraine had the highest number of deaths; however, China and India were estimated to have greater numbers. They also found that the number of deaths from IHD increases rapidly with age and that crude mortality rates (CMR) appear to be stable, while CMR standardized for age are declining. Nowbar et al. (2014) concluded that in countries where there are accurate and updated records of data, essentially European countries, in recent years, a continuous decline in standardized CMR for ischemic heart disease has been observed. However, the progressive aging of the population maintained high CMR from IHD. It cannot be said that the standard is consistent throughout the world, because many countries do not provide frequent annual data, including the United Arab Emirates, India and China.
Finally, Asaria et al. (2012) analyze trends and inequalities in CVD in all 7932 electoral districts in England between the years 1982 and 2006. The authors emphasize that the standard CMR from cardiovascular disease declined in most districts, but in 186 districts, this rate increased for women aged over 65 years. The drop was more pronounced where the initial mortality was higher.
Some issues not considered in these studies, which this paper incorporates, especially those that focus on Brazil, result from the evaluation of the quality of mortality data and correction of death underreporting. In parallel, and since mortality from cardiovascular disease in 2015 represented 14.83% of all DALYs (Disability-Adjusted Life Years) registered in Brazil (IHME, 2015), a spatial investigation of this cause of death is important, in that it can channel public investment to mitigate the problem. Previous work, by Mansur and Favarato (2016), focuses on mortality trends for five regions of the country. They show that the South and Southeast observed a decline in mortality rates from 1980 to 2012, whereas the North, Mid-West and Northeast regions observed an increase.
In this paper, we contribute to the discussion by evaluating the effect of the mortality function, the age structure and the interaction between them with regard to mortality from cardiovascular disease by Brazilian micro-regions and sex, from 1996 to 2015. We use decomposition methods to explain the difference observed in deaths from cardiovascular disease in the adult population (over 30 years). Furthermore, this article contributes to existing literature by focusing on smaller areas of a very diverse country and taking into consideration space as an important variable to understand changes in CVD mortality.
Data and methods
Study population, level of analysis and information source
We focus on deaths from cardiovascular disease from the 1996-2015 period. Mortality data follow the Tenth Revision of the International Classification of Diseases (ICD-BR-10), Chapter IX, and are available at Sistema de Informações sobre Mortalidade (SIM), DATASUS.1 1 Available at: <http://www2.datasus.gov.br/DATASUS/index.php?area=0205>. Accessed in: 22 Mar. 2014. The data are organized by sex (males and females), age (population over 30 years and in five-year groups up to 80 years and over) and cause of death, as well as by the geographical micro-region where the deceased resided. Population data, organized by age and sex, were obtained from the 2000 and 2010 Censuses and intercensal population estimates from the Brazilian Institute of Geography and Statistics (IBGE).2 2 <http://www.ibge.gov.br>. Finally, the cartographic bases used for spatial analysis are available from the IBGE.
The units of analysis used in this study are 558 Brazilian micro-regions, as proposed by the Brazilian Institute of Geography and Statistics (IBGE). One of the advantages of using this type of unit is that their boundaries are constant throughout the research period. Thus, it was possible to monitor and study the 558 areas between 1996 and 2015. Furthermore, it is assumed that there is internal homogeneity within the micro-regions, that is, significant changes only occur on the borders.
Limitations
In developing countries, such as Brazil, studies on mortality are limited by the poor quality of existing mortality data (HILL, 1987HILL, K. Estimating census and death registration completeness. Asian and Pacific Population Forum, v. 1, n. 3, p. 8-13, 1987.; LUY, 2010LUY, M. A classification of the nature of mortality data underlying the estimates for the 2004 and 2006 United Nations’ World Population Prospects. Comparative Population Studies, v. 35, n. 2, 2010.; QUEIROZ et al., 2017QUEIROZ, B. L. et al. Completeness of death-count coverage and adult mortality (45q15) for Brazilian states from 1980 to 2010. Revista Brasileira de Epidemiologia, v. 20, supl. 1, p. 21-33, 2017.). In addition, another common limitation of mortality studies in such countries is the under-reporting of deaths counts included in vital statistics (MATHERS et al., 2005MATHERS, C. D. et al. Counting the dead and what they died from: an assessment of the global status of cause of death data. Bulletin of the Word Health Organization, v. 83, n. 3, p. 171-179, 2005.; LUY, 2010; LIMA et al., 2014LIMA, E. E. C. de; QUEIROZ, B. L.; SAWYER, D. O. Método de estimação de grau de cobertura em pequenas áreas: uma aplicação nas microrregiões mineiras. Cadernos Saúde Coletiva, v. 22, n. 4, p. 409-418, 2014.; QUEIROZ et al., 2017). Parallel to this, Brazil is an extremely heterogeneous country regarding social, economic, cultural and demographical dimensions. The same can be said of the great differences in the quality of vital statistics found among Brazilian regions (PAES, 2005PAES, N. A. Avaliação da cobertura dos registros de óbitos dos estados brasileiros em 2000. Revista de Saúde Pública, v. 39, n. 6, p. 882-890, 2005.; FRANÇA et al., 2008FRANÇA, E. et al. Evaluation of cause-of-death statistics for Brazil, 2002-2004. International Journal of Epidemiology, v. 37, n. 4, p. 891-901, 2008.; AGOSTINHO, 2009AGOSTINHO, C. S. Estudo sobre a mortalidade adulta, para Brasil entre 1980 e 2000 e Unidades da Federação em 2000: uma aplicação dos métodos de distribuição de mortes. 2009. 243p. Tese (Doutorado em Demografia) – Centro de Desenvolvimento e Planejamento Regional, Universidade Federal de Minas Gerais, Belo Horizonte, 2009.; LIMA; QUEIROZ, 2014LIMA, E. E. C. de; QUEIROZ, B. L. Evolution of the deaths registry system in Brazil: associations with changes in the mortality profile, under-registration of death counts, and ill-defined causes of death. Cadernos de Saúde Pública, v. 30, n. 8, p. 1721-1730, 2014.; QUEIROZ et al., 2017). As a result of the heterogeneity of these aspects mentioned above, greater attention and effort on the part of public planners to improve on and propose solutions to these issues are required.
Several methods based on demographic factors have been developed to determine the quality of mortality data and estimate the degree of coverage of death counts in relation to the population. The death distribution methods are most commonly used to estimate the degree of coverage of adult mortality in non-stable populations and to investigate the quality of mortality data in periods between censuses (BENNETT; HORIUCHI, 1981BENNETT, N. G.; HORIUCHI, S. Estimating the completeness of death registration in a closed population. Population Studies, v. 47, n. 2, p. 207-21, 1981.; HILL, 1987; TIMAEUS, 1991TIMAEUS, I. M. Measurement of adult mortality in less developed countries: a comparative review. Population Index, n. 57, p. 552-568, 1991.; HILL et al., 2009HILL, K.; YOU, D.; CHOI, Y. Death distribution methods for estimating adult mortality: sensitivity analysis with simulated data errors. Demographic Research, v. 21, p. 235-254, 2009.; LIMA et al., 2014; LIMA; QUEIROZ, 2014).
In this paper, we use estimates of completeness of death counts registration produced by Lima and Queiroz (2014), specifically those using the “Adjusted Synthetic Extinct Generations (SEG-adj)” method proposed by Hill et al. (2009). These estimates relate to all causes of death. Thus, a strong assumption of this study is that there is no significant difference between the quality of mortality data for all causes of deaths compared to cardiovascular diseases. As in other studies, the possible underreporting found in deaths from cardiovascular diseases will be fixed, using all causes of death as a basis (MURRAY; LOPEZ, 1996MURRAY, C. J. L.; LOPEZ, A. D. Estimating causes of death: new methods and global and regional applications for 1990. The global burden of disease. Cambridge, MA: Harvard University Press, 1996. p. 117-200.; LOPEZ et al., 2006LOPEZ, A. D. et al. Measuring the global burden of disease and risk factors, 1990–2001. In: LOPEZ, A. D. et al. (Ed.). Global burden of disease and risk factors. Washington (DC): The International Bank for Reconstruction and Development / The World Bank; New York: Oxford University Press; 2006. v. 1, p. 1-14.).
Lima and Queiroz (2014) present estimates of the degree of coverage by meso-regions by using the methods of “Synthetic Extinct Generations – SEG” (Bennett; Horiuchi, 1981), “General Growth Balance – GGB” (HILL, 1987), and “adjusted Synthetic Extinct Generations – SEG-adj” (HILL et al., 2009). However, as the existing literature does not indicate the best method for the correction of death underreporting, we decided to use the SEG-adj method because it is considered, in general, to be more robust than others.3 3 For more details about the methods SEG, GGB and SEG-adj view Bennett and Horiuchi (1981), Hill (1987), Timaeus (1991), Hill et al. (2009), Lima et al. (2014), Lima and Queiroz (2014).
A second limitation is the quality of registration of the cause of death. To analyze mortality trends in the whole country accurately, it is crucial to consider the differences in coverage of the official health statistics system and, most importantly, the proportion of incorrectly defined deaths (FRANÇA et al., 2008). Historically, the death declarations issued in the North and Northeast states had lower coverage and were of poorer quality compared to those in Southeast and South states. However, since the 2000´s there has been an impressive improvement in both areas. The improved quality of mortality information in the North and Northeast has radically changed mortality trends, largely due to non-communicable diseases. Data taken from 1996 onwards and several other papers argue and show that the quality of information collected has improved since then, allowing for proper comparisons across regions (BORGES, 2017; GUIMARÃES et al., 2015).
We are also concerned with the high percentage of unreported information found in the data from the Sistema de Informações sobre Mortalidade (SIM) on socioeconomic variables. This invalidates any analysis intending to use variables such as income, education and race. Thus, this paper will be limited to the study of demographic variables such as sex and age, which, by themselves, will make a meaningful contribution to the studies on cardiovascular mortality in Brazil.
Decomposition
Standardization is traditionally applied when the comparison of rates between groups are confounded by substantial differences in the groups’ composition. In such circumstances, standardization is used to adjust these rates (CHEVAN; SUTHERLAND, 2009CHEVAN, A.; SUTHERLAND, M. Revisiting Das Gupta: refinement and extension of standardization and decomposition. Demography, v. 46, n. 3, p. 429-449, 2009.). According to the authors mentioned above, the decomposition technique takes the results of standardization one step further by assigning the differences found in the rates of the components, i.e., the changes in function mortality or age structure.
Several decomposition methods used in demography are presented in a variety of existing literature (KITAGAWA, 1955; POLLARD, 1983POLLARD, J. H. Some methodological issues in the measurement of sex mortality patterns. In: LOPEZ, A. D.; RUZICKA, L. T. Sex differentials in mortality: trends, determinants and consequences. Canberra, Australia: Australian National University, 1983 (Department of Demography Miscellaneous Series, 4). ; ARRIAGA, 1984ARRIAGA, E. E. Measuring and explaining the change in life expectancies. Demography, v. 21, n. 1, p. 83-96, 1984.; SÁNCHEZ; PRESTON, 2007; among others). In this paper, we use an adaptation of the methodology proposed by Kitagawa (1955) which aims to decompose rates between territorial units in the same period. Kitagawa (1955) observed that Crude Death Rates (CDR) were a simple weighted average, by population, of age specific mortality rates. She proposes a formula that splits the total difference of CDR, in two populations, into two parts: mortality rates and population composition (GUPTA, 1978GUPTA, P. D. A general method of decomposing a difference between two rates into several components. Demography, v. 15, n. 1, p. 99-112, 1978.). In other words, Kitagawa’s decomposition is used to separate the effects of population structure, i.e. the shape of the age pyramid, from the real death rates experienced at each age. If a population pyramid is biased toward older ages, the CDR may be quite high, even though mortality at each age is low.
It is important to stress that Kitagawa’s decomposition method is an arithmetic manipulation of a difference. This implies that the decomposition is not unique since other terms could be included in the formula. However, the proposed method is considered a good approximation of parts of a change of the crude death rate. In addition, the method produces an interaction term representing the inter-dependence between the two comments. As pointed out by Kitagawa, changes in rates and population composition are not independent, as one might affect changes in the other. In general, this limitation arises due to the choice of the standard population and the interaction term is not overly simple or intuitive to interpret. In this paper, we focus the analysis on the main components (age structure and rates).
We use the decomposition rates of two territorial units (Brazil, the country as a whole, as one unit, and its micro-regions as the other) at two points in time (the average of the five-year periods, in the four five-year periods; and Brazil, 2010). The variation in mortality rates from cardiovascular diseases in a micro-region any in time can be written as follows:
Where: CMRCVD is the crude mortality rate from cardiovascular disease, Brazil 2010 (standard) and each micro-region a; Mx is the specific rate of mortality from cardiovascular disease in Brazil in 2010, of age group x; Mx,a is the specific rate of mortality from cardiovascular diseases in micro-region a, of age group x; Px is the population of age group x in the standard population (Brazil, 2010); P is the standard total population (Brazil, 2010); Px,a is the proportion of age group x in the population of micro-region a; Pa is the total population of micro-region a; and I represents the residual, i.e., the effect of the interaction between age structure and mortality levels.
The aim is to find the additive contribution of the effect of each factor, composition and rate, on the variation among overall rates of two or more populations (VAUPEL et al., 2002VAUPEL, J. W. et al. Decomposing demographic change into direct vs. compositional components. Demographic Research, v. 7, n. 1, p. 1-14, 2002.; VAUPEL; ROMO, 2003VAUPEL, J. W.; ROMO, V. C. Decomposing change in life expectancy: A bouquet of formulas in honor of Nathan Keyfitz’s 90th birthday. Demography, v. 40, n. 2, p. 201-216, 2003.). That is, in the case of this paper, given two populations, Brazil and micro-regions, the difference between cardiovascular deaths in these two populations will be disaggregated to show how much of this difference is due to the changes in the function mortality and age structure. It should be highlighted that age-specific mortality rates for cardiovascular diseases increase rapidly with age (and that this paper only analyzes individuals aged 30 and above), with about 30% of deaths occurred between ages 30 and 60.
Results and discussion
Crude mortality rate from cardiovascular disease
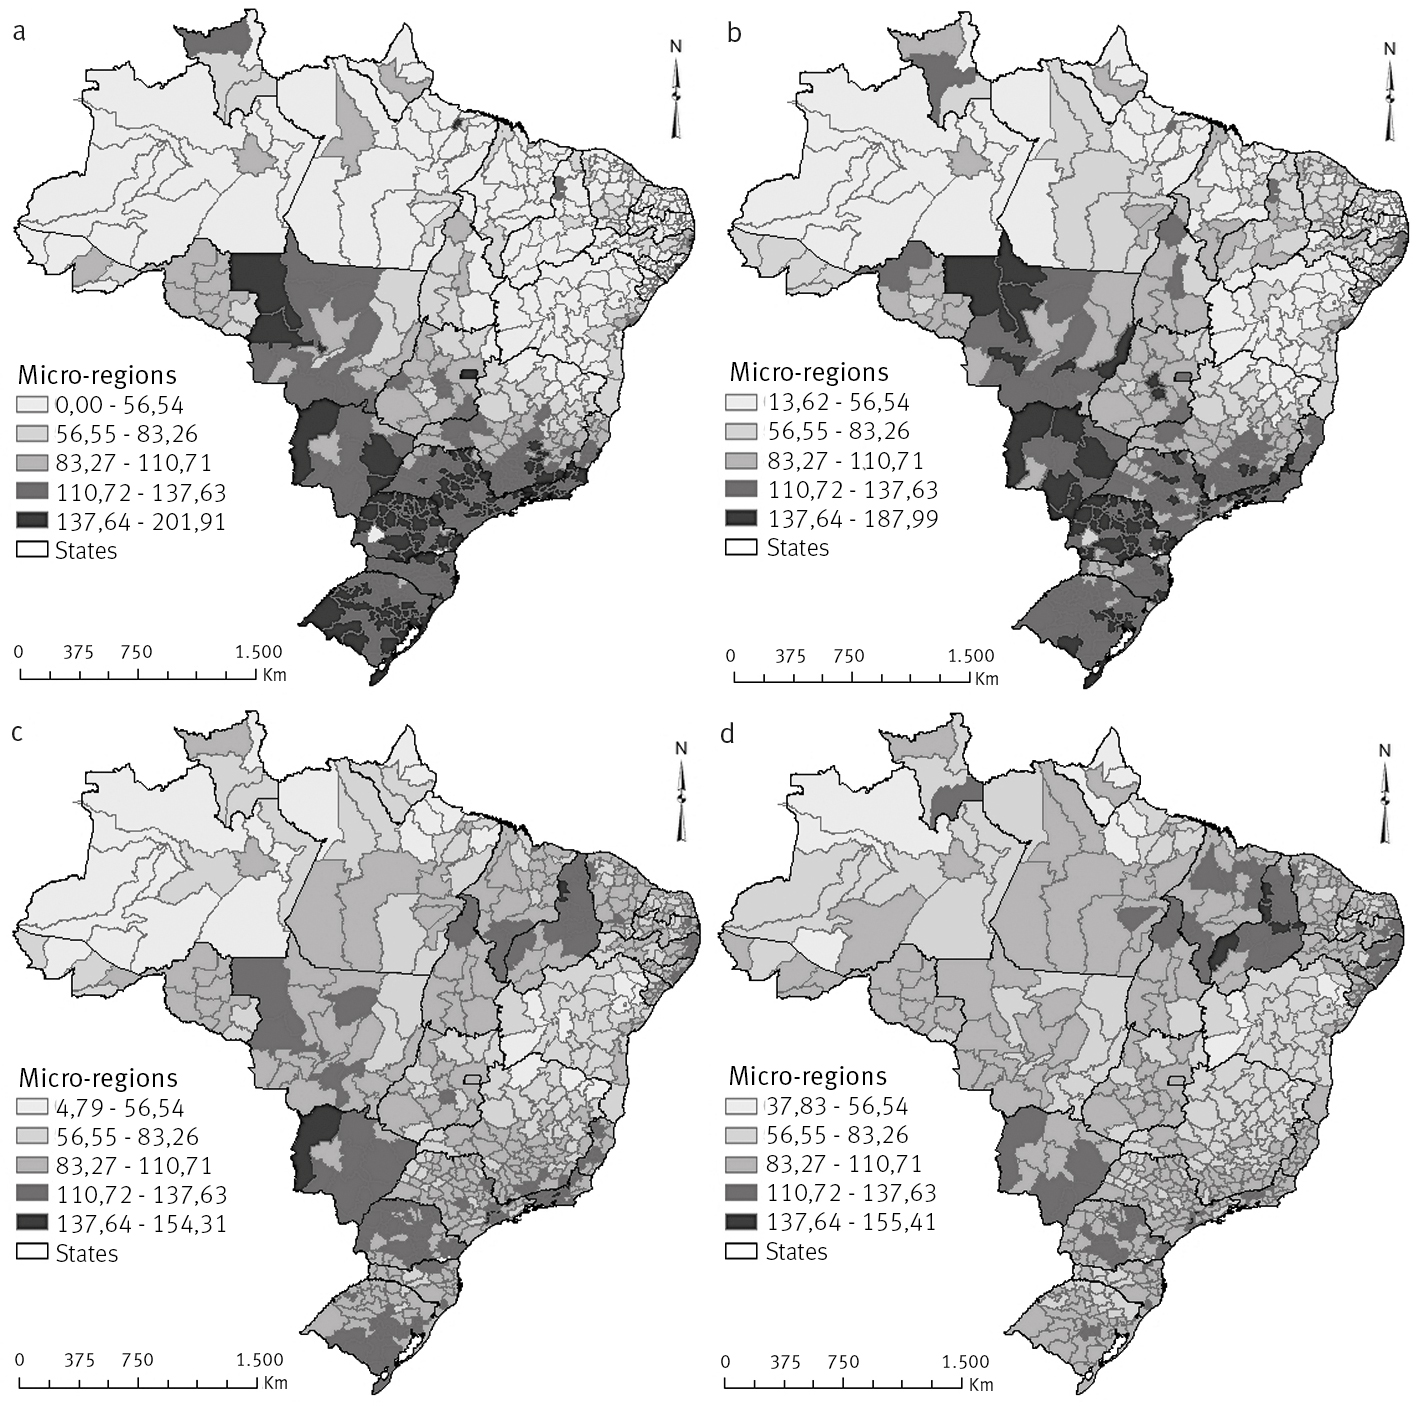
Figure 1 shows thematic maps of crude death rates for males from cardiovascular diseases using unadjusted data from the Sistema de Informações sobre Mortalidade (SIM) for the four five-year periods studied (1996-2000, 2001-2005, 2006-2010 and 2011-2015).4 4 This exercise was done for both sexes separately and the four five-year periods studied (1996-2000, 2001-2005, 2006-2010 and 2011-2015). However, we present only the spatial result only for males while female trends are discussed in the text. Figure 1 should be analyzed with caution since it might be misleading due to data limitations, as discussed before. In addition to the matter of underreporting of death counts registration, there is also the possible impacts of different age structures across regions within the country. Throughout the paper, we use Jenks Natural Breaks to classify the regions. These are based on the data and class breaks are identified that best group similar values and that maximize the differences between classes.
Males have higher CMRCVD than females in all five-year periods. In addition, for both sexes, CMRCVD saw an overall decline over the study period. However, while we observe a more homogeneous spatial configuration between sexes, there was a more heterogeneous distribution within the same sex. For males, in the Center-West, South and South-East (except for the northern region of the state of Minas Gerais), we found a decline in CMRCVD over time. More specifically, there was a decrease of approximately 23.5% between the highest CMRCVD found in the five-year periods from 1996 to 2015 and the highest value verified from 2006-2010. In the North and Northeast regions, and the northern region of the state of Minas Gerais, there was an increase in CMRCVD over the years. The spatial configuration for females was similar to that described above for males.
This information, data and analysis are used to display and reinforce that, in recent decades, the Brazilian population has experienced significant changes in its morbidity and mortality patterns. Simultaneously, Brazil’s age structure has evolved alongside the country’s epidemiological transition. “Given this context, the demand for studies identifying age pattern and adult mortality differentials in Brazil is increasing” (LIMA et al., 2014). However, the evolution of CMRCVD over time and space is affected by mortality level, population age structure and data quality. In the next sections, we discuss each of these points. Therefore, in order to have adequate estimates of mortality level and pattern, it is essential to assess and, if necessary, correct quality mortality statistics (LUY, 2010).

Crude death rates for cardiovascular mortality (x1000) in the adult population, males, micro-regions, Brazil - fiveyear periods 1996-2000(a), 2001-2005(b), 2006-2010(c) and 2011-2015(d)
Cardiovascular mortality structure of Brazilian micro-regions
The first results (observed data) of deaths from cardiovascular disease in Brazil (Figure 1) raised certain issues and problems that need to be addressed, such as the under-enumeration of deaths. Therefore, analysis of the quality of death records of the Brazilian micro-regions for the four five-year periods studied in this paper (1996-2000, 2001-2005, 2006-2010 and 2011-2015) is not only a necessary step, but one of the utmost importance.
Estimates concerning the degree of completeness of death count coverage were obtained from Lima and Queiroz (2014). The estimates of this study related to all causes of death. As discussed earlier, only one “cause of death” will be studied in this paper – deaths resulting from cardiovascular diseases. Therefore, one of the assumptions of this paper is that there is no large variation in death underreporting according to the cause.
Therefore, before referring to the decomposition of cardiovascular mortality rates, the mortality structure of Brazilian micro-regions was evaluated, as these were used to calculate mortality levels. Despite signs of instability observed at specific rates of cardiovascular mortality in 558 micro-regions, it is believed that mortality functions can be used as the model structure. We assume that there is no great variation between the mortality pattern observed for all causes of death and that found specifically for deaths from cardiovascular disease. The implication of this assumption is that, if death records for cardiovascular diseases are better and homogeneous across the country, we would be overestimating mortality rates by cardiovascular diseases in regions where completeness of death counts is lower. However, Queiroz et al. (2017) show that there is a convergence on the quality of the death registration system in the country and we can assume that the overall quality is relates to the quality of specific causes of deaths. Borges (2017) also highlights the improvement of quality of causes of death information in recent years.
Decomposition of standardized crude rates (SCRs) of cardiovascular mortality
Following the evaluation of cardiovascular mortality structures, the next step was to attribute the difference found in rates to the components, i.e., changes in the mortality rates or population age structure. For this, we used Kitagawa´s decomposition methods.5 5 The procedures and details are specified in the methodological section. Decomposition was conducted for all four five-year periods (1996-2000, 2001-2005, 2006-2010 and 2011-2015) and both sexes separately. However, out of a concern with keeping the paper concise and presentable, we decided to present only spatial results for males over the five-year period 2006-2010.6 6 The full results require three maps for each sex and five-year period, i.e., 24 maps in total. We believe this decision will not hinder reader experience as the analysis of the chosen five-year period provides a clear indication of the other results.
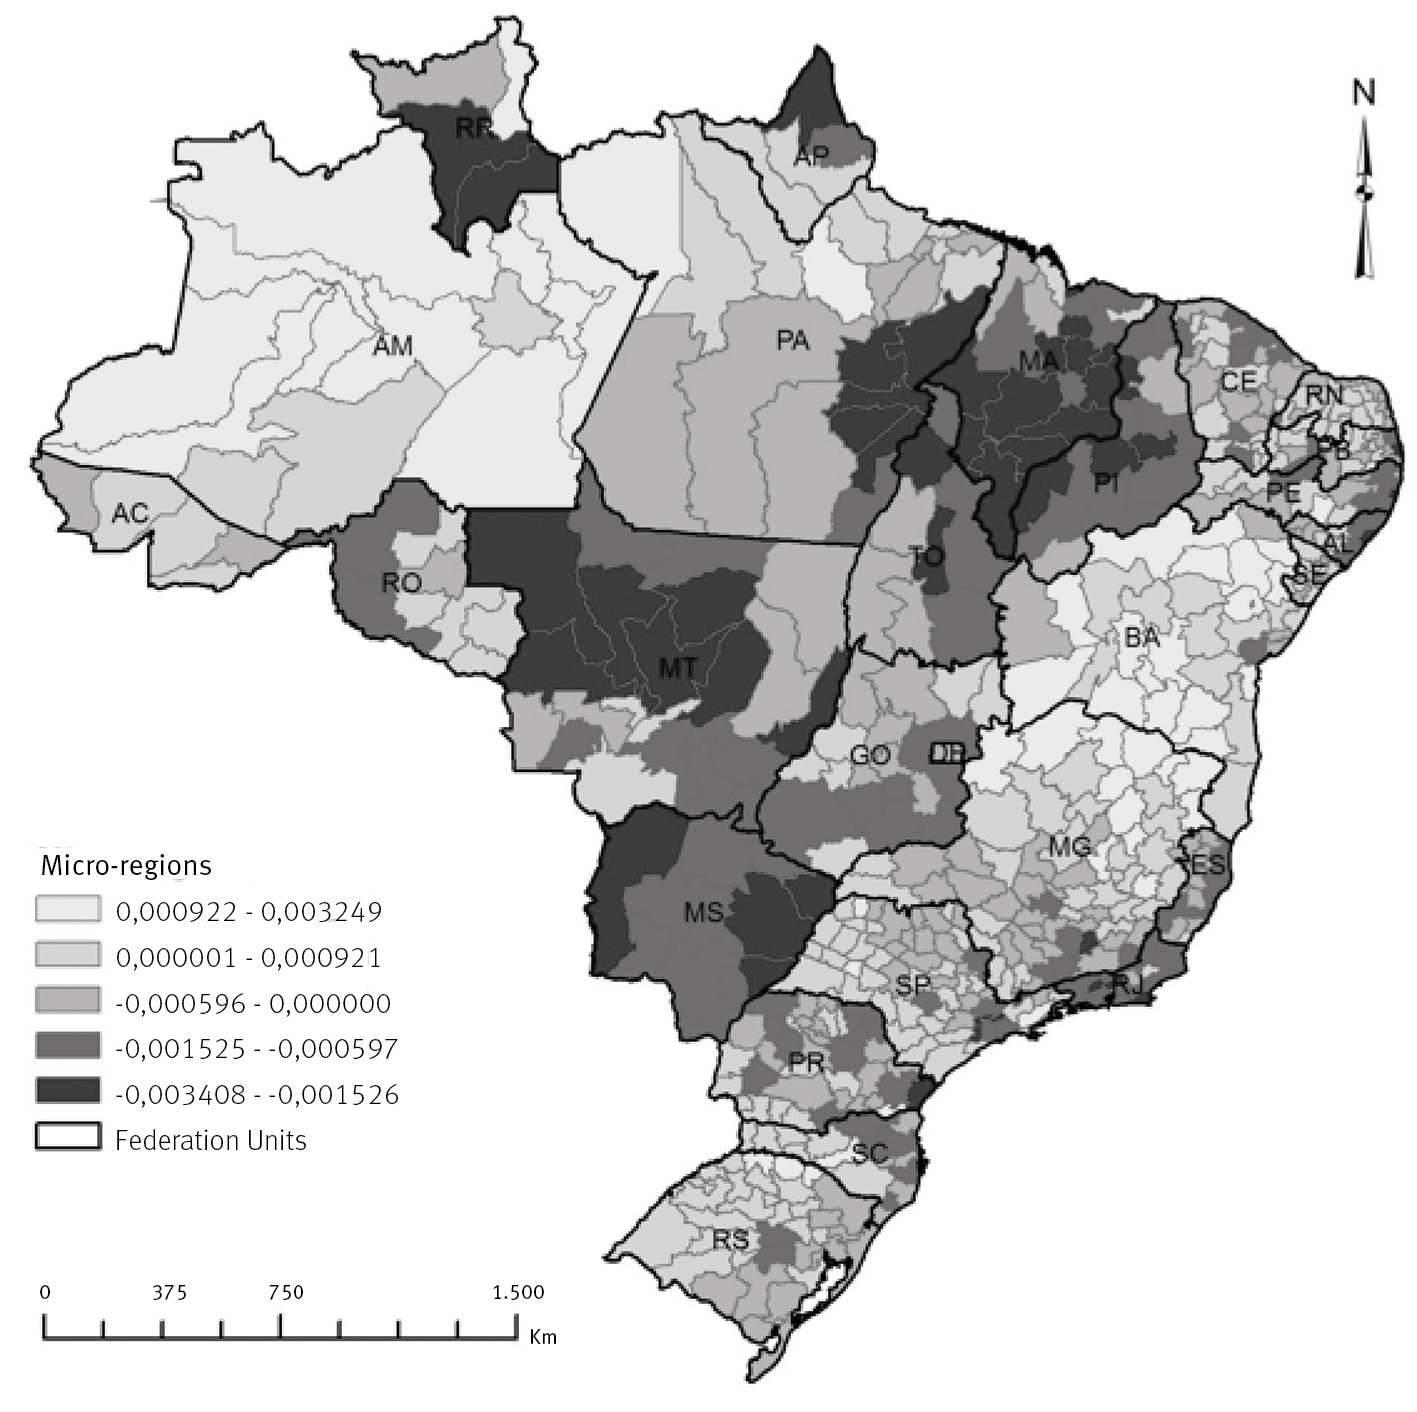
Tables 1 and 2 present the decomposition of the mortality rate, average across areas, over the period under analysis. The rates across areas experienced great variations over time. The results are based on the comparison between Brazilian rates (standards) and each region. Negative values indicate that the specific component contributes to a higher rate compared with the standard, and a positive value indicates a contribution to a lower rate. We also present average, minimum and maximum differences between crude mortality rates in Brazil 2010 (used as a standard) and each micro-region (558 Brazilian micro-regions), the effect of age (age effect – Figure 2), the mortality function (rate effect – Figure 3) and the effect of the interaction between age structure and the level of mortality for each five-year period and sex.
For better understanding of the tables below, we use males in the micro-region of São Paulo for the five-year period of 2001-2005 as an example. In this location, the difference between crude mortality rate for Brazil and the micro-region of São Paulo (2001-2005) was -0.000681. That is, the crude mortality rate for the micro-region of São Paulo was 0.000681 greater than the crude mortality rate standard (Brazil, 2010). The -0.000681 value found in the micro-region of São Paulo can be broken down into -0.001602 from the effect rate, indicating lower rates than those observed in Brazil, and 0.000654 from the age effect, indicating older age structure, in the opposite direction. The remainder, 0.000267, is the effect of the interaction between age structure and the mortality level. That is, even with lower mortality rates, the number of deaths by cardiovascular diseases in São Paulo is larger due to the population age structure.
The average difference found between all the 558 micro-regions was -0.000147, the lowest value found was -0.003468 in the micro-region of Serrana (Rio de Janeiro), and the highest value was 0.003261, in the micro-region of Japura (Amazonas) as Table 1 shows. The micro-region of São Paulo was therefore below average compared to the Brazilian micro-regions.
Decomposition of crude rates of mortality from cardiovascular disease for men in five-year periods 1996-2000, 2001-2005, 2006-2010 and 2011-2015. Mean, minimum and maximum values of the micro-regions
Decomposition of crude rates of mortality from cardiovascular disease for women in five-year periods 1996-2000, 2001-2005, 2006-2010 and 2011-2015. Mean, minimum and maximum values of the micro-regions
We present the results of decomposition for the 2006-2010 period for males in Figure 2 (effect of age structure) and Figure 3 (effect of mortality level). We use them to answer the following question: Which contribution is greater, that from changes in the level of mortality or that from changes in the age distribution of the population? If the contribution of the mortality level is higher than that estimated for the changes in age structure, then variables that affect the level of cardiovascular mortality, such as socioeconomic, environmental, cultural and behavioral conditions, can represent some of the main risk factors for deaths from cardiovascular disease. In this case, age structure contributes less to the decrease in mortality than other associated factors. On the other hand, if it were the case that the effects of age structure outweighed the effects of the level of mortality, the importance of age structure to explain the variation between the crude mortality rates would be higher than the level of mortality. To investigate which of the two contributions - level of mortality or age structure - has more relevance at state and micro-regional levels, will prove very valuable when determining the importance of sociodemographic factors (sex and age) to explain deaths from cardiovascular disease. In this analysis, we focus on the overall results for regions and states rather than on a detailed look at the microregions. However, we highlight some specific cases within each larger area.
In the North region, for example, the state of Amazonas shows two positive effects: the variation between crude mortality rates of micro-regions in relation to crude mortality rates of Brazil in this state is much lower due to the age structure effect and the effect of the mortality level for cardiovascular disease. In the state of Tocantins, the opposite occurs: the two effects are negative, which means that the crude mortality rate of the micro-region is greater than the crude mortality rates standard for Brazil in 2010. In the other states of the North region, the effect of age structure is negative for all micro-regions in comparison to Brazil. Furthermore, the effect of mortality level is heterogeneous, with positive and negative variation when taking Brazil as reference. In the Northern region, there is a younger population; this may explain why crude mortality rates of micro-regions are smaller than the standard in several micro-regions.
In the Northeastern region, the states of Alagoas, Pernambuco, Ceará, Piauí and Maranhão show a negative effect from both age structure and mortality level, i.e., the crude mortality rates of micro-regions are greater than the crude mortality rates standard in these states for the two effects. In the states of Bahia, Sergipe, Paraiba and Rio Grande do Norte, results show a predominantly negative effect from age structure, but a positive effect from the level of mortality.

Regarding the Center-West region, excluding the state of Goiás, the effects are present again, but in opposite directions. Whereas the effect of age structure is positive for the states of Mato Grosso and Mato Grosso do Sul, the effect of mortality level is negative. In these states, there is a younger population less susceptible to mortality risk from cardiovascular diseases related to age. This trend also applies to micro-regions of Brasília. With regard to the state of Goiás, both effects are negative in most micro-regions.

Effect of mortality level (rate effect), adult population, men – five year period 2006-2010
In the Southeast region, the states of Rio de Janeiro and Espírito Santo have two negative effects, i.e., the crude mortality rates of micro-regions are greater than the standard crude mortality rates. The effect of age structure is also predominantly negative in the states of Minas Gerais and São Paulo. However, the effect of mortality level is heterogeneous across micro-regions. While in Minas Gerais northern areas show a positive effect and southern areas show a negative effect, in São Paulo, the effect of mortality level is positive for the western, southern and northern regions and negative for others. The configuration described for the Southeast, generally speaking, points to an aging population since the effect of the age structure was negative for almost all micro-regions, i.e., crude mortality rates of micro-regions were higher compared to the standard population mainly due to older population age strucutre. However, in some micro-regions, especially in the states of Minas Gerais and São Paulo, the effect of mortality level was positive, indicating that the degree of mortality from cardiovascular disease also has a considerable impact on these areas.
Finally, the southern region of the state of Rio Grande do Sul shows a negative effect on age structure in most of its micro-regions. This configuration is repeated for the Midwestern region of the Paraná state. On the other hand, the state of Santa Catarina and central-eastern Paraná show positive effects on age structure. As for the effect rate, while the state of Paraná and eastern parts of Rio Grande do Sul and Santa Catarina show a negative effect, other micro-regions have a positive effect. In Rio Grande do Sul and in the Midwestern area of Paraná, aging population is crucial for the existence of a negative effect on the age structure of micro-regions. In contrast, in the eastern regions of Santa Catarina and Parana, the level of mortality is predominant.
Conclusion
In recent years, the distribution of mortality and modal age of death are concentrating in older ages, even in developing countries. Upon research of specific causes of deaths, it is observed that the risk of death from a specific cause is related to health conditions, institutional factors, the environment and the socioeconomic situation to which the population is exposed. These contrasts are present in Brazil with important regional diversities, which offer possibilities for targeted public interventions, but at the same time present challenges which a country of continental dimensions cannot avoid. Brazilian health-system planning needs an understanding of the absolute burden of cardiovascular disease and the effect of population aging. For example, regions with a declining incidence of cardiovascular diseases may still need to invest heavily in health promotion and treatment given trends in population age structure that might increase the number of deaths from this specific cause.
The aim of this paper was to research how the effects of age composition and age specific mortality rates can explain the observed difference in deaths from cardiovascular disease in the adult population (over 30 years of age), by sex, in Brazilian micro-regions, from 1996-2015. To that end, we produced estimates and analyzed dynamics and trends in mortality from cardiovascular disease in Brazil at the level of geographic micro-regions, using a combination of demographic techniques and standard decomposition methods in the past two decades.
The overall results suggest that, after correcting for underreporting of death counts, there is a decline in the rates of deaths from cardiovascular disease over the period studied. As suggested by Mansur and Favarato (2016), variations in mortality levels by cardiovascular diseases, at the local level, seem to be associated with access to proper healthcare and are strongly related to socioeconomic factors. We also observed a significant variation in deaths from cardiovascular disease over time due to the country’s development process, represented by its regional disparities, whether socioeconomic or epidemiological. This was indicated by the improvement in access and quality of health services in recent decades as well as by the increase in Brazilian life expectancy. The overall results also indicate that both the effect of age structure and the effect level may have influenced the variation in deaths from cardiovascular diseases recorded in Brazil over the analyzed period. In that case, oldest age structures - as in the case of South and Southeast regions - contribute to deaths from cardiovascular disease at a higher rate, and the effect of age composition in differences in deaths from cardiovascular diseases should be greater, as a larger pool of different age structures within populations is compared.
The paper has one main limitation related to the quality of mortality data. Although completeness of death counts coverage has improved overtime in the country, there are still great differences across regions (QUEIROZ et al., 2017). Moreover, there is a lack of studies on the quality of completeness of registration for specific causes of deaths, and we therefore had to assume that the same level of correction applied to all-cause mortality could be applied to the specific cause. In the event that quality of registration of a specific cause of death was uniform across the regions of the country, our alternative would overestimate the age-specific mortality rate for that cause.
In some cases, the specific rates of mortality from cardiovascular disease and age structures pointed in opposite directions: as one increases the differences between deaths, the other reduces the gap. Thus, for example, if there were no differences in age structure among women and men, the proportion of deaths in the female population – which generally have older age distribution than men – could be even smaller than that observed.
Finally, this paper presents two original contributions: a) an analysis of the phenomenon in small areas (micro-regions), and b) use of the decomposition rate of cardiovascular mortality to understand the impact of shifts in age structure and function mortality. These results are important and helpful to public health planning and evaluation. Better knowledge of spatial variation in the health conditions of the population allows for more specific public policies (including but not limited to health) and an improvement to the well-being of the population.
Notes
-
1
Available at: <http://www2.datasus.gov.br/DATASUS/index.php?area=0205>. Accessed in: 22 Mar. 2014.
-
2
<http://www.ibge.gov.br>.
-
3
For more details about the methods SEG, GGB and SEG-adj view Bennett and Horiuchi (1981), Hill (1987), Timaeus (1991), Hill et al. (2009), Lima et al. (2014), Lima and Queiroz (2014).
-
4
This exercise was done for both sexes separately and the four five-year periods studied (1996-2000, 2001-2005, 2006-2010 and 2011-2015). However, we present only the spatial result only for males while female trends are discussed in the text.
-
5
The procedures and details are specified in the methodological section.
-
6
The full results require three maps for each sex and five-year period, i.e., 24 maps in total.
References
- AGOSTINHO, C. S. Estudo sobre a mortalidade adulta, para Brasil entre 1980 e 2000 e Unidades da Federação em 2000: uma aplicação dos métodos de distribuição de mortes. 2009. 243p. Tese (Doutorado em Demografia) – Centro de Desenvolvimento e Planejamento Regional, Universidade Federal de Minas Gerais, Belo Horizonte, 2009.
- ARAÚJO, J. D. de. Polarização epidemiológica no Brasil. Informe Epidemiológico do SUS, Brasília, ano I, n. 2, p. 5-16, 1992.
- ARAÚJO, J. D. de. Polarização epidemiológica no Brasil. Epidemiologia e Serviços de Saúde, v. 21, n. 4, p. 533-538, 2012.
- ARRIAGA, E. E. Measuring and explaining the change in life expectancies. Demography, v. 21, n. 1, p. 83-96, 1984.
- ASARIA, P. et al. Trends and inequalities in cardiovascular disease mortality across 7932 English electoral wards, 1982-2006: Bayesian spatial analysis. International Journal of Epidemiology, v. 41, n. 6, p. 1737-1749, 2012.
- BARRETO, M. L.; CARMO, E. H. Padrões de adoecimento e de morte da população brasileira: os renovados desafios para o Sistema Único de Saúde. Ciência & Saúde Coletiva, v. 12, supl., p. 1179-1790, 2007.
- BENNETT, N. G.; HORIUCHI, S. Estimating the completeness of death registration in a closed population. Population Studies, v. 47, n. 2, p. 207-21, 1981.
- BORGES, G. M. Health transition in Brazil: regional variations and divergence/convergence in mortality. Cadernos de Saúde Pública [online], v. 33, n. 8, 2017.
- BRANT, L. C. C. et al. Variations and particularities in cardiovascular disease mortality in Brazil and Brazilian states in 1990 and 2015: estimates from the Global Burden of Disease. Revista Brasileira de Epidemiologia [online], v. 20 (supl 1), p. 116-128, 2017.
- BRASIL. Ministério da Saúde. Sistema de Informações sobre Mortalidade (SIM). 2011. Available at: <http://www2.datasus.gov.br/DATASUS/index.php?area=0205>. Access at: 22 Mar. 2014.
» http://www2.datasus.gov.br/DATASUS/index.php?area=0205 - CHEVAN, A.; SUTHERLAND, M. Revisiting Das Gupta: refinement and extension of standardization and decomposition. Demography, v. 46, n. 3, p. 429-449, 2009.
- FRANÇA, E. et al. Evaluation of cause-of-death statistics for Brazil, 2002-2004. International Journal of Epidemiology, v. 37, n. 4, p. 891-901, 2008.
- FRANÇA, E. et al. Cause-specific mortality for 249 causes in Brazil and states during 1990–2015: a systematic analysis for the global burden of disease study 2015. Population Health Metrics, v. 15, n. 39, 2017.
- FRENK, J. et al. La transición epidemiológica en América Latina. Boletín de la Oficina Sanitaria Pan-americana, v. 111, n. 6, p. 485-496, 1991.
- GODOY, M. F. de et al. Mortalidade por doenças cardiovasculares e níveis socioeconômicos na população de São José do Rio Preto, estado de São Paulo, Brasil. Arquivos Brasileiros de Cardiologia, v. 88, n. 2, p. 200-206, 2007.
- GUIMARÃES, R. M. et al. Regional differences in cardiovascular mortality transition in Brazil, 1980 to 2012. Revista Panamericana de Salud Pública, v. 37, n. 2, p. 83-89, 2015.
- GUPTA, P. D. A general method of decomposing a difference between two rates into several components. Demography, v. 15, n. 1, p. 99-112, 1978.
- HILL, K. Estimating census and death registration completeness. Asian and Pacific Population Forum, v. 1, n. 3, p. 8-13, 1987.
- HILL, K.; YOU, D.; CHOI, Y. Death distribution methods for estimating adult mortality: sensitivity analysis with simulated data errors. Demographic Research, v. 21, p. 235-254, 2009.
- INSTITUTE FOR HEALTH METRICS AND EVALUATION. Data Visualizations. 2015. Available at: <http://www.healthdata.org/results/data-visualizations>. Access at: 05 Mar. 2015.
» http://www.healthdata.org/results/data-visualizations - ISHITANI, L. H. et al. Desigualdade social e mortalidade precoce por doenças cardiovasculares no Brasil. Revista de Saúde Pública, v. 40, n. 4, p. 684-91, 2006.
- KITAGAWA, E. M. Components of a difference between two rates. Journal of the American Statistical Association, v. 50, n. 272, p. 1168-1194, 1995.
- LESSA, I. Doenças crônicas não-transmissíveis no Brasil: um desafio para a complexa tarefa da vigilância. Ciência & Saúde Coletiva, v. 9, n. 4, p. 931-943, 2004.
- LIMA, E. E. C. de; QUEIROZ, B. L.; SAWYER, D. O. Método de estimação de grau de cobertura em pequenas áreas: uma aplicação nas microrregiões mineiras. Cadernos Saúde Coletiva, v. 22, n. 4, p. 409-418, 2014.
- LIMA, E. E. C. de; QUEIROZ, B. L. Evolution of the deaths registry system in Brazil: associations with changes in the mortality profile, under-registration of death counts, and ill-defined causes of death. Cadernos de Saúde Pública, v. 30, n. 8, p. 1721-1730, 2014.
- LOPEZ, A. D. et al. Measuring the global burden of disease and risk factors, 1990–2001. In: LOPEZ, A. D. et al. (Ed.). Global burden of disease and risk factors. Washington (DC): The International Bank for Reconstruction and Development / The World Bank; New York: Oxford University Press; 2006. v. 1, p. 1-14.
- LOTUFO, P. A. Mortalidade pela doença cerebrovascular no Brasil. Revista Brasileira de Hipertensão, v. 7, n. 4, p. 387-91, 2000.
- LOTUFO, P. A.; BENSEÑOR, I. M. Stroke mortality in Brazil: one example of delayed epidemiological cardiovascular transition. International Journal of Stroke, v. 4, n. 1 p. 40-41, 2009.
- LOTUFO, P. A. et al. A reappraisal of stroke mortality trends in Brazil (1979-2009). International Journal of Stroke, v. 8, n. 3, p. 155-163, 2013.
- LUY, M. A classification of the nature of mortality data underlying the estimates for the 2004 and 2006 United Nations’ World Population Prospects. Comparative Population Studies, v. 35, n. 2, 2010.
- MANSUR, A. D. P. et al. Trends of the risk of death due to circulatory, cerebrovascular, and ischemic heart diseases in 11 Brazilian capitals from 1980 to 1998. Arquivos Brasileiros de Cardiologia, v. 79, n. 3, p. 277-284, 2002.
- MANSUR, A. D. P.; FAVARATO, D. Trends in mortality rate from cardiovascular disease in Brazil, 1980-2012. Arquivos Brasileiros de Cardiologia, v. 107, n. 1, p. 20-25, 2016.
- MATHERS, C. D. et al. Counting the dead and what they died from: an assessment of the global status of cause of death data. Bulletin of the Word Health Organization, v. 83, n. 3, p. 171-179, 2005.
- MELO, E. C. P.; CARVALHO, M. S.; TRAVASSOS, C. Distribuição espacial da mortalidade por infarto agudo do miocárdio no Município do Rio de Janeiro, Brasil. Cadernos de Saúde Pública, v. 22, n. 6, p. 1225-1236, 2006.
- MURRAY, C. J. L.; LOPEZ, A. D. Estimating causes of death: new methods and global and regional applications for 1990. The global burden of disease. Cambridge, MA: Harvard University Press, 1996. p. 117-200.
- NOWBAR, A. N. et al. Global geographic analysis of mortality from ischaemic heart disease by country, age and income: statistics from World Health Organisation and United Nations. International Journal of Cardiology, v. 174, n. 2, p. 293-298, 2014.
- PAES, N. A. Avaliação da cobertura dos registros de óbitos dos estados brasileiros em 2000. Revista de Saúde Pública, v. 39, n. 6, p. 882-890, 2005.
- PAES, N. A. Qualidade das estatísticas de óbitos por causas desconhecidas dos Estados brasileiros. Revista de Saúde Pública, v. 41, n. 3, p. 436-445, 2007.
- POLLARD, J. H. Some methodological issues in the measurement of sex mortality patterns. In: LOPEZ, A. D.; RUZICKA, L. T. Sex differentials in mortality: trends, determinants and consequences. Canberra, Australia: Australian National University, 1983 (Department of Demography Miscellaneous Series, 4).
- PRATA, P. R. A transição epidemiológica no Brasil. Cadernos de Saúde Pública, v. 8, n. 2, p. 168-175, 1992.
- QUEIROZ, B. L. et al. Completeness of death-count coverage and adult mortality (45q15) for Brazilian states from 1980 to 2010. Revista Brasileira de Epidemiologia, v. 20, supl. 1, p. 21-33, 2017.
- RASELLA, D. et al. Impact of primary health care on mortality from heart and cerebrovascular diseases in Brazil: a nationwide analysis of longitudinal data. BMJ, n. 349, 2014.
- SÁNCHEZ, H.; PRESTON, S. A new method for attributing changes in life expectancy to various causes of death, with application to the United States. Philadelphia, PA: University of Pennsylvania (PSC Working Paper Series, 5).
- SCHRAMM, J. M. et al. Transição epidemiológica e o estudo de carga de doença no Brasil. Ciência & Saúde Coletiva, v. 9, n. 4, p. 897-908, 2004.
- SOUZA, M. F. M. de et al. Epidemiologia das doenças do aparelho circulatório no Brasil: uma análise da tendência da mortalidade. Revista da Sociedade de Cardiologia do Estado de São Paulo, v. 16, n. 1, p. 48-62, 2006.
- SOUZA, M. F. M. de et al. Análise de séries temporais da mortalidade por doenças isquêmicas do coração e cerebrovasculares, nas cinco regiões do Brasil, no período de 1981 a 2001. Arquivos Brasileiros de Cardiologia, v. 87, n. 6, p. 735-40, 2006.
- TIMAEUS, I. M. Measurement of adult mortality in less developed countries: a comparative review. Population Index, n. 57, p. 552-568, 1991.
- VAUPEL, J. W. et al. Decomposing demographic change into direct vs. compositional components. Demographic Research, v. 7, n. 1, p. 1-14, 2002.
- VAUPEL, J. W.; ROMO, V. C. Decomposing change in life expectancy: A bouquet of formulas in honor of Nathan Keyfitz’s 90th birthday. Demography, v. 40, n. 2, p. 201-216, 2003.
Publication Dates
-
Publication in this collection
2018
History
-
Received
05 Dec 2017 -
Accepted
12 June 2018