
Abstract
Aim:To evaluate and compare household food security situations in the rural area of a Brazilian city by three different methods: Availability of food energy at home, nutritional status and Perception of food insecurity. Methods: Cross-sectional study of 79 families living in 19 rural communities in a small city in Minas Gerais, Brazil, including a total of 272 residents. Families were selected by drawing lots, respecting the proportionality of families per community. The inclusion criteria included living in rural areas, inhabiting a selected household, and using food products available for consumption, by purchase and production. During family visits, nutritional status was analyzed by anthropometry, the perception of food insecurity by Food Insecurity Scale (EBIA) and availability of food energy at household for 30 days. Results: Of the 79 families of family farmers, 12.7% were considered to be unsafe for availability of food energy at household, 24.0% due to the presence of low weight at the household and 49.5% by EBIA. There was a low correlation among the methods, with differences between them (Kendall W 0.162 p <0.001). Food insecurity was associated to the presence of at least one individual aged less than 18 years old in the household. Food security classified according to EBIA was associated with an increase in the number of people living in the household, the production of vegetables and fruits. Conclusions: No single indicator can cover several dimensions of food security. Food Security involves a broad and multifaceted approach; therefore, its thorough evaluation requires different classification methods.
Key words
Food security; Food availability; Family farming; Anthropometry; Perception of food insecurity
Resumo
O objetivo do artigo é avaliar e comparar a situação de segurança alimentar domiciliar por três diferentes métodos, em área rural de uma cidade brasileira: disponibilidade de energia alimentar em casa; estado nutricional; e percepção de insegurança alimentar. Trata-se de estudo transversal realizado com 79 famílias residentes em 19 comunidades rurais de um município de Minas Gerais, totalizando 272 moradores. Durante as visitas familiares, o estado nutricional foi analisado por antropometria, a percepção de insegurança alimentar pela Escala de Insegurança Alimentar (Ebia) e a disponibilidade de energia alimentar no domicílio por 30 dias. Os resultados mostraram que, das 79 famílias de agricultores familiares, 12,7% foram consideradas inseguras para a disponibilidade de energia alimentar, 24,0% devido à presença de baixo peso em casa e 49,5% por Ebia. Houve baixa correlação entre os métodos, com diferenças entre eles (Kendall W 0,162 p <0,001). A insegurança alimentar esteve associada à presença de pelo menos um indivíduo com idade inferior a 18 anos no domicílio. A segurança alimentar classificada de acordo com a Ebia foi associada a um aumento no número de pessoas que vivem no domicílio, na produção de vegetais e frutas. Concluiu-se que nenhum indicador isolado pode cobrir várias dimensões da segurança alimentar, a qual envolve uma abordagem ampla e multifacetada; portanto, sua avaliação completa requer diferentes métodos de classificação.
Palavras-chave
Segurança alimentar e nutricional; Disponibilidade de alimentos; Agricultura familiar; Antropometria; Percepção da insegurança alimentar
Resumen
Objetivo: evaluar y comparar la situación de seguridad alimentaria domiciliaria en el área rural de una ciudad brasileña mediante tres métodos diferentes: disponibilidad de energía alimentaria en el domicilio, estado nutricional y percepción de inseguridad alimentaria. Métodos: estudio transversal realizado con 79 familias residentes en 19 comunidades rurales de un municipio de Minas Gerais, que abarca un total de 272 habitantes. Las familias fueron seleccionadas por sorteo y se respetó la proporcionalidad por comunidad. Los criterios de inclusión fueron residir en áreas rurales, vivir en un domicilio seleccionado y usar alimentos disponibles para el consumo. Durante las visitas familiares, el estado nutricional fue analizado por antropometría, la inseguridad alimentaria percibida por la escala de inseguridad alimentaria (EBIA) y la disponibilidad de energía alimentaria en casa por treinta días. Resultados: de las 79 familias de agricultores familiares, el 12,7% se consideró con inseguridad de disponibilidad de energía alimentaria, del cual el 24% tenía presencia de bajo peso en el domicilio y el 49,5% en EBIA. Hubo una baja correlación entre los métodos, con diferencias entre ellos (Kendall W 0,162 p <0,001). La inseguridad alimentaria estuvo asociada a la presencia de por lo menos un individuo con menos de 18 años en casa. La seguridad alimentaria clasificada de acuerdo con EBIA estaba asociada a un aumento en el número de personas que vivían en casa, en la producción de hortalizas y frutas. Conclusiones: ningún indicador aislado puede cubrir varias dimensiones de la seguridad alimentaria. La seguridad alimentaria implica un enfoque amplio y multifacético, por lo que su evaluación completa requiere diferentes métodos de clasificación.
Palabras clave
Seguridad alimentaria y nutricional; Disponibilidad de alimentos; Agricultura familiar; Antropometría; Percepción de la inseguridad alimentaria
Introduction
The concept of food security (FS) is broad and involves food production, trade, consumption, which encompasses the use of food by the metabolism, and its relation to health (SEGALL-CORRÊA, 2007SEGALL-CORRÊA, A. M. Insegurança alimentar medida a partir da percepção das pessoas. Estudos Avançados, v. 21, n. 60, p. 143-154, 2007. Available in: <http://www.scielo.br/pdf/ea/v21n60/a12v2160.pdf>. Access in: 30 jan. 2018.). The term FS was coined in 1974 at the World Food Conference, promoted by the United Nations Food and Agriculture Organization (FAO). In the 1980s, the rate of the population’s access to food products was emphasized. In the 1990s, other variables including sanitary, biological, cultural, and sustainability-related aspects were incorporated into the FS concept. In 1996, FAO developed a wider concept including accessibility of all individuals to food products at all times, with sufficient amount and quality, to ensure a healthy and active life (BATISTA FILHO, 2003BATISTA FILHO, M. Da fome à segurança alimentar: retrospecto e visão prospectiva. Cadernos de Saúde Pública, v. 19, n. 4, p. 872-873, 2003. Available in: <https://www.scielosp.org/article/ssm/content/raw/?resource_ssm_path=/media/assets/csp/v19n4/16838.pdf>. Access in: 30 jan. 2018.). In Brazil, Law n. 11346/2006 involved a broader scope and defined Food and Nutritional Security “on the basis of health-promoting food practices that respect cultural diversity and are socially, economically and environmentally sustainable” (BRASIL, 2006BRASIL. Lei n. 11 346, de 15 de setembro de 2006. Cria o Sistema Nacional de Segurança Alimentar e Nutricional – SISAN, Brasília, 2006.).
The construction of the concept of food security became more complex, as it came to include more dimensions: production, availability, marketing, access and consumption of healthy food (PEDRAZA; SALES, 2014PEDRAZA, D. F.; SALES, M. C. (In)segurança alimentar e nutricional: desenvolvimento de um indicador do problema e experimentação em famílias da Paraíba, Brasil. Interações, v. 15, n. 1, p. 79-88, 2014. Available in: <http://www.scielo.br/scielo.php?script=sci_arttext&pid=S1414-462X2014000200205&lng=pt&tlng=pt>.). Thus, it is believed that the Brazilian definition is the most complete one currently, and the one used in this article.
Food Security involves a broad and multifaceted approach; therefore, its thorough evaluation requires different classification methods. The use of a system with multiple indicators that allows the evaluation of different aspects of FS is advantageous; these indicators may be evaluated together to determine the causes of hunger and, consequently, provide broader guidelines for planning and execution of public policies (SMITH, 2002SMITH, L. C. The use of household expenditure surveys for the assessment of food insecurity. In: FAO. Measurement and assessment of food deprivation and undernutrition. Rome: Food and Agriculture Organization of the United Nations, 2002.; PROENÇA, 2010PROENÇA, R. P. da C. Da pesquisa sobre segurança alimentar e nutricional no Brasil ao desafio de criação de comitês de alimentação e nutrição. Ciência & Saúde Coletiva, v. 15, n. 1, p. 24-26, jan. 2010. Available in: <http://www.scielo.br/scielo.php?script=sci_arttext&pid=S1413-81232010000100005&lng=pt&tlng=pt>. Access in: 30 jan. 2018.).
In 2002, the International Scientific Symposium on Measurement and Assessment of Food Deprivation and Undernutrition, held in Rome by the FAO, presented five of the most commonly used methods for evaluating the level of FS: 1) the FAO’s method, used for measurement of the per capita food availability in each country; 2) Household Budgets, used for the evaluation of the household’s access to food; 3) Individual Food Ingestion, used for the evaluation of individual access to food; 4) Anthropometry, used for the determination of the use of food products by assessing the individual nutritional status (>NS); and 5) Perception of Food Insecurity and Hunger, used for the evaluation of the stability of access to food or vulnerability to food insecurity (FI) (SMITH, 2002SMITH, L. C. The use of household expenditure surveys for the assessment of food insecurity. In: FAO. Measurement and assessment of food deprivation and undernutrition. Rome: Food and Agriculture Organization of the United Nations, 2002.).
Despite the efforts, it is not yet possible to rely on methods which allow to evaluate the phenomenon in all its extension (PEDRAZA; SALES, 2014PEDRAZA, D. F.; SALES, M. C. (In)segurança alimentar e nutricional: desenvolvimento de um indicador do problema e experimentação em famílias da Paraíba, Brasil. Interações, v. 15, n. 1, p. 79-88, 2014. Available in: <http://www.scielo.br/scielo.php?script=sci_arttext&pid=S1414-462X2014000200205&lng=pt&tlng=pt>.). Therefore, the goal of this study was to evaluate the household food security situation by three different methods and compare them, in the rural area of a city located in Minas Gerais, Brazil. It should be emphasized that data of this research come from a primary research, considering real situations of diagnosis of populations, with application of multiple methods.
Methods
This study was developed between June and October of 2012 in a city located in the rural areas of Minas Gerais, Brazil. In 2010, the city had 6,760 inhabitants, 44.6% of whom lived in rural areas (IBGE, 2010aIBGE – Instituto Brasileiro de Geografia e Estatística. Censo Demográfico 2010. Rio de Janeiro, 2010a). The Technical Assistance and Rural Extension Company has divided the rural areas of the city into 19 communities, in four extensive geographic areas. The primary local agricultural activity is coffee production (CASTRO; SOARES, 2008CASTRO, J. F. M.; SOARES, T. L. Análise das potencialidades socioeconômicas da zona da mata de Minas Gerais (1991-2000): uma proposta metodológica. In: I ENCONTRO DE PESQUISADORES DA HISTÓRIA DA ZONA DA MATA MINEIRA. Anais... Rio Pomba: Ifet, 2010. v. 1, p. 1-17.).
The study sample was calculated by considering a 25.5% FI prevalence in Minas Gerais by the Brazilian Food Insecurity Score (EBIA) classification, based on results of the National Household Sample Survey (PNAD) (IBGE, 2010bIBGE – Instituto Brasileiro de Geografia e Estatística. Pesquisa Nacional por Amostra de Domícilios – Segurança alimentar 2004/2009. Rio de Janeiro, 2010b.). The adoption of a maximum error of ± 5% resulted in a sample size of 547 individuals in the city, 244 of whom lived in rural areas (44.58%). Considering an average number of individuals per household of four, based on a study conducted in the same city (DUTRA et al., 2014DUTRA, L. V.; SOUZA, L. M.; SANTOS, R. H. S.; PRIORE, S. E. Disponibilidade alimentar para famílias residentes na zona rural: situação de segurança ou insegurança alimentar e nutricional. Segurança Alimentar e Nutricional, v. 21, n. 1, p. 320-329, 2014.), this sample size corresponded to 61 households and totalized 79 households after including a 10% surplus to account for sample losses and 20% surplus to account for confounding factors. The EPI-INFO software version 6.04 was used for the calculations. Families were selected by drawing lots, respecting the proportionality of families per community. Inclusion criteria involved living in rural areas, inhabiting a selected household, and using food products available for consumption, through purchase and production.
The study involved household visits, during which residents were interviewed regarding a questionnaire, and collection of anthropometric data. Other locations were visited in the neighborhood, to locate all individuals living in the same household, including schools, hospitals, stores, and farms. After evaluation, all families were visited again for the delivery of anthropometric and food consumption data, providing nutritional guidelines. The research was approved by the Human Research Ethics Committee of the Federal University of Viçosa under Protocol n. 196/2011, and all participants signed a free and informed consent form. Where there were children, consent was obtained from the person responsible for them.
In March 2012, a pilot test was conducted with ten households from the same municipality to test the validity and reproducibility of the questionnaires. These participants were not included in the main study and the questionnaires were not changed.
Socioeconomic evaluation
The sociodemographic factors evaluated were sex, age, education (years), and occupation. Variables related to lifestyle were investigated according to the methodology of the 1996–1997 Research on Lifestyle (IBGE, 2000IBGE – Instituto Brasileiro de Geografia e Estatística. Pesquisa sobre Padrões de Vida. Rio de Janeiro, 2000.). Available per capita family income was the total family income combined with the estimated value of production of food for self-consumption (converted into monetary values adopted in the local market), minus rent or house mortgage when present (TAKAGI; SILVA; GROSSI, 2001). The head of the family was identified as the person of reference, acknowledged as such by the other residents, who had the authority and responsibility for the family business, and who, in most cases, was the main provider of sustenance (IBGE, 2010b).
Evaluation of food security
Availability of food energy in the household – methodology proposed by the FAO
The method calculates the total calories available in each household for individual daily consumption and subtracts the caloric requirements of all family members. This method determines whether the caloric availability meets the needs of each family (SMITH, 2002SMITH, L. C. The use of household expenditure surveys for the assessment of food insecurity. In: FAO. Measurement and assessment of food deprivation and undernutrition. Rome: Food and Agriculture Organization of the United Nations, 2002.).
The amount of total calories available in the household for individual daily consumption was calculated by using data (kg or L) on food purchasing and production in a 30-day period before the interview. These values were converted into calories, divided by the number of household members and the number of days (30). The amount of each macronutrient available for individual daily consumption was expressed as the percentage of calories that each macronutrient represented in the total calories (SMITH, 2002SMITH, L. C. The use of household expenditure surveys for the assessment of food insecurity. In: FAO. Measurement and assessment of food deprivation and undernutrition. Rome: Food and Agriculture Organization of the United Nations, 2002.; BARBOSA et al., 2007BARBOSA, K. B. F.; ROSADO, L. E. F. P. D. L.; FRANCESCHINI, S. D. C. C.; PRIORE, S. E. Instrumentos de inquérito dietético utilizados na avaliação do consumo alimentar em adolescentes: comparação entre métodos. Archivos Latinoamericanos de Nutricion, v. 57, n. 1, p. 2-4, 2007.).
To calculate individual energy requirements to our sample, the FAO/WHO formula (1985) was changed to the Estimated Energy Requirement (EER) formula recommended by the Institute of Medicine, which uses weight, height, and level of physical activity as variables (TRUMBO et al., 2002TRUMBO, P.; SCHLICKER, S.; YATES, A. A.; POOS, M. Dietary reference intakes for energy, carbohydrate, fiber, fat, fatty acids, cholesterol, protein and amino acids. Journal of the American Dietetic Association, v. 102, n. 11, p. 1621-1630, 2002.). The level of physical activity was identified during the interviews considering activities for adults carried out in rural areas and school activities for children (BICALHO et al., 2010BICALHO, P. G.; HALLAL, P. C.; GAZZINELLI, A.; KNUTH, A. G.; VELÁSQUEZ-MELÉNDEZ, G. Atividade física e fatores associados em adultos de área rural em Minas Gerais, Brasil. Revista de Saúde Pública, v. 44, n. 5, p. 884-893, 2010.). The household was classified into the FI status in cases in which the sum of available calories was lower than the caloric requirements.
Nutritional status
The nutritional status (NS) was classified using the body mass index (BMI) after the measurement of weight and height of each participant. The weight was obtained by using a digital electronic scale with a 150kg capacity, subdivided into 50 grams. The height/length ratio was measured with a vertical anthropometer with a 2.13m wooden rule and metallic base, divided into centimeters and subdivided into millimeters. The height of individuals aged less than 2 years was measured on a firm surface after the participant was placed horizontally and centralized on the anthropometer. The techniques used for obtaining measurements and classification parameters were those adopted by the Brazilian Food and Nutritional Surveillance System, which follows the World Health Organization (WHO) guidelines and the Lipschitz (1994LIPSCHITZ, D. A. Screening for the nutritional status in the elderly. Primary Care, v. 21, n. 1, p. 55-67, 1994.; BRASIL, 2011BRASIL. Ministério da Saúde. Protocolos do Sistema de Vigilância Alimentar e Nutricional – SISVAN na assistência à saúde. Brasília, 2008.).
Weight, height, sex, and age of children and adolescents were recorded and analyzed using the WHO Anthro and WHO AnthroPlus software version 3.3.2. Data on adults, and older adults were analyzed by using the Diet Pro software version 5.1. At least one family member needed to be considered overweight to classify the household into the FI category on the basis of nutritional status.
Perception of food insecurity
The categorization of families according to perception of FI was performed using the EBIA, validated for Brazil in 2004. The validation procedure was performed by including the following variables in the questionnaire applied to the rural population (PÉREZ-ESCAMILLA et al., 2004PÉREZ-ESCAMILLA, R.; SEGALL-CORRÊA, A. M.; KURDIAN MARANHA, L.; SAMPAIO M. D. F. A.; MARÍN-LEÓN, L.; PANIGASSI, G. An adapted version of the U.S. Department of Agriculture Food Insecurity module is a valid tool for assessing household food insecurity in Campinas, Brazil. The Journal of Nutrition, v. 134, n. 8, p. 1923-1928, 2004.; SEGALL-CORRÊA et al., 2004SEGALL-CORRÊA, A. M.; ESCAMILLA, R. P.; SAMPAIO, M. de F. A.; MARIN-LEON, L.; PANIGASSI, G.; MARANHA, L. K.; BERGAMASCO, S. Acompanhamento e avaliação da segurança alimentar de famílias brasileiras: validação de metodologia e de instrumento de coleta de informação. Urbano/Rural. Campinas: Universidade Estadual de Campinas (Unicamp), 2004.).
The EBIA presents severity scores in ascending order of problems ranging from food scarcity in the household to need of quantitative food restriction. Households were classified as having FS status when all answers were negative, and into low, moderate, or severe FI status when five, nine, and fourteen answers were positive, respectively, in households with individual(s) aged less than 18 years, and when three, six, and eight were positive, respectively, in households without individual(s) aged less than 18 years (PÉREZ-ESCAMILLA et al., 2004; IBGE, 2010b).
Statistical analysis
The database was twice input into Microsoft Excel, and the validate command of the Epi Info 6.04v software was used for data verification. Data analysis was conducted by using the software Statistical Package for Social Sciences version 17.0 and Stata version 9.1. The Kolmogorov-Smirnov normality test was used to evaluate the distribution of variables. An analysis of the consistency of each of the three methods was conducted using the Kendall coefficient of concordance, and an analysis of consistency between the two methods was conducted using the Kappa coefficient.
The association between EBIA, socioeconomic, demographic, and production conditions, as well as the nutritional status of the family head was determined by multiple linear regression analysis using a hierarchical latent variable model to evaluate the impact of explanatory variables on the EBIA. All variables with p values smaller than 0.20 in the bivariate analysis were selected for inclusion in the regression analysis. The adopted statistical significance level was p<5 percent.
Results
The study was comprised of 272 inhabitants of 79 rural households. The prevalence of men was 52.6%, and the prevalence of married individuals was 54.8 %. The most common age was between 20 and 60 years old (48.9%), and the median education was 4 (0-15) years. All households belonged to the B class, as per the Brazilian Institute of Geography and Statistics (IBGE) economic criteria, households with intermediate conditions of habitation and services.
The FI status of this population differed according to the used method: a) 12.7% considering caloric availability in the household (FAO); b) 24.0% considering the presence of underweight individuals in the household (NS); and c) 49.5% by the EBIA. The consistency analysis revealed that the Kendall concordance coefficient (W) was 0.162 (p<0.0001), indicating low concordance among the methods. The Kappa index indicated low concordance between each of the three methods with k=0.003 for EBIA vs. FAO, k=0.006 for EBIA vs. NS, and k=0.038 for FAO vs. NS (p>0.05).
Of the 272 individuals, 9.9% were underweight, 61.8% were eutrophic, 19.8% were overweight, and 8.5% were obese; women accounted for most of the overweight cases (18.0%). No cases of obesity were reported in individuals younger than 10 years old and older than 60 of both sexes, and in male adolescents. Eutrophy was higher in women only during adolescence (Table 1). The stratified classification of the FI status by the EBIA indicated low, moderate, and severe FI in 43.0%, 5.1%, and 1.3% of cases, respectively.
Método de diferenças em diferenças antes e depois de 2005 para a média de homicídios por setor censitário com e sem o Programa Fica Vivo! – Belo Horizonte
State of Minas Gerais – 2012
Figure 1 presents the results of individual anthropometric evaluations after the classification of the FI status by the EBIA, by household. In order to evaluate the SAN and its various aspects within the households, it was decided to group data of nutritional status of residents and compare them with the classification of EBIA indicated by the resident’s answer to the reference. The highest prevalence of underweight was found in the low insecurity category (13.5%), but no underweight cases were observed in the moderate and high insecurity categories. The increased prevalence of overweight in all categories, up to 32.7% in the FS group, and the high prevalence of eutrophy (82.5%) in the moderate and severe insecurity classes were evident.
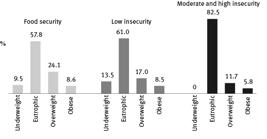
Prevalence of underweight, eutrophy, overweight and obesity in the population evaluated, second food security situation by EBIA in households in the rural area
State of Minas Gerais – 2012
The comparison between FI prevalence in households with and without the presence of individual(s) aged less than 18, indicated the evaluation of FI using the FAO and EBIA was associated with the presence of at least one individual aged less than 18 years old in the household (34.2% and 11.4%, respectively) (Figure 2 ).
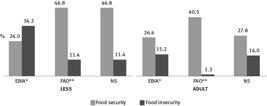
Prevalence of food insecurity in with and without the presence of individual(s) aged less than 18 years according to the method: Brazilian Food Insecurity Score (EBIA), availability of food energy in the household (FAO), status nutritional (NS)
State of Minas Gerais – 2012
Table 2 presents results of the linear regression analysis for the outcomes classified according to the EBIA. The increased number of individuals living in the household, the production of vegetables and fruits, lower per capita income, standard of living scores, and production of meat for individual consumption were associated with higher EBIA.
Simple linear regression coefficients and respective confidence intervals of socioeconomic and demographic conditions, production and nutritional status of the head of the household with EBIA score
State of Minas Gerais – 2012
The variables with p values lower than 0.20 in the linear regression analysis were included in the multiple regression model. The results of multiple linear regression analysis revealed that lower per capita income (β = –0.002; p<0.01) and lower meat production for individual consumption (β = –1.24; p>0.01) explained the occurrence of higher EBIA.
Discussion
The three methods of assessing food security presented distinct, non-concordant values, which allow for the assessment of food security from different perspectives. From a conceptual point of view, not finding a relationship between the methods, it demonstrates the ability of each to measure a SAN verifier, availability / access, use and perception in the same family and shows the need for complementarity of methods for multifaceted analysis.
The surveys conducted in Brazil also found different values for the FI status, depending on the method used. The Food Balance Sheet compiled by the FAO in 2013 found 3,263 kcal per capita per day, which is higher than the 2,300 kcal per day value recommended for Brazilians (FAO, 2000FAO. Nutrition Country Profile – Brazil. Rome, 2000. Available in: <https://pt.scribd.com/document/265858450/FAO-Nutrition-Country-Profile-Brazil-2000>. Access in: 30 jan. 2018.
https://pt.scribd.com/document/265858450...
, 2013FAO. Food Balance Sheets 2013. FAOSTAT. Available in: <http://www.fao.org/faostat/en/#data/FBS>. Access in: 31 jan. 2018.
http://www.fao.org/faostat/en/#data/FBS>...
). The 2008-2009 Household Budget Research (POF) evaluated calorie availability of the Brazilian population and found a value of 1,611 kcal per day per capita. Per capita calorie intake was lower than the recommended amount (IBGE, 2010c). This study revealed that 12.7% of the households did not meet the daily calorie requirements.
Data from household availability, as raised for this paper, occupy an intermediate position between food balance sheets, which describe national food availability, and surveys to assess individual consumption (SICHIERI; CASTRO; MOURA, 2003SICHIERI, R.; CASTRO, J. F. G.; MOURA, A. S. Factors associated with dietary patterns in the urban Brazilian population. Cadernos de Saúde Pública, v. 19, n. 1, p. 47-53, 2003.; LEVY et al., 2005LEVY, R. B.; SICHIERI, R.; PONTES, N. dos S.; MONTEIRO, C. A. Disponibilidade domiciliar de alimentos no Brasil: distribuição e evolução (1974-2003). Revista de Saúde Pública, v. 39, n. 4, p. 530-540, 2005.). In a recent review of the literature on food insecurity and food security in Europe from 1975 to 2013, the authors state there is little knowledge about this subject and that research is limited and focusing on food production rather than people’s access to food (BORCH; KJÆRNES, 2016BORCH, A.; KJÆRNES, U. Food security and food insecurity in Europe: an analysis of the academic discourse (1975-2013). Appetite, v. 103, p. 137-147, 2016.). These types of data, therefore, provide information about access to food available to the individual and, thus, allow for the classification of the household’s food security situation (CORDEIRO, 2003CORDEIRO, A. de A. Padrão alimentar e consumo domiciliar de produtos com redução de gorduras na área metropolitana de São Paulo. 2003. 117 f. Tese (Doutorado) – Universidade de São Paulo, São Paulo, 2003.; LEVY et al., 2012LEVY, R. B.; CLARO, R. M.; BANDONI, D. H.; MONDINI, L.; MONTEIRO, C. A. Disponibilidade de “açúcares de adição” no Brasil: distribuição, fontes alimentares e tendência temporal. Revista Brasileira de Epidemiologia, v. 15, n. 1, p. 3-12, 2012.).
When analyzing the anthropometric data, although 24.0% of the households evaluated had underweight individuals, these represented only 5.9% of the evaluated population. The analysis of anthropometric data from the 2008-2009 POF revealed that the underweight rate was lower than 5% in all age groups, which is considered low according to the FAO’s classification (IBGE, 2010dIBGE – Instituto Brasileiro de Geografia e Estatística. Pesquisa de Orçamentos Familiares 2008-2009 – Antropometria e estado nutricional de crianças, adolescentes e adultos no Brasil. Rio de Janeiro, 2010d.). And the FAO’s report of 2014 indicated that Brazil has left the hunger map (FAO; IFAD; WFP, 2014FAO, IFAD; WFP. The state of food insecurity in the world. Strengthening the enabling environment for food security and nutrition.Rome, 2014.).
On the other hand, in the present study, 28.3% of the population was overweight and obese, most of them women (63.6%). Although high, this prevalence is lower than that found in the 2008-2009 POF, in which excess weight affected 56% of the Brazilian rural adult population, 64.5% of whom were women (IBGE, 2010d). The Brazilian authors reported that activities of women in rural areas were traditionally directed to the cultivation of vegetables and domestic services in houses with few rooms. These living conditions limit the space available for homemakers to perform physical activities. Therefore, the sedentary lifestyle of women living in rural areas may increase the risk of obesity in this group (MARINHO et al., 2003MARINHO, S. P.; MARTINS, I. S.; PERESTRELO, J. P. P.; DE OLIVEIRA, D. C. Obesidade em adultos de segmentos pauperizados da sociedade. Revista de Nutrição, v. 16, n. 2, p. 195-201, 2003.).
Food insecurity in the family is correlated with poverty, which has been linked to undernourishment. However, considering the process of nutritional transition, there may be a connection with overweight. The increase in obesity rates and the need to eradicate FI requires a thorough understanding of the relation between these two apparently contradictory conditions for the development of effective public policies. The relation between food insecurity and obesity suggests the need to investigate potential behavioral and physiological mechanisms in this relationship (TANUMIHARDJO et al., 2007; KURSMARK; WEITZMAN, 2009; HERNANDEZ; REESOR; MURILLO, 2017).
Socioeconomic status affects excess weight because it is correlated with food availability and access to information, and consequently, to food security. Studies have revealed that obesity is frequent among lower-income and lower-education populations, including rural ones (MCLAREN, 2007MCLAREN, L. Socioeconomic status and obesity. Epidemiologic Reviews, v. 29, n. 1, p. 29-48, 2007.; MORAIS et al., 2014MORAIS, D. de C.; DUTRA, L. V.; FRANCESCHINI, S. do C. C.; PRIORE, S. E. Insegurança alimentar e indicadores antropométricos, dietéticos e sociais em estudos brasileiros: uma revisão sistemática. Ciência & Saúde Coletiva, v. 19, n. 5, p. 1475-1488, 2014. Available in: <http://www.scielo.br/scielo.php?script=sci_arttext&pid=S1413-81232014000501475&lng=pt&tlng=pt>.). Then, anthropometric data is necessary to identify one of the strands of food security.
It is also worth mentioning that one of the causes of the obesity epidemic is the replacement of in natura foods with ultra-processed foods, as these tend to be less expensive than fresh foods (CLARO et al., 2016CLARO, R. M.; MAIA, E. G.; COSTA, B. V. de L.; DINIZ, D. P. Preço dos alimentos no Brasil: prefira preparações culinárias a alimentos ultraprocessados. Cadernos de Saúde Pública, v. 32, n. 8, p. 1-13, 2016. Disponível em: <http://www.scielo.br/scielo.php?script=sci_arttext&pid=S0102-311X2016000805006&lng=pt&tlng=pt>.). A cross-sectional study carried out in Brazil shows that the greater domestic availability of ultra-processed food products is positively associated with a higher prevalence of overweight in all age groups (CANELLA et al., 2014CANELLA, D. S.; LEVY, R. B.; MARTINS, A. P. B.; CLARO, R. M.; MOUBARAC, J. C.; BARALDI, L. G.; CANNON, G.; MONTEIRO, C. A. Ultra-processed food products and obesity in Brazilian households (2008-2009). PLoS ONE, v. 9, n. 3, p. 1-6, 2014.).
In Brazil, the Brazilian Food Insecurity Scale (EBIA) is a validated method and recognized as a sensitive indicator to detect families at risk of food insecurity (IBGE, 2006IBGE – Instituto Brasileiro de Geografia e Estatística. Pesquisa Nacional por Amostra de Domicílios (PNAD) – Segurança alimentar 2004. Rio de Janeiro, 2006.; FÁVARO et al., 2007FÁVARO, T.; RIBAS, D. L. B.; ZORZATTO, J. R.; SEGALL-CORRÊA, A. M.; PANIGASSI, G. Food security in indigenous families Teréna, Mato Grosso do Sul, Brazil. Cadernos de Saúde Pública, v. 23, n. 4, p. 785-793, 2007.). And the most recent Brazilian survey with perception scale revealed that the number of Brazilian households with some degree of FI per EBIA classification was 22.6%, is lower than the value found herein (49.5%) (IBGE, 2014IBGE – Instituto Brasileiro de Geografia e Estatística. Pesquisa Nacional por Amostra de Domicílios (PNAD) – Segurança alimentar 2013. Rio de Janeiro, 2014. v. 39.). The prevalence of food insecurity in studies conducted in India and the United States with rural households using perceptual scores was similar to that of this study, with 40% of Indian households and 51% of households in the state of North Carolina (BAUER et al., 2012BAUER, K. W.; WIDOME, R.; HIMES, J. H.; SMYTH, M.; ROCK, B. H.; HANNAN, P. J.; STORY, M. High food insecurity and its correlates among families living on a rural American Indian reservation. American Journal of Public Health, v. 102, n. 7, p. 1346-1352, 2012.; IP et al., 2015IP, E. H.; SALDANA, S.; ARCURY, T. A.; GRZYWACZ, J. G.; TREJO, G.; QUANDT, S. A. Profiles of food security for US farmworker households and factors related to dynamic of change. American Journal of Public Health, v. 105, n. 10, p. e42–e47, 2015.).
Other factors directly affecting income and, consequently, the prevalence of food insecurity are the number of residents in the household and the presence of people younger than 18 years old (FRAGA et al., 2007FRAGA, D. da S.; CAMARGO, M.; VITOLO, M. R.; SANTOS, R. P. M. dos. Relação entre insegurança alimentar e perfil socioeconômico das famílias residentes em uma área de risco de Porto Alegre. Boletim da Saúde, v. 21, n. 1, jan./jun. 2007.; HOFFMANN, 2008HOFFMANN, R. Determinantes da insegurança alimentar no Brasil: análise dos dados da PNAD de 2004. Segurança Alimentar e Nutricional, v. 15, n. 1, p. 49-61, 2008.). Studies carried out in Brazilian households showed that family size was associated with perceived food security and the prevalence of unsafe conditions increased with increasing family size (SOUZA et al., 2012SOUZA, N. N. de; DIAS, M. de M.; SPERANDIO, N.; FRANCESCHINI, S. do C. C.; PRIORE, S. E. Perfil socioeconômico e insegurança alimentar e nutricional de famílias beneficiárias do Programa Bolsa Família no município de Viçosa, Estado de Minas Gerais, Brasil, em 2011: um estudo epidemiológico transversal. Epidemiologia e Serviços de Saúde, v. 21, n. 4, p. 655-662, dez. 2012. Available in: <http://scielo.iec.pa.gov.br/scielo.php?script=sci_arttext&pid=S1679-49742012000400015&lng=en&nrm=iso&tlng=en>. Access in: 29 jan. 2018.; FERREIRA et al., 2014).
In this study, the highest prevalence of underweight was found among adolescents living in households with severe FI (7.3%). Moreover, the rate of overweight was higher in adults living in households with low FI (49.1%) statuses. The Brazilian authors evaluated the prevalence of FI and the nutritional status of adolescents and adults in two Brazilian cities, and found that the prevalence in this population was 88.0%, indicating their vulnerability to hunger; however, the prevalence of underweight was 3.9%. Moreover, the overweight rate for adolescents and adults was 25.4% and 35.7%, respectively (OLIVEIRA et al., 2009OLIVEIRA, J. S.; DE LIRA, P. I. C.; VERAS, I. C. L.; MAIA, S. R.; DE LEMOS, M. da C. C.; DE ANDRADE, S. L. L. S.; VIANA JUNIOR, M. J.; DE LIMA PINTO, F. C.; LEAL, V. S.; BATISTA FILHO, M. Estado nutricional e insegurança alimentar de adolescentes e adultos em duas localidades de baixo índice de desenvolvimento humano. Revista de Nutrição, v. 22, n. 4, p. 453-465, 2009.).
As evidenced in this study, in the 2013 PNAD and in a study conducted in Alagoas-Brazil with 1,444 families, households with children under 18 years of age presented higher prevalence of food insecurity by EBIA compared to households without children under 18 (12% and 10%, respectively) (FERREIRA et al., 2014FERREIRA, H. da S.; SOUZA, M. E. D. C. A. de; MOURA, F. A.; HORTA, B. L. Prevalência e fatores associados à insegurança alimentar e nutricional em famílias dos municípios do norte de Alagoas, Brasil, 2010. Ciência & Saúde Coletiva, v. 19, n. 5, p. 1533-1542, 2014. Available in: <https://www.scielosp.org/article/ssm/content/raw/?resource_ssm_path=/media/assets/csc/v19n5/1413-8123-csc-19-05-01533.pdf>. Access in: 29 jan. 2018.; IBGE, 2014). In addition to the uncertainty of the EBIA, there was also a difference by the FAO method. It should be considered that minors represent the biological segment most vulnerable to food insecurity and its most immediate and serious nutritional consequences (OLIVEIRA et al., 2010OLIVEIRA, J. S.; LIRA, P. I. C.; MAIA, S. R.; SEQUEIRA, L. A. D. S.; AMORIM, R. C. D. A.; BATISTA FILHO, M. Insegurança alimentar e estado nutricional de crianças de Gameleira, zona da mata do Nordeste brasileiro. Revista Brasileira de Saúde Materno Infantil, v. 10, n. 2, p. 237-245, 2010. Available in: <http://bases.bireme.br/cgi-bin/wxislind.exe/iah/online/?IsisScript=iah/iah.xis&src=google&base=LILACS&lang=p&nextAction=lnk&exprSearch=551950&indexSearch=ID%5Cnhttp://www.scielo.br/pdf/rbsmi/v10n2/a11v10n2.pdf>.).
The higher food insecurity rate among families of the lowest economic class verified in several studies (GUBERT; SANTOS, 2009GUBERT, M. B.; SANTOS, L. M. P. do. Determinantes da insegurança alimentar no Distrito Federal. Comunicação em Ciências da Saúde, v. 20, n. 2, p. 135-141, 2009. Available in: <http://pesquisa.bvsalud.org/bvsms/resource/pt/mis-24485>.) also affects the relationship between the lower production of self-consuming meat and the higher EBIA score presented in this study. According to the Pan American Health Organization (PAHO), the more economically and socially developed the family or country, the greater the access to these foods and the ingestion of noble proteins (PAHO, 2000PAHO. Obesity and poverty: a new public health challenge. Washington, D.C.: Pan American Health Organization, 2000.).
The correlation found in this study between production for self-consumption of meat and FS by EBIA reflects a possible correlation between the greater economic development of a family and access to meat. The relation between meat consumption and FS exceeds aspects related to physical and nutritional well-being when considering food purchases and includes aspects related to the right of access to resources of production and purchase of safe and healthy food products (ARRUDA; BISCONTINI; COSTA, 2001ARRUDA, S. G. B. de; BISCONTINI, T. M. B.; COSTA, R. G. Consumo de carnes vermelhas e sua relação com a política de segurança alimentar e nutricional. 2001. Available in: <www.capritec.com.br/art38.htm>.
www.capritec.com.br/art38.htm...
).
Food products represent 19.8% of the monthly budget of Brazilian families, with meat and fish presenting the highest cost and accounting for 25.2% of the family budget in rural areas. For the vast majority of the population, ingestion of meat products continues to indicate social ascension and may be the food category that best reflects socioeconomic status (IBGE, 2010cIBGE – Instituto Brasileiro de Geografia e Estatística. Pesquisa de Orçamentos Familiares 2008-2009 – Aquisição alimentar domiciliar per capita. Rio de Janeiro, 2010c.; CARVALHO et al., 2013CARVALHO, R. R.; MIRANDA, Z. B.; FONSECA, A. B. M.; MESQUITA, E. de F. M. Segurança alimentar: percepção e informações sanitárias no consumo de carnes no Estado do Rio de Janeiro, Brasil. Revista Brasileira de Medicina Veterinária, v. 35, n. 1, p. 55-62, 2013. Available in: <http://www.rbmv.com.br/pdf_artigos/02-07-2013_11-26RBMV 010.pdf>. Access in: 31 jan. 2018.).
The potential of production for self-consumption of meat, or other food, is necessary for food sovereignty and the confluence of this practice with the FS principle. In this case, the FS principle depends on the access to food products and the diversity of food products that can be produced and consumed by family units (GRISA, 2009GRISA, C. A produção para autoconsumo na agricultura familiar: uma análise a partir da teoria da sociedade de risco. Varia Scientia, v. 8, n. 14, p. 171-200, 2009.).
Considering the results analyzed, we believe, in accordance with other authors, that for a better understanding of the dynamic nature of SAN, besides understanding availability, access and biological use of food, an indicator should be included for monitoring perception, a set of social indicators (PANIGASSI et al., 2008PANIGASSI, G.; SEGALL-CORRÊA, A. M.; MARIN-LEÓN, L.; PÉREZ-ESCAMILLA, R.; MARANHA, L. K.; SAMPAIO, M. D. F. A. Insegurança alimentar intrafamiliar e perfil de consumo de alimentos. Revista de Nutrição, v. 21, supl., p. 135-144, 2008.; PEDRAZA; SALES, 2014).
Final considerations
Considering the real situations of population diagnosis, the application of multiple methods of evaluation of SAN and taking the domicile as unit of study were the main challenges of this work.
In conclusion, differences in the FI statuses found between the evaluation methods indicate that isolated indicators cannot adequately assess the multidimensional nature of FS, and further, that the measurement of this variable at the household level is a challenge due to its complexity. Therefore, the evaluated methods should not be considered contradictory but complementary with the view of assessing various aspects of this complex variable. Moreover, the inclusion of overweight in the FS status is necessary considering the nutritional status of the Brazilian population and the effect of overweight on individual health and implementation of food policies.
The articulation and combination of diagnostic strategies may contribute to a better definition of the situation of SAN in homes and, in turn contribute to direct, for example, priority of access to public programs.
Notes
-
*
This work was conducted during a scholarship supported by the Foundation for Research of the State of Minas Gerais (Fapemig). Financed by Fundação Arthur Bernardes (Funarbe), the Foundation off Support for the Federal University of Viçosa.
References
- ARRUDA, S. G. B. de; BISCONTINI, T. M. B.; COSTA, R. G. Consumo de carnes vermelhas e sua relação com a política de segurança alimentar e nutricional. 2001. Available in: <www.capritec.com.br/art38.htm>.
» www.capritec.com.br/art38.htm - BARBOSA, K. B. F.; ROSADO, L. E. F. P. D. L.; FRANCESCHINI, S. D. C. C.; PRIORE, S. E. Instrumentos de inquérito dietético utilizados na avaliação do consumo alimentar em adolescentes: comparação entre métodos. Archivos Latinoamericanos de Nutricion, v. 57, n. 1, p. 2-4, 2007.
- BATISTA FILHO, M. Da fome à segurança alimentar: retrospecto e visão prospectiva. Cadernos de Saúde Pública, v. 19, n. 4, p. 872-873, 2003. Available in: <https://www.scielosp.org/article/ssm/content/raw/?resource_ssm_path=/media/assets/csp/v19n4/16838.pdf>. Access in: 30 jan. 2018.
- BAUER, K. W.; WIDOME, R.; HIMES, J. H.; SMYTH, M.; ROCK, B. H.; HANNAN, P. J.; STORY, M. High food insecurity and its correlates among families living on a rural American Indian reservation. American Journal of Public Health, v. 102, n. 7, p. 1346-1352, 2012.
- BICALHO, P. G.; HALLAL, P. C.; GAZZINELLI, A.; KNUTH, A. G.; VELÁSQUEZ-MELÉNDEZ, G. Atividade física e fatores associados em adultos de área rural em Minas Gerais, Brasil. Revista de Saúde Pública, v. 44, n. 5, p. 884-893, 2010.
- BORCH, A.; KJÆRNES, U. Food security and food insecurity in Europe: an analysis of the academic discourse (1975-2013). Appetite, v. 103, p. 137-147, 2016.
- BRASIL. Lei n. 11 346, de 15 de setembro de 2006. Cria o Sistema Nacional de Segurança Alimentar e Nutricional – SISAN, Brasília, 2006.
- BRASIL. Ministério da Saúde. Protocolos do Sistema de Vigilância Alimentar e Nutricional – SISVAN na assistência à saúde. Brasília, 2008.
- CANELLA, D. S.; LEVY, R. B.; MARTINS, A. P. B.; CLARO, R. M.; MOUBARAC, J. C.; BARALDI, L. G.; CANNON, G.; MONTEIRO, C. A. Ultra-processed food products and obesity in Brazilian households (2008-2009). PLoS ONE, v. 9, n. 3, p. 1-6, 2014.
- CARVALHO, R. R.; MIRANDA, Z. B.; FONSECA, A. B. M.; MESQUITA, E. de F. M. Segurança alimentar: percepção e informações sanitárias no consumo de carnes no Estado do Rio de Janeiro, Brasil. Revista Brasileira de Medicina Veterinária, v. 35, n. 1, p. 55-62, 2013. Available in: <http://www.rbmv.com.br/pdf_artigos/02-07-2013_11-26RBMV 010.pdf>. Access in: 31 jan. 2018.
- CASTRO, J. F. M.; SOARES, T. L. Análise das potencialidades socioeconômicas da zona da mata de Minas Gerais (1991-2000): uma proposta metodológica. In: I ENCONTRO DE PESQUISADORES DA HISTÓRIA DA ZONA DA MATA MINEIRA. Anais... Rio Pomba: Ifet, 2010. v. 1, p. 1-17.
- CLARO, R. M.; MAIA, E. G.; COSTA, B. V. de L.; DINIZ, D. P. Preço dos alimentos no Brasil: prefira preparações culinárias a alimentos ultraprocessados. Cadernos de Saúde Pública, v. 32, n. 8, p. 1-13, 2016. Disponível em: <http://www.scielo.br/scielo.php?script=sci_arttext&pid=S0102-311X2016000805006&lng=pt&tlng=pt>.
- CORDEIRO, A. de A. Padrão alimentar e consumo domiciliar de produtos com redução de gorduras na área metropolitana de São Paulo. 2003. 117 f. Tese (Doutorado) – Universidade de São Paulo, São Paulo, 2003.
- DUTRA, L. V.; SOUZA, L. M.; SANTOS, R. H. S.; PRIORE, S. E. Disponibilidade alimentar para famílias residentes na zona rural: situação de segurança ou insegurança alimentar e nutricional. Segurança Alimentar e Nutricional, v. 21, n. 1, p. 320-329, 2014.
- FAO. Nutrition Country Profile – Brazil. Rome, 2000. Available in: <https://pt.scribd.com/document/265858450/FAO-Nutrition-Country-Profile-Brazil-2000>. Access in: 30 jan. 2018.
» https://pt.scribd.com/document/265858450/FAO-Nutrition-Country-Profile-Brazil-2000>. - FAO. Food Balance Sheets 2013. FAOSTAT. Available in: <http://www.fao.org/faostat/en/#data/FBS>. Access in: 31 jan. 2018.
» http://www.fao.org/faostat/en/#data/FBS>. - FAO, IFAD; WFP. The state of food insecurity in the world. Strengthening the enabling environment for food security and nutrition.Rome, 2014.
- FÁVARO, T.; RIBAS, D. L. B.; ZORZATTO, J. R.; SEGALL-CORRÊA, A. M.; PANIGASSI, G. Food security in indigenous families Teréna, Mato Grosso do Sul, Brazil. Cadernos de Saúde Pública, v. 23, n. 4, p. 785-793, 2007.
- FERREIRA, H. da S.; SOUZA, M. E. D. C. A. de; MOURA, F. A.; HORTA, B. L. Prevalência e fatores associados à insegurança alimentar e nutricional em famílias dos municípios do norte de Alagoas, Brasil, 2010. Ciência & Saúde Coletiva, v. 19, n. 5, p. 1533-1542, 2014. Available in: <https://www.scielosp.org/article/ssm/content/raw/?resource_ssm_path=/media/assets/csc/v19n5/1413-8123-csc-19-05-01533.pdf>. Access in: 29 jan. 2018.
- FRAGA, D. da S.; CAMARGO, M.; VITOLO, M. R.; SANTOS, R. P. M. dos. Relação entre insegurança alimentar e perfil socioeconômico das famílias residentes em uma área de risco de Porto Alegre. Boletim da Saúde, v. 21, n. 1, jan./jun. 2007.
- GRISA, C. A produção para autoconsumo na agricultura familiar: uma análise a partir da teoria da sociedade de risco. Varia Scientia, v. 8, n. 14, p. 171-200, 2009.
- GUBERT, M. B.; SANTOS, L. M. P. do. Determinantes da insegurança alimentar no Distrito Federal. Comunicação em Ciências da Saúde, v. 20, n. 2, p. 135-141, 2009. Available in: <http://pesquisa.bvsalud.org/bvsms/resource/pt/mis-24485>.
- HOFFMANN, R. Determinantes da insegurança alimentar no Brasil: análise dos dados da PNAD de 2004. Segurança Alimentar e Nutricional, v. 15, n. 1, p. 49-61, 2008.
- IBGE – Instituto Brasileiro de Geografia e Estatística. Pesquisa sobre Padrões de Vida. Rio de Janeiro, 2000.
- IBGE – Instituto Brasileiro de Geografia e Estatística. Pesquisa Nacional por Amostra de Domicílios (PNAD) – Segurança alimentar 2004. Rio de Janeiro, 2006.
- IBGE – Instituto Brasileiro de Geografia e Estatística. Censo Demográfico 2010. Rio de Janeiro, 2010a
- IBGE – Instituto Brasileiro de Geografia e Estatística. Pesquisa Nacional por Amostra de Domícilios – Segurança alimentar 2004/2009. Rio de Janeiro, 2010b.
- IBGE – Instituto Brasileiro de Geografia e Estatística. Pesquisa de Orçamentos Familiares 2008-2009 – Aquisição alimentar domiciliar per capita. Rio de Janeiro, 2010c.
- IBGE – Instituto Brasileiro de Geografia e Estatística. Pesquisa de Orçamentos Familiares 2008-2009 – Antropometria e estado nutricional de crianças, adolescentes e adultos no Brasil. Rio de Janeiro, 2010d.
- IBGE – Instituto Brasileiro de Geografia e Estatística. Pesquisa Nacional por Amostra de Domicílios (PNAD) – Segurança alimentar 2013. Rio de Janeiro, 2014. v. 39.
- IP, E. H.; SALDANA, S.; ARCURY, T. A.; GRZYWACZ, J. G.; TREJO, G.; QUANDT, S. A. Profiles of food security for US farmworker households and factors related to dynamic of change. American Journal of Public Health, v. 105, n. 10, p. e42–e47, 2015.
- LEVY, R. B.; CLARO, R. M.; BANDONI, D. H.; MONDINI, L.; MONTEIRO, C. A. Disponibilidade de “açúcares de adição” no Brasil: distribuição, fontes alimentares e tendência temporal. Revista Brasileira de Epidemiologia, v. 15, n. 1, p. 3-12, 2012.
- LEVY, R. B.; SICHIERI, R.; PONTES, N. dos S.; MONTEIRO, C. A. Disponibilidade domiciliar de alimentos no Brasil: distribuição e evolução (1974-2003). Revista de Saúde Pública, v. 39, n. 4, p. 530-540, 2005.
- LIPSCHITZ, D. A. Screening for the nutritional status in the elderly. Primary Care, v. 21, n. 1, p. 55-67, 1994.
- MARINHO, S. P.; MARTINS, I. S.; PERESTRELO, J. P. P.; DE OLIVEIRA, D. C. Obesidade em adultos de segmentos pauperizados da sociedade. Revista de Nutrição, v. 16, n. 2, p. 195-201, 2003.
- MCLAREN, L. Socioeconomic status and obesity. Epidemiologic Reviews, v. 29, n. 1, p. 29-48, 2007.
- MORAIS, D. de C.; DUTRA, L. V.; FRANCESCHINI, S. do C. C.; PRIORE, S. E. Insegurança alimentar e indicadores antropométricos, dietéticos e sociais em estudos brasileiros: uma revisão sistemática. Ciência & Saúde Coletiva, v. 19, n. 5, p. 1475-1488, 2014. Available in: <http://www.scielo.br/scielo.php?script=sci_arttext&pid=S1413-81232014000501475&lng=pt&tlng=pt>.
- OLIVEIRA, J. S.; DE LIRA, P. I. C.; VERAS, I. C. L.; MAIA, S. R.; DE LEMOS, M. da C. C.; DE ANDRADE, S. L. L. S.; VIANA JUNIOR, M. J.; DE LIMA PINTO, F. C.; LEAL, V. S.; BATISTA FILHO, M. Estado nutricional e insegurança alimentar de adolescentes e adultos em duas localidades de baixo índice de desenvolvimento humano. Revista de Nutrição, v. 22, n. 4, p. 453-465, 2009.
- OLIVEIRA, J. S.; LIRA, P. I. C.; MAIA, S. R.; SEQUEIRA, L. A. D. S.; AMORIM, R. C. D. A.; BATISTA FILHO, M. Insegurança alimentar e estado nutricional de crianças de Gameleira, zona da mata do Nordeste brasileiro. Revista Brasileira de Saúde Materno Infantil, v. 10, n. 2, p. 237-245, 2010. Available in: <http://bases.bireme.br/cgi-bin/wxislind.exe/iah/online/?IsisScript=iah/iah.xis&src=google&base=LILACS&lang=p&nextAction=lnk&exprSearch=551950&indexSearch=ID%5Cnhttp://www.scielo.br/pdf/rbsmi/v10n2/a11v10n2.pdf>.
- PAHO. Obesity and poverty: a new public health challenge. Washington, D.C.: Pan American Health Organization, 2000.
- PANIGASSI, G.; SEGALL-CORRÊA, A. M.; MARIN-LEÓN, L.; PÉREZ-ESCAMILLA, R.; MARANHA, L. K.; SAMPAIO, M. D. F. A. Insegurança alimentar intrafamiliar e perfil de consumo de alimentos. Revista de Nutrição, v. 21, supl., p. 135-144, 2008.
- PEDRAZA, D. F.; SALES, M. C. (In)segurança alimentar e nutricional: desenvolvimento de um indicador do problema e experimentação em famílias da Paraíba, Brasil. Interações, v. 15, n. 1, p. 79-88, 2014. Available in: <http://www.scielo.br/scielo.php?script=sci_arttext&pid=S1414-462X2014000200205&lng=pt&tlng=pt>.
- PÉREZ-ESCAMILLA, R.; SEGALL-CORRÊA, A. M.; KURDIAN MARANHA, L.; SAMPAIO M. D. F. A.; MARÍN-LEÓN, L.; PANIGASSI, G. An adapted version of the U.S. Department of Agriculture Food Insecurity module is a valid tool for assessing household food insecurity in Campinas, Brazil. The Journal of Nutrition, v. 134, n. 8, p. 1923-1928, 2004.
- PROENÇA, R. P. da C. Da pesquisa sobre segurança alimentar e nutricional no Brasil ao desafio de criação de comitês de alimentação e nutrição. Ciência & Saúde Coletiva, v. 15, n. 1, p. 24-26, jan. 2010. Available in: <http://www.scielo.br/scielo.php?script=sci_arttext&pid=S1413-81232010000100005&lng=pt&tlng=pt>. Access in: 30 jan. 2018.
- SEGALL-CORRÊA, A. M. Insegurança alimentar medida a partir da percepção das pessoas. Estudos Avançados, v. 21, n. 60, p. 143-154, 2007. Available in: <http://www.scielo.br/pdf/ea/v21n60/a12v2160.pdf>. Access in: 30 jan. 2018.
- SEGALL-CORRÊA, A. M.; ESCAMILLA, R. P.; SAMPAIO, M. de F. A.; MARIN-LEON, L.; PANIGASSI, G.; MARANHA, L. K.; BERGAMASCO, S. Acompanhamento e avaliação da segurança alimentar de famílias brasileiras: validação de metodologia e de instrumento de coleta de informação. Urbano/Rural. Campinas: Universidade Estadual de Campinas (Unicamp), 2004.
- SICHIERI, R.; CASTRO, J. F. G.; MOURA, A. S. Factors associated with dietary patterns in the urban Brazilian population. Cadernos de Saúde Pública, v. 19, n. 1, p. 47-53, 2003.
- SMITH, L. C. The use of household expenditure surveys for the assessment of food insecurity. In: FAO. Measurement and assessment of food deprivation and undernutrition. Rome: Food and Agriculture Organization of the United Nations, 2002.
- SOUZA, N. N. de; DIAS, M. de M.; SPERANDIO, N.; FRANCESCHINI, S. do C. C.; PRIORE, S. E. Perfil socioeconômico e insegurança alimentar e nutricional de famílias beneficiárias do Programa Bolsa Família no município de Viçosa, Estado de Minas Gerais, Brasil, em 2011: um estudo epidemiológico transversal. Epidemiologia e Serviços de Saúde, v. 21, n. 4, p. 655-662, dez. 2012. Available in: <http://scielo.iec.pa.gov.br/scielo.php?script=sci_arttext&pid=S1679-49742012000400015&lng=en&nrm=iso&tlng=en>. Access in: 29 jan. 2018.
- TRUMBO, P.; SCHLICKER, S.; YATES, A. A.; POOS, M. Dietary reference intakes for energy, carbohydrate, fiber, fat, fatty acids, cholesterol, protein and amino acids. Journal of the American Dietetic Association, v. 102, n. 11, p. 1621-1630, 2002.
Publication Dates
-
Publication in this collection
2018
History
-
Received
20 May 2018 -
Accepted
24 Oct 2018

 Source: Thesis DUTRA, L.V. Food and nutrition insecurity and self-sustainable production in rural area of São Miguel do Anta, Minas Gerais.
 Source: Thesis DUTRA, L.V. Food and nutrition insecurity and self-sustainable production in rural area of São Miguel do Anta, Minas Gerais. Note:*chi-square, p<0.05. **Fisher, p<0.05.