ABSTRACT
Variation in phytoplankton functional diversity is partioned and mapped using several indices and linkage methods based on dendrograms. The relationships between diversity metrics and major environmental predictors, including zooplankton density, were assessed in 29 phytoplankton communities of floodplain lakes distributed along the Middle Araguaia River in central Brazil. The dendrogram-based functional diversity indices were Functional Group Richness, Functional Diversity, Mean Pairwise Distance and Mean Nearest Taxon Distance, whereas seven different hierarchical agglomerative linkage methods we used. The performance of indices were compared using ANOVA and their spatial variation in response to major environmental predictors evaluated. The results indicate that variation in functional diversity values is primarily a product of the type of index chosen. This variation was statistically significant in 90 % of the floodplain lakes studied; however, a spatial pattern of variation in index values along the river was not detected. Furthermore, environmental constraints, including zooplankton density, were weak predictors of functional diversity indices. Therefore, the mathematical characteristics of indices are of primary importance in explaining variation among functional diversity values.
Keywords
Araguaia River; functional traits; linkage method; Mean Nearest Taxon Distance; Mean Pairwise Distance
Introduction
Functional diversity is an important descriptor of biological communities (Mason et al. 2005Mason NWH, Mouillot D, Lee WG, Wilson JB. 2005. Functional richness, functional evenness and functional divergence: the primary components of functional diversity. Oikos 111: 112-118.), and is able to predict ecosystem dynamics and factors affecting ecosystem structure (Petchey & Gaston 2006Petchey OL , Gaston, KJ. 2006. Functional diversity: back to basics and looking forward. Ecology Letters 9: 741-758.). Functional diversity is defined as the values or range of values for existing functional traits in a community capable of affecting ecosystem functioning, such as primary production, stability, nutrient cycles and the provision of ecosystem services (Díaz et al. 2007Díaz S, Lavorel S, Chapin FS, Tecco PA, Gurvich DE, Grigulis K. 2007. Functional diversity - at the crossroads between ecosystem functioning and environmental filters. In: Canadell JG, Pataki D, Pitelka L. (eds.) Terrestrial ecosystems in changing world. Berlin, Springer-Verlag. p. 81-91.; Tilman 2001Tilman D. 2001. Functional diversity. In: Levin SA. (ed.) Encyclopedia of Biodiversity. San Diego, Academic Press. p. 109-120.; Cardinale et al. 2012Cardinale BJ, Duffy E, Gonzalez A, et al. 2012. Biodiversity loss and the impact on humanity. Nature 486: 59-67.). Functional diversity has gained prominence in the scientific literature (Schleuter et al. 2010Schleuter D, Daufresne M, Massol F, Argillier C. 2010. A user`s guide to functional diversity indices. Ecological Monographs 80: 469-484.), which has led to the development of several indices for measuring it (e.g., Walker et al. 1999Walker BH, Kinzig A, Langridge J. 1999. Plant attribute diversity, resilience and ecosystem function: the nature and significance of dominant and minor species. Ecosystems 2: 95-113.; Petchey & Gaston 2002Petchey OL, Gaston KJ. 2002. Functional diversity (FD), species richness and community composition. Ecology Letters 5: 402-411.; Heemsbergen et al. 2004Heemsbergen DA, Berg MP, Loreal M, Hal JR, Faber JH, Verhoef HA. 2004. Biodiversity effects on soil processes explained by interspecific functional dissimilarity biodiversity. Science 306: 1019-1020.; Botta-Dukát 2005Botta-Dukát Z. 2005. Rao´s quadratic entropy as a measure of functional diversity based on multiple traits. Journal of Vegetation Science 16: 533-540.; Villegér et al. 2008Villéger S, Mason NWH, Mouillot D. 2008. New multidimensional functional diversity indices for a multifaceted framework in functional ecology. Ecology 89: 2290-2301.; Laliberté & Legendre 2010Laliberté E, Legendre P. 2010. A distance-based framework for measuring functional diversity from multiple traits. Ecology 91: 299-305.).
Mason et al. (2005Mason NWH, Mouillot D, Lee WG, Wilson JB. 2005. Functional richness, functional evenness and functional divergence: the primary components of functional diversity. Oikos 111: 112-118.) maintain that functional diversity can be divided into three distinct facets: functional richness, divergence and evenness/regularity. Indices that express richness usually indicate how much of niche space is occupied by a given species assemblage, while divergence refers to how species abundance diverges in niche space, and evenness indicates how regular the distribution of species abundance is within niche space (Schleuter et al. 2010Schleuter D, Daufresne M, Massol F, Argillier C. 2010. A user`s guide to functional diversity indices. Ecological Monographs 80: 469-484.). These three aspects are complementary (Mouchet et al. 2010Mouchet MA, Villéger S, Mason NWH, Mouillot D. 2010. Functional diversity measures: an overview of their redundancy and their ability to discriminate community assembly rules. Functional Ecology 24: 867-876.) and when used in conjunction with one another reveal the processes that link biodiversity to ecosystem functioning more clearly (Villegér et al. 2008Villéger S, Mason NWH, Mouillot D. 2008. New multidimensional functional diversity indices for a multifaceted framework in functional ecology. Ecology 89: 2290-2301.).
There are several indices capable of expressing these different facets. These indices can be based on distance matrices (e.g., FAD, Walker et al. 1999Walker BH, Kinzig A, Langridge J. 1999. Plant attribute diversity, resilience and ecosystem function: the nature and significance of dominant and minor species. Ecosystems 2: 95-113.; MFAD, Heemsbergen et al. 2004Heemsbergen DA, Berg MP, Loreal M, Hal JR, Faber JH, Verhoef HA. 2004. Biodiversity effects on soil processes explained by interspecific functional dissimilarity biodiversity. Science 306: 1019-1020.; Rao (Rao 1982Rao CR. 1982. Diversity and dissimilarity coefficients: a unified approach. Theorical Population Biology 21: 24-43.; Botta-Dukát 2005Botta-Dukát Z. 2005. Rao´s quadratic entropy as a measure of functional diversity based on multiple traits. Journal of Vegetation Science 16: 533-540.), functional dendrograms (e.g., FD, Petchey & Gaston 2002Petchey OL, Gaston KJ. 2002. Functional diversity (FD), species richness and community composition. Ecology Letters 5: 402-411.; MPD and MNTD, Webb 2000Webb CO. 2000. Exploring the phylogenetic structure of ecological communities: an example for rain forest trees. American Naturalist 156: 145-155.) or the volume occupied in multidimensional functional space (e.g., FRic, FDiv, FEve, Villéger et al. 2008Villéger S, Mason NWH, Mouillot D. 2008. New multidimensional functional diversity indices for a multifaceted framework in functional ecology. Ecology 89: 2290-2301.; FDis, Laliberté & Legendre 2010Laliberté E, Legendre P. 2010. A distance-based framework for measuring functional diversity from multiple traits. Ecology 91: 299-305.), or they may consider intraspecific variability (TOP and TED, Fontana et al. 2016Fontana S, Petchey OL, Pomati F. 2016. Individual-level trait diversity concepts and indices to comprehensively describe community change in multidimensional trait space. Functional Ecology 30: 808-818.) and gaps in one-dimensional and multidimensional functional space (e.g., FRls and FRlm, Schleuter et al. 2010Schleuter D, Daufresne M, Massol F, Argillier C. 2010. A user`s guide to functional diversity indices. Ecological Monographs 80: 469-484.). While some of the most commonly used indices are based on dendrograms (e.g., Hidasi-Neto et al. 2012Hidasi-Neto J, Barlow J, Cianciaruso MV. 2012. Bird functional diversity and wildfires in the Amazon: the role of Forest structure. Animal Conservation 15:407-415.; Carvalho & Tejerina-Garro 2014Carvalho RA, Tejerina-Garro FL. 2014. Environmental and spatial processes: what controls the functional structure of fish assemblages in tropical Rivers and headwater streams. Ecology of Freshwater Fish 24: 317-328.; Rodríguez & Ojeda 2014Rodríguez D, Ojeda RA. 2014. Scaling functional diversity of mammals in desert systems. Journal of Zoology 293: 262-270.), they remain the subject of numerous discussions regarding methodological aspects inherent in their construction (Podani & Schmera 2006Podani J, Schmera D. 2006. On dendrograma-based measures of functional diversity. Oikos 115: 179-185.; Petchey & Gaston 2007Petchey OL, Gaston KJ. 2007. Dendrograms and measuring functional diversity. Oikos 116: 1422-1426.; Podani & Schmera 2007Podani J, Schmera D. 2007. How should a dendrograma-based measure of functional diversity function? A rejoinder to Petchey and Gaston. Oikos 116: 1427-1430.; Mouchet et al. 2008Mouchet M. Guilhaumon F, Villéger S, Mason NWH, Tomasini JA, Mouillot D. 2008. Towards a consensus for calculating dendrograma-based functional diversity indices. Oikos 117: 794-800.).
One of the simplest ways to measure functional diversity in a community is to calculate Functional Group Richness (FGR). In the FGR index, the functional similarity between species may be determined from a distance matrix, constructed based on the functional traits of species, and converted into a dendrogram via a linkage method (Ricotta 2005Ricotta C. 2005. A note on functional diversity measures. Basic and Applied Ecology 6: 479-486.). A threshold dendrogram is then defined to determine the similarity level between species, allowing similar species to be grouped within the same functional group (Petchey & Gaston 2006Petchey OL , Gaston, KJ. 2006. Functional diversity: back to basics and looking forward. Ecology Letters 9: 741-758.). The dendrogram threshold is usually arbitrary (but see Teresa et al. 2015Teresa FB, Casatti L, Cianciaruso MV. 2015. Functional differentiation between fish assemblages from forested and deforested streams. Neotropical Ichthyology 13: 361-370.) and it is defined according to the purpose of the study or the researchers’ own criteria (Pla et al. 2012Pla L, Casanoves F, Di Rienzo J. 2012. Functional Groups. In: Pla L, Casanoves F, Di Rienzo J. (eds.) Quantifying Functional Biodiversity. Dordrecht, Springer p. 9-25.).
Other continuous methods (i.e., which do not divide the species into functional groups according to their traits) for assessing functional diversity have been developed, many of which are derived from the calculation of phylogenetic diversity (Pavoine & Bonsall 2011Pavoine S, Bonsall MB. 2011. Measuring biodiversity to explain community assembly: a unified approach. Biological Reviews 86: 792-812.). The Functional Diversity (FD) index is the sum of dendrogram branch lengths (Petchey & Gaston 2002Petchey OL, Gaston KJ. 2002. Functional diversity (FD), species richness and community composition. Ecology Letters 5: 402-411.), generated from a functional traits distance matrix, while the Mean Pairwise Distance (MPD) index is the average distance between pairs of species that compose a community (Webb 2000Webb CO. 2000. Exploring the phylogenetic structure of ecological communities: an example for rain forest trees. American Naturalist 156: 145-155.) and the Mean Nearest Taxon Distance (MNTD) index is equal to the average dendrogram lengths between the functionally most similar pairs of species in the community (Webb 2000). Although there are other continuous indices of functional diversity based on dendrograms (e.g., GFD Mouchet et al. 2008Mouchet M. Guilhaumon F, Villéger S, Mason NWH, Tomasini JA, Mouillot D. 2008. Towards a consensus for calculating dendrograma-based functional diversity indices. Oikos 117: 794-800.; NMDS Cadotte et al. 2009Cadotte MW, Cavender-Bares J, Tilman D, Oakley TH. 2009. Using phylogenetic, functional and trait diversity to understand patterns of plant community productivity. Plos One 4: e5695. doi.org/10.1371/journal.pone.0005695 .
https://doi.org/10.1371/journal.pone.000...
), the above mentioned indices are some of the most frequently used to describe functional richness and divergence in aquatic (Colzani et al. 2013Colzani E, Siqueira T, Suriano MT, Roque FB . 2013. Responses of aquatic insect functional diversity to landscape changes in Atlantic Forest. Biotropica 45: 343-350.; Carvalho & Tejerina-Garro 2015Carvalho RA, Tejerina-Garro FL. 2015. Relationships between taxonomic and functional components of diversity: implications for conservation of tropical freshwater fishes. Freshwater Biology 60: 1854-1862. ; Dunck et al. 2015Dunck B, Rodrigues L, Bicudo DC. 2015. Functional diversity and functional traits of periphytic algae during a short-term successional process in a Neotropical floodplain lake. Brazilian Journal of Biology 75: 587-597.) and terrestrial communities (e.g., Bihn et al. 2010Bihn JH, Gebauer G, Brandl R. 2010. Loss of functional diversity of ant assemblages in secondary tropical forests. Ecology 91: 782-792.; Cianciaruso et al. 2012Cianciaruso MV, Batalha MA, Gaston KJ, Petchey OL. 2012. The influence of fire on phylogenetic and functional structure of woody savannas: moving from species to individuals. Perspectives and Plant Ecology, Evolution and Systematics 14: 205-216.; Hidasi-Neto et al. 2012Hidasi-Neto J, Barlow J, Cianciaruso MV. 2012. Bird functional diversity and wildfires in the Amazon: the role of Forest structure. Animal Conservation 15:407-415.).
Calculating functional diversity based on dendrograms usually requires three methodological steps: the construction of a distance matrix from species functional traits, the selection of a linkage method and the construction of the functional dendrogram (Petchey & Gaston 2006Petchey OL , Gaston, KJ. 2006. Functional diversity: back to basics and looking forward. Ecology Letters 9: 741-758.). The selection of the distance matrix and linkage method generate variation in the resulting indices due to sensitivities to different methodological steps used in dendrogram construction (Poos et al. 2009Poos MS, Walker SC, Jackson DA. 2009. Functional-diversity indices can be driven by methodological choices and species richness. Ecology 90: 341-347.). However, another potential source of variation is the measurement of functional diversity, which depends on the choice of index itself, from the various options available in the literature (e.g., FGR, FD, MPD, MNTD).
In addition to methodological controversies, some indices may be differentially sensitive to environmental conditions, causing differences in their predictive power (Pakeman 2011Pakeman RJ. 2011. Functional diversity indices reveal the impacts of land use intensification on plant community assembly. Journal of Ecology 99: 1143-1151.). These differences in performance are commonly associated with the mathematical characteristics of the metrics (Petchey et al. 2004Petchey OL, Hector A, Gaston KJ. 2004. How different measures of functional diversity perform? Ecology 85: 847-857.; Ricotta 2005Ricotta C. 2005. A note on functional diversity measures. Basic and Applied Ecology 6: 479-486.). For example, MPD and MNTD differ in relation to functional richness indices (e.g., FGR and FD) because they are divergence indices, based on the average distance between species rather than the sum of functional entities. Patterns of average pairwise differences between species have been used to address the processes underlying species co-occurrence (Tucker et al. 2017Tucker CM, Cadotte MW, Carvalho SB, et al. 2017. A guide to phylogenetic metrics for conservation, community ecology and macroecology. Biological Reviews 92: 698-715. ). In fact, the co-occurrence of functionally similar species has been associated with processes of environmental filtering, while the concept of limited similarity has been formulated based on the co-occurrence of functionally distinct species (Mouillot et al. 2007Mouillot D, Dumay O, Tomasini JA. 2007. Limiting similarity, niche filtering and functional diversity in coastal lagoon fish communities. Estuarine, Coastal and Shelf Sciences 71: 443-456.; Sobral & Cianciaruso 2015Sobral FL, Cianciaruso MV. 2015. Functional and phylogenetic structure of forest and savanna bird assemblages across spatial scales. Ecography 39: 533-541. ; but see Mayfield & Levine 2010Mayfield MM, Levine JM. 2010. Opposing effects of competitive exclusion on the phylogenetic structure of communities. Ecology Letters 13: 1085-1093.). Therefore, we would expect that metrics describing how different, on average, species are among communities could be more informative for predicting niche-based processes.
While previous studies have compared the performance of different functional diversity indices (e.g., Petchey et al. 2004Petchey OL, Hector A, Gaston KJ. 2004. How different measures of functional diversity perform? Ecology 85: 847-857.; Schmera et al. 2009Schmera D, Erös T, Podani J. 2009. A measure for assessing functional diversity in ecological communities. Aquatic Ecology 43: 157-167.; Teresa & Casatti 2017Teresa FB, Casatti L. 2017. Trait-based metrics as bioindicators: Responses of stream fish assemblages to a gradient of environmental degradation. Ecological Indicators 75: 249-258.), none of these studies were dedicated exclusively to indices based on dendrograms, despite their increased use and occurrence in the scientific literature (for the use of FD see Mouchet et al. 2008Mouchet M. Guilhaumon F, Villéger S, Mason NWH, Tomasini JA, Mouillot D. 2008. Towards a consensus for calculating dendrograma-based functional diversity indices. Oikos 117: 794-800.; Petchey et al. 2009Petchey OL, Gaston KJ, 2009. Dendrograms and measures of functional diversity: a second installment. Oikos 118: 1118-1120.). Similarly, there are ample discussions on their methodological issues (Podani & Schmera 2006Podani J, Schmera D. 2006. On dendrograma-based measures of functional diversity. Oikos 115: 179-185.; 2007; Petchey & Gaston 2007), although there is still no general consensus (Mouchet et al. 2008Mouchet M. Guilhaumon F, Villéger S, Mason NWH, Tomasini JA, Mouillot D. 2008. Towards a consensus for calculating dendrograma-based functional diversity indices. Oikos 117: 794-800.). ;
Here, we present a methodological approach for evaluating variation among functional diversity metrics based on dendrograms (see a similar approach to evaluating variation of ecological niche models by Diniz-Filho et al. 2009Diniz-Filho JAF, Bini LM, Rangel TF, et al. 2009. Partitioning and mapping uncertainties in ensembles of forecasts of species turnover under climate change. Ecography 32: 897-906.) in geographical space, using phytoplankton community data from 29 floodplain lakes in the Middle Araguaia River, central Brazil. Thus, we address the following questions: i) How important are the type of index and linkage method as sources of variation in functional diversity values of lake communities? ii) Is the variation among values of functional diversity spatially structured along the floodplains, that is, are more proximate lakes more similar in terms of functional diversity than more distant lakes? iii) Do diversity-environment relationships vary according to the type of index and/or linkage method? We expect that the choice of index and linkage method will explain variation among functional diversity values. We further expect that this variation originates from index characteristics that depend upon how each index is associated with environmental variables. To answer the first question we use the decomposition of the sum of squares (ANOVA) considering variation of the indices and linkage methods within each lake. To answer the second question, we measured the spatial pattern of variation in functional diversity through the Moran I index, and to answer the third question, we associated environmental variables with functional diversity indices through a Canonical Correspondence Analysis.
Materials and methods
Dataset
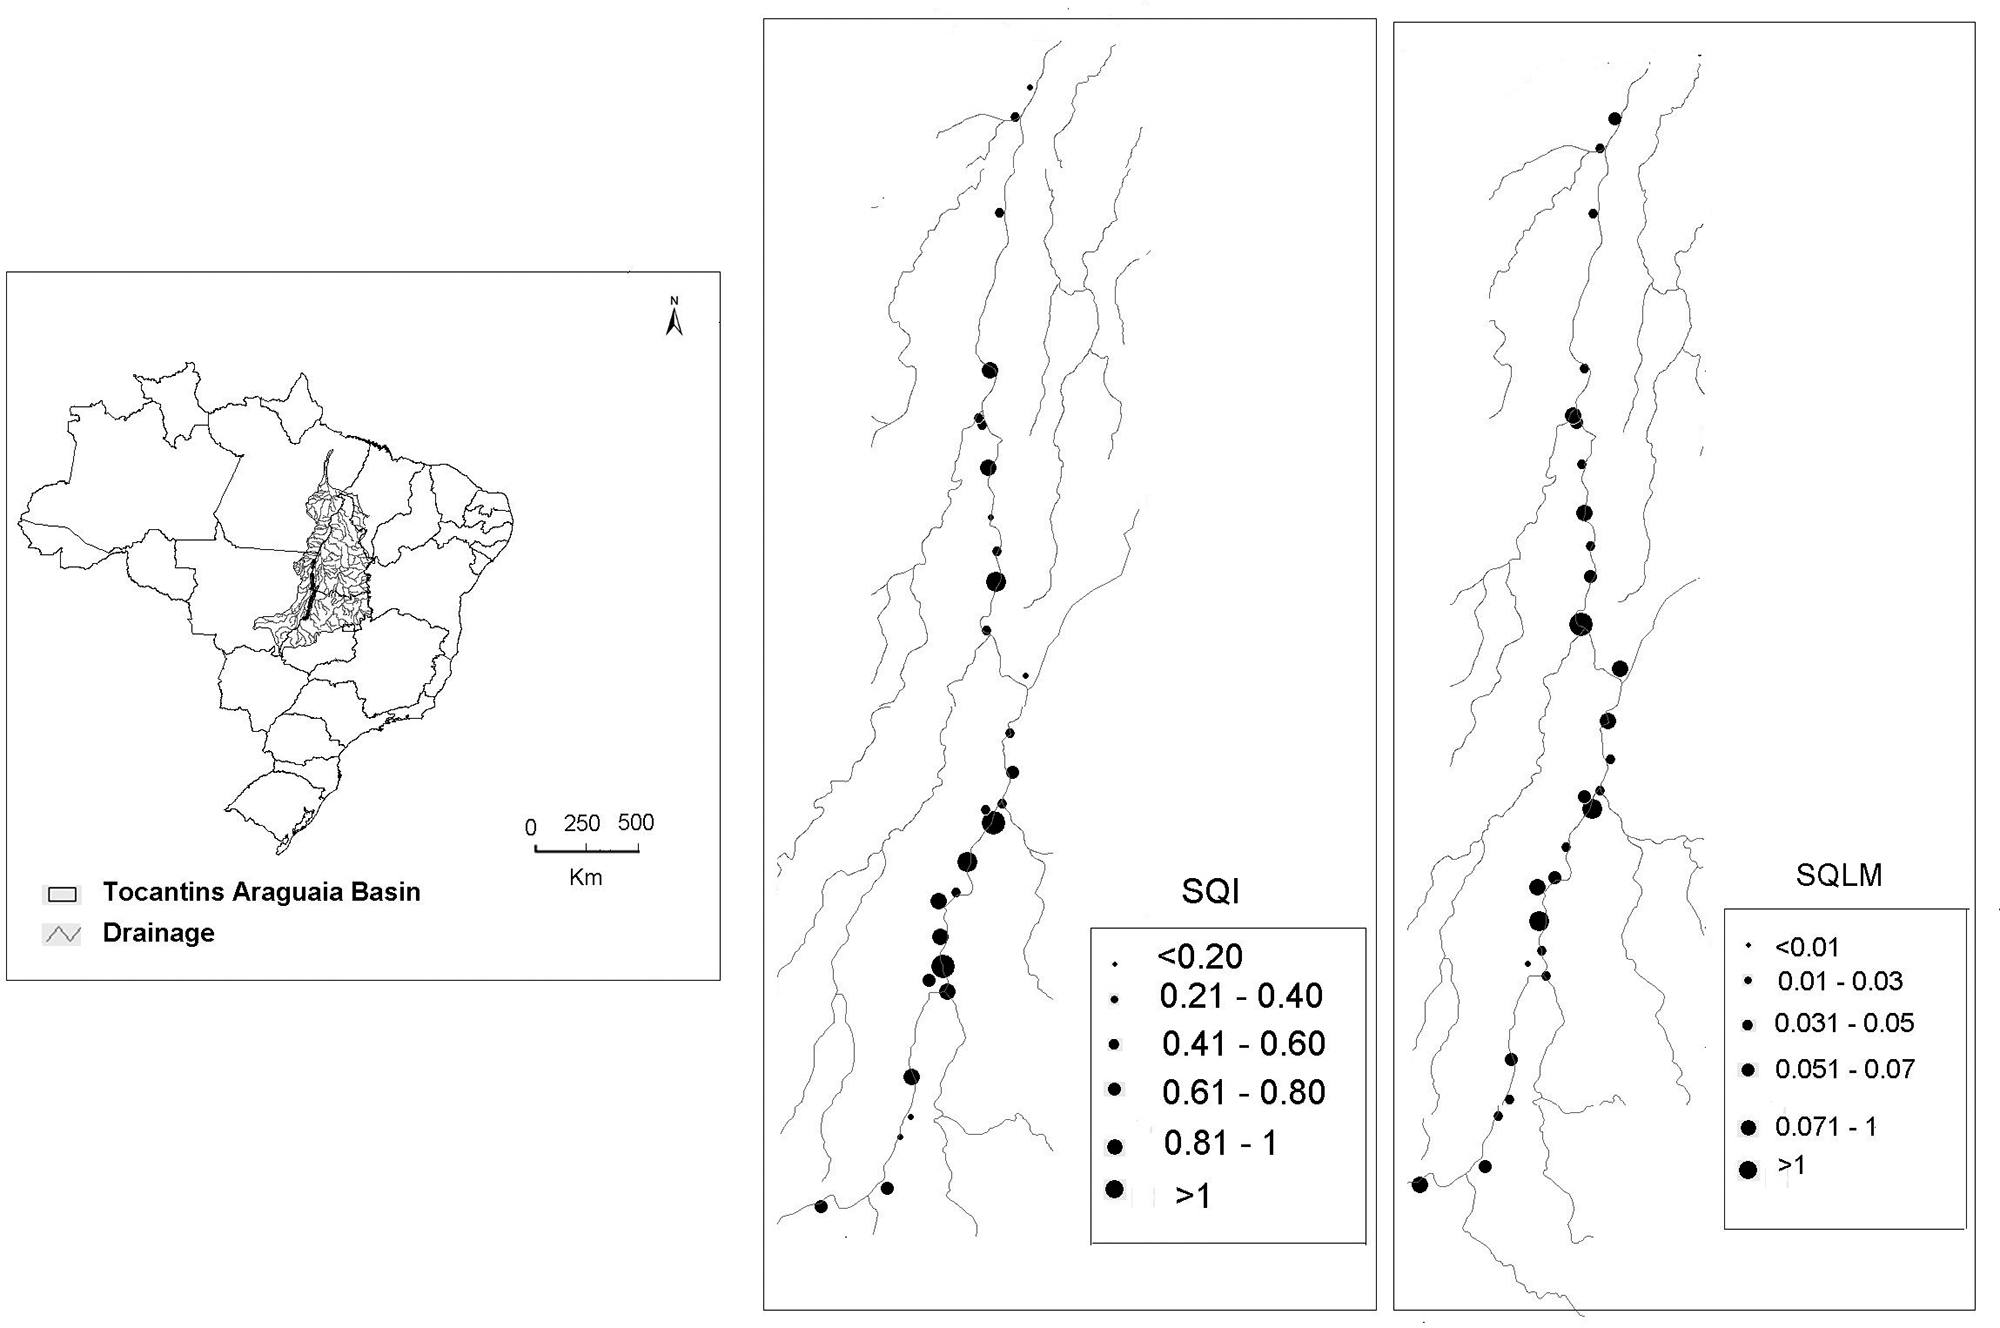
We sampled 29 floodplain lakes located along 500 km of the Middle Araguaia River and four large tributaries (Crixás, Mortes, Vermelho and Cristalino) in central Brazil (Fig. 1). The floodplain lakes are distributed among the states of Goiás, Tocantins and Mato Grosso (14°72'86" to 10°54'73"S 51°03'57'' to 50°55'22''W). Samples were collected in January 2012 during the high-water period. We chose this month, because it is in the middle of the rainy period (started in November), and the characteristics of the phytoplankton community, landscape, morphometrics and limnology of the lakes have already stabilized and therefore different from that of low water periods (Nabout et al. 2006Nabout JC, Nogueira IS, Oliveira LG. 2006. Phytoplankton community of floodplain lakes of the Araguaia River, Brazil, in the rainy and dry seasons. Journal of Plankton Research 28: 181-193.; 2009Nabout JC, Siqueira T, Bini LM, Nogueira IS. 2009. No evidence for environmental and spatial process in structuring phytoplankton communities. Acta Oecologica 35: 720-726.). Moreover, although we use one temporal sample, the present study was developed on a wide spatial scale, thus taking into consideration biological, limnological, morphometric and landscape variation. During the collection period, 19 of the lakes were connected to the main river channel and 10 were isolated. The floodplain lakes varied in terms of limnological, morphometrical and soil use characteristics (Machado et al. 2015Machado KB, Borges PP, Carneiro FM, et al. 2015. Using lower taxonomic resolution and ecological approaches as a surrogate for plankton species. Hydrobiologia 743: 255-267.; 2016Machado KB, Teresa FB, Vieira LCG, Huszar VLM, Nabout JC. 2016. Comparing the effects of landscape and local environmental variables on taxonomic and functional composition of plankton communities. Journal of Plankton Research 38: 1334-1346.) and represent 29 communities that vary in phytoplankton species richness (6-22 species, see details in Machado et al. 2015Machado KB, Borges PP, Carneiro FM, et al. 2015. Using lower taxonomic resolution and ecological approaches as a surrogate for plankton species. Hydrobiologia 743: 255-267.).

Location of the 29 floodplain lakes sampled along the Middle Araguaia River and its tributaries. Numbers indicate the floodplain lakes studied along the basin.
Phytoplankton was collected from subsurface water (0.5 m), stored in dark bottles and fixed with acetic acid modified Lugol’s (Vollenweider 1974Vollenweider RA. 1974. A manual on methods for measuring primary production in aquatic environments. London, Blackwell Scientific Publications.). Individuals were identified to the lowest taxonomic level possible. We obtained 10 functional traits (Weithoff 2003Weithoff G. 2003. The concepts of “plant functional types” and “functional diversity” in lake phytoplankton - a new understanding of phytoplankton ecology? Freshwater Biology 48: 1669-1675.; Kruk et al. 2010Kruk C, Huszar VLM, Bonilla S, Costa L, Lurling M, Reynolds CS, et al. 2010. A morphological classification capturing functional variation in phytoplankton. Freshwater Biology 55: 614-627.) of the 115 phytoplankton species found in the region: maximum linear dimension, individual surface area, individual biovolume, biological form, mucilage, demand for silica, heterocytes, mixotrophy, flagella and aerotopes. For the traits "biological form" and "mucilage", species were classified according to the states of the functional trait, where the same species can show more than one state (Tab. 1). The traits were obtained through screening the samples and consulting the literature or specialists (Tab. 1). The counting of individuals and the measurements to obtain the functional traits were performed in separate steps, since these two approaches require the use of different microscopes (inverted microscope for counting individuals and optical microscope for performing cell measurements). Thus, not all counted individuals were found again for the measurements. We measured the cell dimensions for all the individuals of a species found in the samples (between one and four individuals) and then calculated the average value to estimate maximum linear dimension, biovolume and individual surface area. The individual surface area and biovolume of species were estimated using the equations described in Hillebrand et al. (1999Hillebrand H, Dürselen CD, Kirschtel D, Pollingher U, Zohary T. 1999. Biovolume calculation for pelagic and benthic microalgae. Journal of Phycology 35:403-424.).
Phytoplankton functional traits used to calculate the functional diversity indices based on dendrograms via seven linkage methods. The classified categorical traits indicate that species may be simultaneously classified into more than one category. For example, the same species may be found in unicellular or colonial biological form. MLD: Maximum Linear Dimension; ISA: Individual Surface Area; 1: functional attributes were obtained during the screening of samples; 2: functional attributes were obtained from the literature and consulting databases and experts.
We assessed the following local environmental variables: oxygen saturation, total nitrogen, total phosphorus and transparency. These variables are important to the organization of phytoplankton communities and are known to regulate their dynamics in aquatic environments (Reynolds 2006Reynolds CS. 2006. Ecology of phytoplankton. Cambridge, Cambridge University Press.). Zooplankton are one of the main predators of phytoplankton in aquatic environments and, along with environmental variables, play an important role in the structure and dynamics of these communities (Reynolds 2006Reynolds CS. 2006. Ecology of phytoplankton. Cambridge, Cambridge University Press.). Thus, within the set of local environmental variables we included a variable “zooplankton density”, which was the sum of the density of all zooplankton groups (i.e., cladocerans, copepods and rotifers). Oxygen saturation was estimated using a portable oximeter (Digimed DM- 4P) and water transparency was measure using a Secchi disk. The concentrations of total nitrogen and total phosphorus were obtained following the protocols described in Zagatto et al. (1981Zagatto EAG, Jacintho AO, Reis BF, et al. 1981 Manual de análises de plantas empregando sistemas de injeção em fluxo. Piracicaba, Universidade de São Paulo.). For the collection of zooplankton, 500 liters of water were filtered through a plankton net (68 µm mesh) using a suction pump. The number of organisms was estimated according to Bottrell et al. (1976Bottrell HH, Duncan A, Gliwicz ZM, et al. 1976. Review of some problems in zooplankton production studies. Norwegian Journal of Zoology 24: 419-456.) and the total density was expressed in individuals per cubic meter (ind/m³). All variables were assessed at the same place and depth as the phytoplankton. Further details on the sampling of zooplankton are described in Machado et al. (2015Machado KB, Borges PP, Carneiro FM, et al. 2015. Using lower taxonomic resolution and ecological approaches as a surrogate for plankton species. Hydrobiologia 743: 255-267.).
Landscape variables were represented by the types of land cover around each floodplain lake. Land cover data were obtained through interpretation of satellite Landsat 5TM images (30-meter spatial resolution, orbits 223/67 to 223/70) that are freely available from the Instituto Nacional de Pesquisas Espaciais (INPE; http://www.dgi.inpe.br/CDSR/). The scenes were georeferenced based on Geocover images (GLS-Landsat, available at http://landsat.usgs.gov/), after which we constructed image mosaics. These procedures were performed using the software ERDAS. We created a buffer of 10 km around each floodplain lake and quantified the percentage of different land cover classes (i.e., agriculture, native Cerrado vegetation and pasture) found within the buffer with Arcgis 9.3. The choice of spatial scale for this study was due to many factors, such as the biology of the studied taxa, dispersal capabilities, sampling interval and system heterogeneity (Legendre & Legendre 1998Legendre P. Legendre L. 1998. Numerical Ecology. Amsterdam, E lsevier Science.). We used a buffer of 10 km with the intention of capturing an impact gradient along the sampled lakes (i.e., native vegetation, pasture and agriculture).
Functional diversity indices and linkage methods
We used four distinct functional diversity indices based on dendrograms: Functional Group Richness (FGR); Functional Diversity (FD) proposed by Petchey & Gaston (2002Petchey OL, Gaston KJ. 2002. Functional diversity (FD), species richness and community composition. Ecology Letters 5: 402-411.); Mean Pairwise Distance (MPD) and Mean Nearest Taxon Distance (MNTD) described in Webb (2000Webb CO. 2000. Exploring the phylogenetic structure of ecological communities: an example for rain forest trees. American Naturalist 156: 145-155.). We selected these four indices because they are commonly used in functional ecology (Petchey et al. 2009; Hidasi-Neto et al. 2012Hidasi-Neto J, Barlow J, Cianciaruso MV. 2012. Bird functional diversity and wildfires in the Amazon: the role of Forest structure. Animal Conservation 15:407-415.; Best et al. 2013Best RJ, Caulk NC, Stachowicz JJ . 2013. Trait vs. Phylogenetic diversity as predictors of competition and community composition in herbivorous marine amphipods. Ecology Letters 16: 72-80.; Coyle et al. 2014Coyle JR, Halliday FW, Lopez BE, Palmquist KA, Wilfahrt PA, Hurlbert AH. 2014. Using trait and phylogenetic diversity to evaluate the generality of the stress-dominance hypothesis in eastern North American tree communities. Ecography 37: 814-826.), they represent different aspects of diversity and have different mathematical characteristics (Pavoine & Bonsall 2011Pavoine S, Bonsall MB. 2011. Measuring biodiversity to explain community assembly: a unified approach. Biological Reviews 86: 792-812.). Although MNTD and MPD can be calculated with a raw distance matrix (Kembel et al. 2010Kembel SW, Cowan PD, Helmus MR, et al. 2010. Picante: R tools for integrating phylogenies and ecology. Bioinformatics 26: 1463-1464.; 2014Kembel SW, Ackerly DD, Blomberg SP, et al. 2014. Picante: R tools for integrating phylogenies and ecology. R package version 1.6-2. https://cran.r-project.org/web/packages/picante/picante.pdf. 14 Dec. 2015
https://cran.r-project.org/web/packages/...
), their interpretation is more intuitive when these indices are based on dendrograms, which is why their calculation using dendrograms is very common (e.g., Cianciaruso et al. 2012Cianciaruso MV, Batalha MA, Gaston KJ, Petchey OL. 2012. The influence of fire on phylogenetic and functional structure of woody savannas: moving from species to individuals. Perspectives and Plant Ecology, Evolution and Systematics 14: 205-216.; Hidasi-Neto et al. 2012Hidasi-Neto J, Barlow J, Cianciaruso MV. 2012. Bird functional diversity and wildfires in the Amazon: the role of Forest structure. Animal Conservation 15:407-415.; Carvalho & Tejerina-Garro 2014Carvalho RA, Tejerina-Garro FL. 2014. Environmental and spatial processes: what controls the functional structure of fish assemblages in tropical Rivers and headwater streams. Ecology of Freshwater Fish 24: 317-328.; Dunck et al. 2015Dunck B, Rodrigues L, Bicudo DC. 2015. Functional diversity and functional traits of periphytic algae during a short-term successional process in a Neotropical floodplain lake. Brazilian Journal of Biology 75: 587-597.).
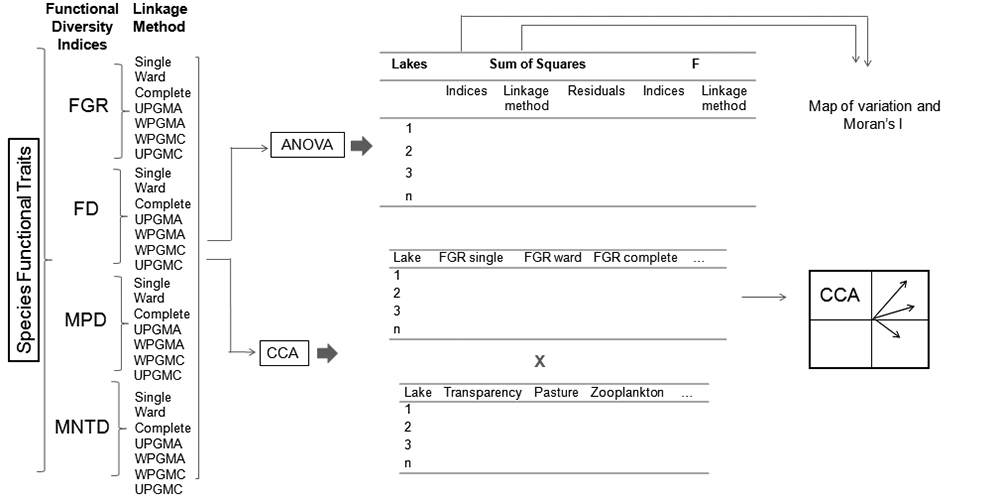
Numerous linkage methods exist, which are classified according to their methodological characteristics (e.g., hierarchical or non-hierarchical; agglomeration or division, and others, Legendre & Legendre 1998Legendre P. Legendre L. 1998. Numerical Ecology. Amsterdam, E lsevier Science.). Here we calculated each index using seven hierarchical agglomerative linkage methods (Legendre & Legendre 1998Legendre P. Legendre L. 1998. Numerical Ecology. Amsterdam, E lsevier Science.): Single Linkage Agglomerative Clustering (Single); Ward Minimum Variance Method (Ward); Complete Linkage Agglomerative Clustering (Complete); Unweighted Arithmetic Average Clustering (UPGMA); Weighted Arithmetic Average Clustering (WPGMA); Weighted Centroid Clustering (WPGMC) and Unweighted Centroid Clustering (UPGMC). In each community, we obtained seven values for each functional diversity index from the seven linkage methods used (Fig. 2).

Schematic representation of the methods used to verify variation in the performance of functional diversity indices based on dendrograms and their linkage methods. The abbreviations used are as follows: FGR (Functional Group Richness); FD (Functional Diversity); MPD (Mean Pairwise Distance); MNTD (Mean Nearest Taxon Distance); Single (Single Linkage Agglomerative Clustering), Ward (Ward Minimum Variance Method), complete (Complete Linkage Agglomerative Clustering), UPGMA (Unweighted Arithmetic Average Clustering), WPGMA (Weighted Arithmetic Average Clustering), WPGMC (Weighted Centroid Clustering) and UPGMC (Unweighted Centroid Clustering), CCA: Canonical Correspondence Analysis.
Several methods have been proposed for the calculation of FGR, generally using environmental features (e.g., Pillar 1999Pillar VD. 1999. On the identification of optimal plant functional types. Journal of Vegetation Science 10: 631-640. ; Pillar & Sosinski Junior 2003Pillar VP, Sosinski Junior EE. 2003. An improved method for searching plants functional types by numerical analysis. Journal of Vegetation Science 14: 323-332.). However, to be consistent with the other indices (FD, MPD and MNTD), which do not consider environmental data in their calculations, we calculated FGR using only the functional traits of organisms (e.g., Pla et al. 2012Pla L, Casanoves F, Di Rienzo J. 2012. Functional Groups. In: Pla L, Casanoves F, Di Rienzo J. (eds.) Quantifying Functional Biodiversity. Dordrecht, Springer p. 9-25.). To date, there are no consolidated procedures for defining the cut-off point for dendrograms, and thus these criteria are usually defined according to the purposes of the researcher (Pla et al. 2012Pla L, Casanoves F, Di Rienzo J. 2012. Functional Groups. In: Pla L, Casanoves F, Di Rienzo J. (eds.) Quantifying Functional Biodiversity. Dordrecht, Springer p. 9-25.).
For our definition of FGR, we arbitrarily set the threshold for functional similarity between species at 0.70. A similarity greater than 0.70 is considered a high value (e.g., to define taxonomic resolutions, Heino 2010Heino J. 2010. Are indicator groups and cross-taxon congruence useful for predicting biodiversity in aquatic ecosystems? Ecological Indicators 10: 112-117.; or evaluation of collinearity, Tabachnick & Fidell 1989Tabachnick BG, Fidell LS. 1989. Using multivariate statistics. New York, Harper & Row.). Thus, this value was adopted because we believe that species that share more than 70 % of functional traits may be associated with similar ecosystem functions. Although the choice of cut-off point in the dendrogram can be another source of variation for functional diversity values, such variation does not occur in indices such as FD, MPD and MNTD, and it was therefore not included in this study. We standardized all indices to vary from zero (minimum functional diversity value) to one (maximum functional diversity value).
Our functional attribute matrices had different mathematical characteristics, including quantitative, categorical and nominal traits. Thus, we constructed dendrograms using Gower distance matrices. The choice of distance matrix may also be identified as a cause of variation in the calculation of functional diversity indices (Mouchet et al. 2008Mouchet M. Guilhaumon F, Villéger S, Mason NWH, Tomasini JA, Mouillot D. 2008. Towards a consensus for calculating dendrograma-based functional diversity indices. Oikos 117: 794-800.). However, Gower distance is recommended as the best choice for data with different scales or missing values (Podani & Schmera 2006Podani J, Schmera D. 2006. On dendrograma-based measures of functional diversity. Oikos 115: 179-185.; Petchey & Gaston 2009Petchey OL, Gorman EJO, Flynn DFB. 2009. A functional guide to functional diversity measures. In: Naeem S, Bunker DE, Hector A, Loreau M, Perrings C. (eds.) Biodiversity, ecosystem functioning and human wellbeing: An ecological and economic perspective. Oxford, Oxford University Press. p. 49-59.), and accommodates different types of variables (e.g., categorical, numeric, nominal, ordinal; Podani & Schmera 2006Podani J, Schmera D. 2006. On dendrograma-based measures of functional diversity. Oikos 115: 179-185.). We constructed the Gower distance matrices using the generalized Gower distance method proposed by Pavoine et al. (2009Pavoine S, Vallet J, Dufor AB, Gachet S, Daniel H. 2009. On the challenge of treating various types of variables: application for improving the measurement of functional diversity. Oikos 118: 391-402.).
To evaluate if the indices are associated with species richness, we performed a Pearson correlation. The indices were calculated using the vegan (Oksanen et al. 2015Oksanen J, Blanchet G, Roeland K, et al. 2015. Vegan: Community Ecology Package. R package version 2.3-2. http://cran.r-project.org/web/packages/vegan/vegan.pdf. 14 Dec. 2015.
http://cran.r-project.org/web/packages/v...
) and Picante (Kembel et al. 2014Kembel SW, Ackerly DD, Blomberg SP, et al. 2014. Picante: R tools for integrating phylogenies and ecology. R package version 1.6-2. https://cran.r-project.org/web/packages/picante/picante.pdf. 14 Dec. 2015
https://cran.r-project.org/web/packages/...
) packages in R 3.2.2 (R Core Team 2015R Core Team. 2015. R: A language and environment for statistical computing. R Foundation for Statistical Computing, Vienna, Austria. https://www.r-project.org/. 14 Dec. 2015.
https://www.r-project.org...
).
Evaluating and mapping variation of functional diversity indices
We conducted a two-way analysis of variance (ANOVA) without replication (Zar 2010Zar JH. 2010. Biostatistical Analysis. New Jersey, Pearson Print Hall.) to detect variation between the functional diversity indices and their linkage methods. We used an analysis of variance without replication, since we had only one functional diversity value for each combination of factors (type of index and type of linkage method). In situations where there is no replication, it is not possible to estimate the interaction (Zar 2010Zar JH. 2010. Biostatistical Analysis. New Jersey, Pearson Print Hall.). The first factor in the ANOVA (hereinafter factor A) was the type of functional index, while the second factor (hereinafter factor B) was the type of linkage method used. We obtained the sum of squares of the indices (SQI), the sum of squares of the linkage methods (SQLM), the residual sum of squares (SQR; i.e., the portion of the variation that is not explained by the functional diversity indices and linkage methods) and the variation determined by the two factors together (i.e., the indices and linkage methods; SQT). We tested the significance level for components A and B using the F statistic (P <0.05). This approach was adapted from Diniz-Filho et al. (2009Diniz-Filho JAF, Bini LM, Rangel TF, et al. 2009. Partitioning and mapping uncertainties in ensembles of forecasts of species turnover under climate change. Ecography 32: 897-906.), who used a similar approach to evaluate variation among niche models and climate scenarios in global climate change projections of New World birds.
We calculated the ANOVA by performing spatial decomposition of the sum of squares; i.e., the variation caused by the indices and linkage methods was determined in each floodplain lake. Thus, we mapped the variation obtained for the indices and linkage methods along the middle floodplain of the Araguaia River. To statistically verify the spatial patterns identified in the maps, we built spatial correlograms for each component of variation (i.e., SQI, SQLM and SQT) using Moran's I coefficient. We employed six distance classes according to the Sturge rule (Legendre & Legendre 1998Legendre P. Legendre L. 1998. Numerical Ecology. Amsterdam, E lsevier Science.), and obtained significance levels using Bonferroni correction (Legendre & Legendre 1998Legendre P. Legendre L. 1998. Numerical Ecology. Amsterdam, E lsevier Science.). The spatial analyses were conducted with the Software SAM (Rangel et al. 2010Rangel TF, Diniz-Filho JAF, Bini LM. 2010. SAM: a comprehensive application for Spatial Analysis in Macroecology. Ecography 31:46-50.).
Canonical Correspondence Analysis (CCA) was performed to verify whether the indices and linkage methods were associated with different local or landscape variables. Thus, the variables used were: oxygen saturation, total phosphorus, total nitrogen, transparency, zooplankton density and presence of native Cerrado, agricultural and pastoral vegetation. In this analysis the limnological variables and zooplankton density were standardized using the Z score method and land use types by the arcsine of the square root x 180 / pi. The CCA was performed using the vegan package (Oksanen et al. 2015Oksanen J, Blanchet G, Roeland K, et al. 2015. Vegan: Community Ecology Package. R package version 2.3-2. http://cran.r-project.org/web/packages/vegan/vegan.pdf. 14 Dec. 2015.
http://cran.r-project.org/web/packages/v...
) in R (R Core Team 2015R Core Team. 2015. R: A language and environment for statistical computing. R Foundation for Statistical Computing, Vienna, Austria. https://www.r-project.org/. 14 Dec. 2015.
https://www.r-project.org...
). The total significance of the CCA was verified with a Monte Carlo test with 1000 randomizations. A summary of the methodology used in this study is represented schematically in Figure 2.
Results
We found 115 phytoplankton species considering all evaluated floodplain lakes, with a mean of 14 species per lake (coefficient of variation = 27 %). On average, considering all linkage methods, we found 13 functional groups in the lake with the highest species richness and 5 functional groups in the lake with the lowest species richness. Mean values of FD, MPD and MNTD in the lake with the highest species richness were 1.00, 0.93 and 0.57, while in the lake with the lowest species richness they were 0.42, 0.96 and 0.99, respectively. The FGR and FD indices were positively correlated with species richness, while MPD and MNTD were negatively correlated with richness, although for MPD the correlations are not significant (Tab. 2).
Pearson correlation between species richness and functional diversity indices according to linkage method. The index values were standardized to range from zero to 1. The abbreviations used are as follows: FGR (Functional Group Richness); FD (Functional Diversity); MPD (Mean Pairwise Distance); MNTD (Mean Nearest Taxon Distance); Single (Single Linkage Agglomerative Clustering), Ward (Ward Minimum Variance Method), complete (Complete Linkage Agglomerative Clustering), UPGMA (Unweighted Arithmetic Average Clustering), WPGMA (Weighted Arithmetic Average Clustering), WPGMC (Weighted Centroid Clustering) and UPGMC (Unweighted Centroid Clustering).
The two-way ANOVA without replication applied to the functional diversity indices and linkage methods indicated that FGR, FD, MPD and MNTD values were distinct from each other for most of the assessed lakes (except for lakes 7, 17 and 24). However, we did not observe differences among linkage methods (Fig. 3). When we compared the indices and linkage methods, most of the variation in the values of functional diversity was assigned to the type of index used (Tab. 3).

Values obtained for the sum of squares (SQ) of the two-factor analysis of variance without replication performed between the functional diversity indices (A) and linkage methods (B). The number above each bar indicates the F-value (5 % critical F-value for the functional diversity indices = 3.18 and the linkage methods = 6.18). The abbreviations used are as follows: SQI (sum of squares of the index), SQLM (sum of squares of the linkage methods). The asterisk (*) indicates a significant result (p <0.05).
Variation attributed to the index (SQI), linkage method (SQLM) and the interaction between the two factors (SQT), considering the 29 floodplain lakes. The spatial variation in each component was evaluated using Moran’s I coefficient. The values in the table indicate Moran’s I coefficient for the first-class distance. We did not obtain any significant correlograms according to the Bonferroni correction.
Distinct values were observed for different functional diversity indices within the same community. However, we did not find a spatial pattern in the variation of the indices across the 29 sampling units. This is demonstrated by the dispersal pattern of the mapped points (Fig. 4) and by the absence of significant Moran’s I values (Tab. 3).

Variation observed among the four functional diversity indices (SQI) and the seven linkage methods (SQLM) across the sampling units. The sizes of the dots indicate the values obtained for the sum of squares of the indices. We did not find any significant differences for the sum of squares for the linkage methods.
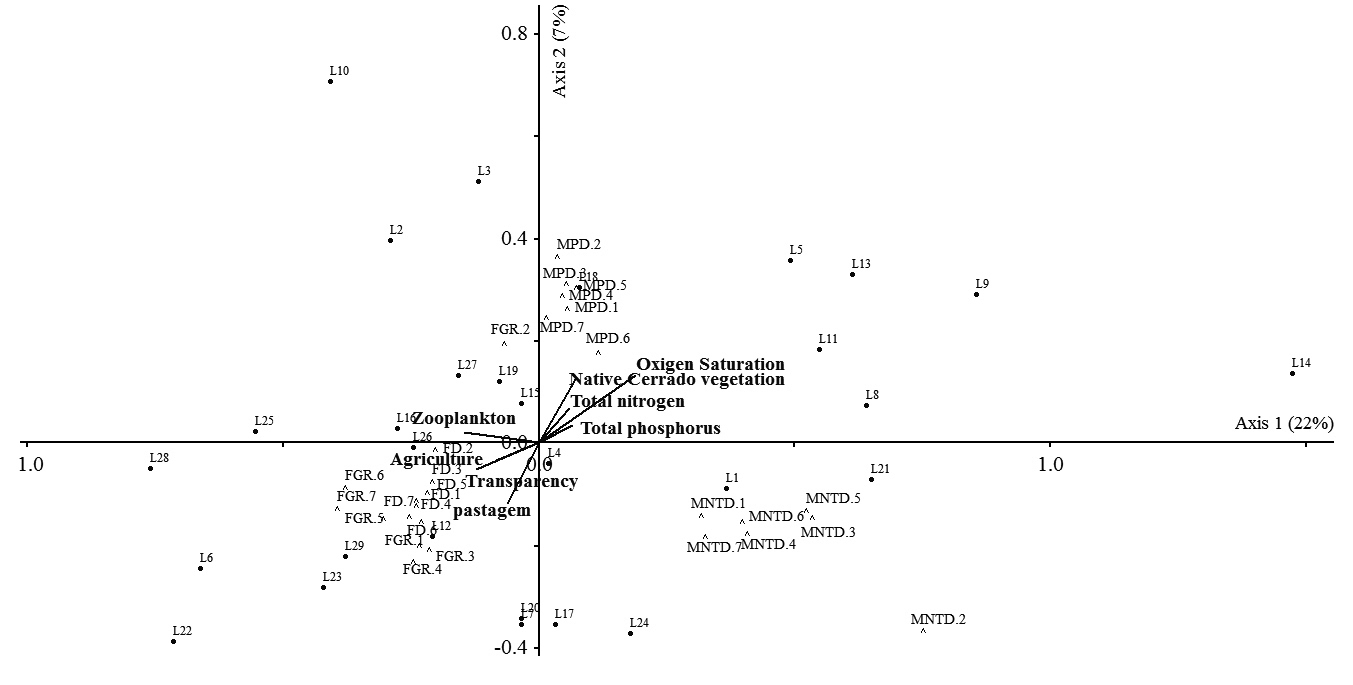
The first and second CCA axes applied to the environmental variables and functional diversity indices together explained 29 % of the variation in the data. We observed the formation of three distinct groups of indices (Fig. 5); the first group corresponded to MNTD, the second to MPD and the third to the FGR and FD. Local environmental and landscape variables did not exhibit statistically significant relationships with any of the functional diversity indices (Monte Carlo test, P = 0.32); in other words, these variables, which were measured in each lake, did not explain the variation among indices.

Canonical Correspondence Analysis (CCA) applied to the functional diversity indices and environmental variables. The numbers 1 to 7 represent the different linkage methods. 1 = Single Linkage Agglomerative Clustering; 2 = Ward Minimum Variance Method; 3 = Complete Linkage Agglomerative Clustering; 4 = Unweighted Arithmetic Average Clustering; 5 = Weighted Arithmetic Average Clustering; 6 = Weighted Centroid Clustering and 7 = Unweighted Centroid Clustering.
Discussion
Evaluations of variation in methodological approaches have been performed for species distribution models (e.g., Diniz-Filho et al. 2009Diniz-Filho JAF, Bini LM, Rangel TF, et al. 2009. Partitioning and mapping uncertainties in ensembles of forecasts of species turnover under climate change. Ecography 32: 897-906.; Tessarolo et al. 2014Tessarolo G, Rangel TF, Aráujo MB, Hortal J. 2014. Uncertainty associated with survey design in species distribution models. Diversity and Distributions 20: 1258-1269.), richness estimators (e.g., Brose et al. 2003Brose U. 2003. Estimating species richness: sensitivity to sample coverage and insensitivity to special patterns. Ecology 84: 2364-2377.), beta diversity indices (e.g., Anderson et al. 2011Anderson MJ, Crist TO, Chase JM, et al . 2011. Navigating the multiple meanings of ß diversity: a roadmap for the practicing ecologist. Ecology Letters 14: 19-28.) and functional diversity indices (e.g., Petchey et al. 2004Petchey OL, Hector A, Gaston KJ. 2004. How different measures of functional diversity perform? Ecology 85: 847-857.; Schmera et al. 2009Schmera D, Erös T, Podani J. 2009. A measure for assessing functional diversity in ecological communities. Aquatic Ecology 43: 157-167.; Mouchet et al. 2010Mouchet MA, Villéger S, Mason NWH, Mouillot D. 2010. Functional diversity measures: an overview of their redundancy and their ability to discriminate community assembly rules. Functional Ecology 24: 867-876.). In this study, we used an approach that enabled us to map the sources of variation (i.e., type of index and linkage method) when calculating functional diversity via dendrograms and to evaluate their relationships with environmental conditions. Our results indicate that the main source of variation for functional diversity values in phytoplankton communities is the type of index used, while the choice of linkage method seems to be less influential.
The number of planktonic species sampled here may be considered low when compared to other studies conducted in the Araguaia River floodplain (e.g., Nabout et al. 2006Nabout JC, Nogueira IS, Oliveira LG. 2006. Phytoplankton community of floodplain lakes of the Araguaia River, Brazil, in the rainy and dry seasons. Journal of Plankton Research 28: 181-193.; 2007Pavoine S, Vallet J, Dufor AB, Gachet S, Daniel H. 2009. On the challenge of treating various types of variables: application for improving the measurement of functional diversity. Oikos 118: 391-402.). This is probably due to the period in which the samples were collected, since the flood pulse tends to homogenize the environments of the plain (Thomaz et al. 2007Thomaz SM, Bini LM, Bozelli RL. 2007. Floods increase similarity among aquatic habitats in river-floodplain systems. Hydrobiologia 579: 1-13. ). A relationship between species richness and functional diversity indices is commonly found in different communities (e.g., Petchey et al. 2009Petchey OL, Gorman EJO, Flynn DFB. 2009. A functional guide to functional diversity measures. In: Naeem S, Bunker DE, Hector A, Loreau M, Perrings C. (eds.) Biodiversity, ecosystem functioning and human wellbeing: An ecological and economic perspective. Oxford, Oxford University Press. p. 49-59.; Bihn et al. 2010Bihn JH, Gebauer G, Brandl R. 2010. Loss of functional diversity of ant assemblages in secondary tropical forests. Ecology 91: 782-792.; Hejda & de Bello 2013Hejda M, de Bello F. 2013. Impact of plant invasions on functional diversity in the vegetation of Central Europe. Journal of Vegetation Science 24: 890-897.), with the strongest effects usually occurring when a large number of functional traits are used that are not correlated with each other (Petchey et al. 2009Petchey OL, Gaston KJ, 2009. Dendrograms and measures of functional diversity: a second installment. Oikos 118: 1118-1120.). FD and FGR were positively correlated with species richness, while MPD and MNTD presented the opposite pattern (although MPD showed no significant correlation). These differences are associated with the mathematical characteristics of the indices. While FD and FGR are metrics that sum functional differences, MPD and MNTD are based on the average of the pairwise difference between species, so that the addition of a redundant species can reduce the values of MPD and MNTD (Petchey et al. 2009Petchey OL, Gaston KJ, 2009. Dendrograms and measures of functional diversity: a second installment. Oikos 118: 1118-1120.; Tucker et al. 2017Tucker CM, Cadotte MW, Carvalho SB, et al. 2017. A guide to phylogenetic metrics for conservation, community ecology and macroecology. Biological Reviews 92: 698-715. ). Our results suggest that species added in richer communities tended to be functionally redundant, causing the average distances to be reduced and generating a negative correlation, a pattern that can be interpreted as resulting from communities structured by environmental filtering (Mouillot et al. 2007Mouillot D, Dumay O, Tomasini JA. 2007. Limiting similarity, niche filtering and functional diversity in coastal lagoon fish communities. Estuarine, Coastal and Shelf Sciences 71: 443-456.). In fact, by analyzing the same dataset, Machado et al. (2016Machado KB, Teresa FB, Vieira LCG, Huszar VLM, Nabout JC. 2016. Comparing the effects of landscape and local environmental variables on taxonomic and functional composition of plankton communities. Journal of Plankton Research 38: 1334-1346.) found that local environmental variables were important in driving variation in phytoplankton community composition.
The four indices showed different values within the same community and this pattern of variation was not spatially structured. That is, we did not find a spatial pattern for the variation of functional diversity along the Middle Araguaia River. Thus, it was not possible to identify sets of floodplain lakes that were geographically closer, in which variation in the indices used was higher or lower. Phytoplankton species exhibit different forms of dispersal (Reynolds 2006Reynolds CS. 2006. Ecology of phytoplankton. Cambridge, Cambridge University Press.), which may contribute to their wide distribution. Indeed, species composition and the functional traits used to calculate the indices, have no spatial pattern in these communities (Machado et al. 2016Machado KB, Teresa FB, Vieira LCG, Huszar VLM, Nabout JC. 2016. Comparing the effects of landscape and local environmental variables on taxonomic and functional composition of plankton communities. Journal of Plankton Research 38: 1334-1346.). In fact, many studies have shown that space is not limiting for the occurrence of phytoplankton species in tropical metacommunities (Nabout et al. 2009Nabout JC, Siqueira T, Bini LM, Nogueira IS. 2009. No evidence for environmental and spatial process in structuring phytoplankton communities. Acta Oecologica 35: 720-726.; Huszar et al. 2015Huszar VLM, Nabout JC, Appel MO, Santos JBO, Abe DS, Silva LH. 2015. Environmental and not spatial process (directional and non-directional) shape the phytoplankton composition and functional groups in a large subtropical river basin. Journal of Plankton Research 37: 1190-1200.). In addition, we evaluated the communities in the period of high waters, in which the floodplain environments tend to be connected.
The choice of linkage method is considered to be one of the causes of variation in dendrograms (Merigot et al. 2010Merigot B, Durbec JP, Gaertner JC. 2010. On goodness-of-fit measure dendrograma-based analyses. Ecology 91: 1850-1859.). However, our results indicated that the choice of linkage method did not influence variation in functional diversity values and did not affect their relationship with environmental conditions. Thus, the differences between the linkage methods may not be sufficient to modify general functional diversity patterns (Petchey & Gaston 2009Petchey OL, Gorman EJO, Flynn DFB. 2009. A functional guide to functional diversity measures. In: Naeem S, Bunker DE, Hector A, Loreau M, Perrings C. (eds.) Biodiversity, ecosystem functioning and human wellbeing: An ecological and economic perspective. Oxford, Oxford University Press. p. 49-59.), and one of the main criteria to be carefully considered during the calculation of functional diversity through dendrograms is the choice of index.
Although the association with environmental variables is not a criterion for assessing the performance of indices, the existence of such a correlation could be informative for identifying community assembly mechanisms (Mouchet et al. 2010Mouchet MA, Villéger S, Mason NWH, Mouillot D. 2010. Functional diversity measures: an overview of their redundancy and their ability to discriminate community assembly rules. Functional Ecology 24: 867-876.) and for applied purposes (e.g., trait-based biomonitoring, Teresa & Casatti 2017Teresa FB, Casatti L. 2017. Trait-based metrics as bioindicators: Responses of stream fish assemblages to a gradient of environmental degradation. Ecological Indicators 75: 249-258.). We selected environmental variables that are important for explaining variation in functional traits (Machado et al. 2016Machado KB, Teresa FB, Vieira LCG, Huszar VLM, Nabout JC. 2016. Comparing the effects of landscape and local environmental variables on taxonomic and functional composition of plankton communities. Journal of Plankton Research 38: 1334-1346.). However, contrary to our expectations, local environmental and landscape variables did not predict the differentiation among functional diversity indices. We expected that indices based on the average distances between species (MPD and MNTD) would perform better at detecting niche-based processes, due to their higher sensitivities to the occurrence of trait convergence and divergence (Tucker et al. 2017Tucker CM, Cadotte MW, Carvalho SB, et al. 2017. A guide to phylogenetic metrics for conservation, community ecology and macroecology. Biological Reviews 92: 698-715. ). However, it is possible that species functional identity drives variation in phytoplankton composition in floodplains. In this case, functional traits would outperform functional diversity metrics in predicting community assembly mechanisms (Díaz & Cabido 2001Díaz S, Cabido M. 2001. Vive La différence: plant functional diversity matters to ecosystem process. Trends in Ecology and Evolution 16: 646-655.; Machado et al. 2016Machado KB, Teresa FB, Vieira LCG, Huszar VLM, Nabout JC. 2016. Comparing the effects of landscape and local environmental variables on taxonomic and functional composition of plankton communities. Journal of Plankton Research 38: 1334-1346.; Teresa & Casatti 2017Teresa FB, Casatti L. 2017. Trait-based metrics as bioindicators: Responses of stream fish assemblages to a gradient of environmental degradation. Ecological Indicators 75: 249-258.).
Although the relationship between environment and variation in functional diversity was not significant, there is a clear pattern of differentiation between the indices in the CCA analysis. These results confirm the pattern obtained in the ANOVA, demonstrating once again, that the main source of variation in functional diversity is due to the type of index (as the different linkage methods of the same index are grouped close together in the CCA analysis). The MPD index is more sensitive to changes in the base of the functional dendrogram, while MNTD is more sensitive to changes in terminal branches (Webb 2000Webb CO. 2000. Exploring the phylogenetic structure of ecological communities: an example for rain forest trees. American Naturalist 156: 145-155.). This occurs because MPD considers the mean distances between all pairs of species that compose the community, while MNTD evaluates if neighboring species in the dendrogram are similar (Swenson 2014Swenson NG. 2014. Functional and phylogenetic ecology in R. New York, Springer.). These differences may have caused these indices to be grouped differently in the CCA.
On the other hand, FD considers the small functional differences among species that tend to be ignored by FGR when these differences occur within the same functional group; that is, large interspecific functional differences define the formation of functional groups (for sensitivity of FGR see Petchey & Gaston 2002Petchey OL, Gaston KJ. 2002. Functional diversity (FD), species richness and community composition. Ecology Letters 5: 402-411.). However, more functionally unique species have relatively high contributions to variation in functional diversity measured by FD and FGR, which contribute to these indices being grouped in a similar way.
Based on our results, it is not possible to recommend an index or linkage method that is more appropriate for verifying the association of functional diversity with environmental conditions. However, in this situation, we suggest that the use of cophenetic correlation (Petchey & Gaston 2007Petchey OL, Gaston KJ. 2007. Dendrograms and measuring functional diversity. Oikos 116: 1422-1426.) or consensus trees (Mouchet et al. 2008Mouchet M. Guilhaumon F, Villéger S, Mason NWH, Tomasini JA, Mouillot D. 2008. Towards a consensus for calculating dendrograma-based functional diversity indices. Oikos 117: 794-800.) should be adopted for the selection of a linkage method and the association of the different indices with environmental variables should be carefully considered.
In general, a consensus measure of functional diversity is not yet considered to exist (Ricotta 2005Ricotta C. 2005. A note on functional diversity measures. Basic and Applied Ecology 6: 479-486.; Maire et al. 2015Maire E, Grenouillet G, Brosse S, Villéger S. 2015. How many dimensions are needed to accurately assess functional diversity? A pragmatic approach for assessing the quality of functional spaces. Global Ecology and Biogeography 24: 728-740.). Thus, the evaluation of differences in functional diversity indexes performance is highly relevant, as is an evaluation of what different metrics are actually measuring. This study has provided a methodological approach for decomposing and mapping variation in functional diversity indices based on dendrograms and has further evaluated their relationships with environmental conditions. Although local environmental and landscape variables do not explain the differentiation among functional diversity indices, we encourage further studies using different taxa and spatial scales to adopt this approach. For example, at large scales it is possible to investigate variation in functional diversity indices in relation to environmental gradients and climatic and historical effects. Furthermore, this methodology can be tested in other communities with different richness levels or in relation to other facets of functional diversity, or include the variation generated by intraspecific variability (e.g., Cianciaruso et al. 2009Cianciaruso MV, Batalha MA, Gaston KJ, Petchey OL. 2009. Including intraspecific variability in functional diversity. Ecology 90: 81-89.), missing data or trait transformations (e.g., Májeková et al. 2016Májeková M, Nichola TP, Plowman S, et al. 2016. Evaluating functional diversity: missing trait data and the importance of species abundance structure and data transformation. Plos One 11(3): e0152532. DOI: 10.1371/journal.pone.0149270.
https://doi.org/10.1371/journal.pone.014...
).
For the natural phytoplankton communities in the studied floodplain lakes, the linkage method was less important for functional diversity values. Thus, the most important criterion is the choice of index. In summary, the identification of a perfect functional diversity metric is a task that is far from complete, because each one expresses functional diversity differently (i.e., mathematically and methodologically). Nevertheless, approaches that measure variation of indices may be useful due to the great number of metrics that continue to arise and the increasing need for consolidation of functional diversity concepts
Acknowledgements
We thank the anonymous reviewers for criticisms that improved the manuscript; to Conselho Nacional de Desenvolvimento Científico e Tecnológico (CNPq) and Fundação de Amparo a Pesquisa do Estado de Goiás (FAPEG) for research funding (Process 563834/2010-2). This research was supported by INCT EECBIO (Ecologia, Evolução e Conservação da Biodiversidade). KBM thanks Coordenação de Aperfeiçoamento de Pessoal de Nível Superior (CAPES) for Masters and Doctoral scholarships. FBT and JCN receive research grants from CNPq (302158/2015 and 306719/2013-4)
References
- Anderson MJ, Crist TO, Chase JM, et al . 2011. Navigating the multiple meanings of ß diversity: a roadmap for the practicing ecologist. Ecology Letters 14: 19-28.
- Best RJ, Caulk NC, Stachowicz JJ . 2013. Trait vs. Phylogenetic diversity as predictors of competition and community composition in herbivorous marine amphipods. Ecology Letters 16: 72-80.
- Bihn JH, Gebauer G, Brandl R. 2010. Loss of functional diversity of ant assemblages in secondary tropical forests. Ecology 91: 782-792.
- Botta-Dukát Z. 2005. Rao´s quadratic entropy as a measure of functional diversity based on multiple traits. Journal of Vegetation Science 16: 533-540.
- Bottrell HH, Duncan A, Gliwicz ZM, et al 1976. Review of some problems in zooplankton production studies. Norwegian Journal of Zoology 24: 419-456.
- Brose U. 2003. Estimating species richness: sensitivity to sample coverage and insensitivity to special patterns. Ecology 84: 2364-2377.
- Cadotte MW, Cavender-Bares J, Tilman D, Oakley TH. 2009. Using phylogenetic, functional and trait diversity to understand patterns of plant community productivity. Plos One 4: e5695. doi.org/10.1371/journal.pone.0005695 .
» https://doi.org/10.1371/journal.pone.0005695 - Cardinale BJ, Duffy E, Gonzalez A, et al 2012. Biodiversity loss and the impact on humanity. Nature 486: 59-67.
- Carvalho RA, Tejerina-Garro FL. 2014. Environmental and spatial processes: what controls the functional structure of fish assemblages in tropical Rivers and headwater streams. Ecology of Freshwater Fish 24: 317-328.
- Carvalho RA, Tejerina-Garro FL. 2015. Relationships between taxonomic and functional components of diversity: implications for conservation of tropical freshwater fishes. Freshwater Biology 60: 1854-1862.
- Cianciaruso MV, Batalha MA, Gaston KJ, Petchey OL. 2009. Including intraspecific variability in functional diversity. Ecology 90: 81-89.
- Cianciaruso MV, Batalha MA, Gaston KJ, Petchey OL. 2012. The influence of fire on phylogenetic and functional structure of woody savannas: moving from species to individuals. Perspectives and Plant Ecology, Evolution and Systematics 14: 205-216.
- Colzani E, Siqueira T, Suriano MT, Roque FB . 2013. Responses of aquatic insect functional diversity to landscape changes in Atlantic Forest. Biotropica 45: 343-350.
- Coyle JR, Halliday FW, Lopez BE, Palmquist KA, Wilfahrt PA, Hurlbert AH. 2014. Using trait and phylogenetic diversity to evaluate the generality of the stress-dominance hypothesis in eastern North American tree communities. Ecography 37: 814-826.
- Díaz S, Cabido M. 2001. Vive La différence: plant functional diversity matters to ecosystem process. Trends in Ecology and Evolution 16: 646-655.
- Díaz S, Lavorel S, Chapin FS, Tecco PA, Gurvich DE, Grigulis K. 2007. Functional diversity - at the crossroads between ecosystem functioning and environmental filters. In: Canadell JG, Pataki D, Pitelka L. (eds.) Terrestrial ecosystems in changing world. Berlin, Springer-Verlag. p. 81-91.
- Diniz-Filho JAF, Bini LM, Rangel TF, et al 2009. Partitioning and mapping uncertainties in ensembles of forecasts of species turnover under climate change. Ecography 32: 897-906.
- Dunck B, Rodrigues L, Bicudo DC. 2015. Functional diversity and functional traits of periphytic algae during a short-term successional process in a Neotropical floodplain lake. Brazilian Journal of Biology 75: 587-597.
- Fontana S, Petchey OL, Pomati F. 2016. Individual-level trait diversity concepts and indices to comprehensively describe community change in multidimensional trait space. Functional Ecology 30: 808-818.
- Heemsbergen DA, Berg MP, Loreal M, Hal JR, Faber JH, Verhoef HA. 2004. Biodiversity effects on soil processes explained by interspecific functional dissimilarity biodiversity. Science 306: 1019-1020.
- Heino J. 2010. Are indicator groups and cross-taxon congruence useful for predicting biodiversity in aquatic ecosystems? Ecological Indicators 10: 112-117.
- Hejda M, de Bello F. 2013. Impact of plant invasions on functional diversity in the vegetation of Central Europe. Journal of Vegetation Science 24: 890-897.
- Hidasi-Neto J, Barlow J, Cianciaruso MV. 2012. Bird functional diversity and wildfires in the Amazon: the role of Forest structure. Animal Conservation 15:407-415.
- Hillebrand H, Dürselen CD, Kirschtel D, Pollingher U, Zohary T. 1999. Biovolume calculation for pelagic and benthic microalgae. Journal of Phycology 35:403-424.
- Huszar VLM, Nabout JC, Appel MO, Santos JBO, Abe DS, Silva LH. 2015. Environmental and not spatial process (directional and non-directional) shape the phytoplankton composition and functional groups in a large subtropical river basin. Journal of Plankton Research 37: 1190-1200.
- Kembel SW, Cowan PD, Helmus MR, et al 2010. Picante: R tools for integrating phylogenies and ecology. Bioinformatics 26: 1463-1464.
- Kembel SW, Ackerly DD, Blomberg SP, et al 2014. Picante: R tools for integrating phylogenies and ecology. R package version 1.6-2. https://cran.r-project.org/web/packages/picante/picante.pdf. 14 Dec. 2015
» https://cran.r-project.org/web/packages/picante/picante.pdf. - Kruk C, Huszar VLM, Bonilla S, Costa L, Lurling M, Reynolds CS, et al 2010. A morphological classification capturing functional variation in phytoplankton. Freshwater Biology 55: 614-627.
- Laliberté E, Legendre P. 2010. A distance-based framework for measuring functional diversity from multiple traits. Ecology 91: 299-305.
- Legendre P. Legendre L. 1998. Numerical Ecology. Amsterdam, E lsevier Science.
- Machado KB, Borges PP, Carneiro FM, et al 2015. Using lower taxonomic resolution and ecological approaches as a surrogate for plankton species. Hydrobiologia 743: 255-267.
- Machado KB, Teresa FB, Vieira LCG, Huszar VLM, Nabout JC. 2016. Comparing the effects of landscape and local environmental variables on taxonomic and functional composition of plankton communities. Journal of Plankton Research 38: 1334-1346.
- Maire E, Grenouillet G, Brosse S, Villéger S. 2015. How many dimensions are needed to accurately assess functional diversity? A pragmatic approach for assessing the quality of functional spaces. Global Ecology and Biogeography 24: 728-740.
- Májeková M, Nichola TP, Plowman S, et al 2016. Evaluating functional diversity: missing trait data and the importance of species abundance structure and data transformation. Plos One 11(3): e0152532. DOI: 10.1371/journal.pone.0149270.
» https://doi.org/10.1371/journal.pone.0149270 - Mason NWH, Mouillot D, Lee WG, Wilson JB. 2005. Functional richness, functional evenness and functional divergence: the primary components of functional diversity. Oikos 111: 112-118.
- Mayfield MM, Levine JM. 2010. Opposing effects of competitive exclusion on the phylogenetic structure of communities. Ecology Letters 13: 1085-1093.
- Merigot B, Durbec JP, Gaertner JC. 2010. On goodness-of-fit measure dendrograma-based analyses. Ecology 91: 1850-1859.
- Mouchet M. Guilhaumon F, Villéger S, Mason NWH, Tomasini JA, Mouillot D. 2008. Towards a consensus for calculating dendrograma-based functional diversity indices. Oikos 117: 794-800.
- Mouchet MA, Villéger S, Mason NWH, Mouillot D. 2010. Functional diversity measures: an overview of their redundancy and their ability to discriminate community assembly rules. Functional Ecology 24: 867-876.
- Mouillot D, Dumay O, Tomasini JA. 2007. Limiting similarity, niche filtering and functional diversity in coastal lagoon fish communities. Estuarine, Coastal and Shelf Sciences 71: 443-456.
- Nabout JC, Nogueira IS, Oliveira LG. 2006. Phytoplankton community of floodplain lakes of the Araguaia River, Brazil, in the rainy and dry seasons. Journal of Plankton Research 28: 181-193.
- Nabout JC, Nogueira IS, Oliveira LG, Morais RR. 2007. Phytoplankton diversity (alpha, beta, and gama) from the Araguaia River tropical floodplain lakes (central Brazil). Hydrobiologia 557: 455-461.
- Nabout JC, Siqueira T, Bini LM, Nogueira IS. 2009. No evidence for environmental and spatial process in structuring phytoplankton communities. Acta Oecologica 35: 720-726.
- Oksanen J, Blanchet G, Roeland K, et al 2015. Vegan: Community Ecology Package. R package version 2.3-2. http://cran.r-project.org/web/packages/vegan/vegan.pdf 14 Dec. 2015.
» http://cran.r-project.org/web/packages/vegan/vegan.pdf - Pakeman RJ. 2011. Functional diversity indices reveal the impacts of land use intensification on plant community assembly. Journal of Ecology 99: 1143-1151.
- Pavoine S, Bonsall MB. 2011. Measuring biodiversity to explain community assembly: a unified approach. Biological Reviews 86: 792-812.
- Pavoine S, Vallet J, Dufor AB, Gachet S, Daniel H. 2009. On the challenge of treating various types of variables: application for improving the measurement of functional diversity. Oikos 118: 391-402.
- Petchey OL, Gaston KJ. 2002. Functional diversity (FD), species richness and community composition. Ecology Letters 5: 402-411.
- Petchey OL , Gaston, KJ. 2006. Functional diversity: back to basics and looking forward. Ecology Letters 9: 741-758.
- Petchey OL, Gaston KJ. 2007. Dendrograms and measuring functional diversity. Oikos 116: 1422-1426.
- Petchey OL, Gaston KJ, 2009. Dendrograms and measures of functional diversity: a second installment. Oikos 118: 1118-1120.
- Petchey OL, Gorman EJO, Flynn DFB. 2009. A functional guide to functional diversity measures. In: Naeem S, Bunker DE, Hector A, Loreau M, Perrings C. (eds.) Biodiversity, ecosystem functioning and human wellbeing: An ecological and economic perspective. Oxford, Oxford University Press. p. 49-59.
- Petchey OL, Hector A, Gaston KJ. 2004. How different measures of functional diversity perform? Ecology 85: 847-857.
- Pillar VD. 1999. On the identification of optimal plant functional types. Journal of Vegetation Science 10: 631-640.
- Pillar VP, Sosinski Junior EE. 2003. An improved method for searching plants functional types by numerical analysis. Journal of Vegetation Science 14: 323-332.
- Pla L, Casanoves F, Di Rienzo J. 2012. Functional Groups. In: Pla L, Casanoves F, Di Rienzo J. (eds.) Quantifying Functional Biodiversity. Dordrecht, Springer p. 9-25.
- Podani J, Schmera D. 2006. On dendrograma-based measures of functional diversity. Oikos 115: 179-185.
- Podani J, Schmera D. 2007. How should a dendrograma-based measure of functional diversity function? A rejoinder to Petchey and Gaston. Oikos 116: 1427-1430.
- Poos MS, Walker SC, Jackson DA. 2009. Functional-diversity indices can be driven by methodological choices and species richness. Ecology 90: 341-347.
- R Core Team. 2015. R: A language and environment for statistical computing. R Foundation for Statistical Computing, Vienna, Austria. https://www.r-project.org/. 14 Dec. 2015.
» https://www.r-project.org - Rangel TF, Diniz-Filho JAF, Bini LM. 2010. SAM: a comprehensive application for Spatial Analysis in Macroecology. Ecography 31:46-50.
- Rao CR. 1982. Diversity and dissimilarity coefficients: a unified approach. Theorical Population Biology 21: 24-43.
- Reynolds CS. 2006. Ecology of phytoplankton. Cambridge, Cambridge University Press.
- Ricotta C. 2005. A note on functional diversity measures. Basic and Applied Ecology 6: 479-486.
- Rodríguez D, Ojeda RA. 2014. Scaling functional diversity of mammals in desert systems. Journal of Zoology 293: 262-270.
- Schleuter D, Daufresne M, Massol F, Argillier C. 2010. A user`s guide to functional diversity indices. Ecological Monographs 80: 469-484.
- Schmera D, Erös T, Podani J. 2009. A measure for assessing functional diversity in ecological communities. Aquatic Ecology 43: 157-167.
- Sobral FL, Cianciaruso MV. 2015. Functional and phylogenetic structure of forest and savanna bird assemblages across spatial scales. Ecography 39: 533-541.
- Swenson NG. 2014. Functional and phylogenetic ecology in R. New York, Springer.
- Tabachnick BG, Fidell LS. 1989. Using multivariate statistics. New York, Harper & Row.
- Teresa FB, Casatti L. 2017. Trait-based metrics as bioindicators: Responses of stream fish assemblages to a gradient of environmental degradation. Ecological Indicators 75: 249-258.
- Teresa FB, Casatti L, Cianciaruso MV. 2015. Functional differentiation between fish assemblages from forested and deforested streams. Neotropical Ichthyology 13: 361-370.
- Tessarolo G, Rangel TF, Aráujo MB, Hortal J. 2014. Uncertainty associated with survey design in species distribution models. Diversity and Distributions 20: 1258-1269.
- Thomaz SM, Bini LM, Bozelli RL. 2007. Floods increase similarity among aquatic habitats in river-floodplain systems. Hydrobiologia 579: 1-13.
- Tilman D. 2001. Functional diversity. In: Levin SA. (ed.) Encyclopedia of Biodiversity. San Diego, Academic Press. p. 109-120.
- Tucker CM, Cadotte MW, Carvalho SB, et al 2017. A guide to phylogenetic metrics for conservation, community ecology and macroecology. Biological Reviews 92: 698-715.
- Villéger S, Mason NWH, Mouillot D. 2008. New multidimensional functional diversity indices for a multifaceted framework in functional ecology. Ecology 89: 2290-2301.
- Vollenweider RA. 1974. A manual on methods for measuring primary production in aquatic environments. London, Blackwell Scientific Publications.
- Walker BH, Kinzig A, Langridge J. 1999. Plant attribute diversity, resilience and ecosystem function: the nature and significance of dominant and minor species. Ecosystems 2: 95-113.
- Webb CO. 2000. Exploring the phylogenetic structure of ecological communities: an example for rain forest trees. American Naturalist 156: 145-155.
- Weithoff G. 2003. The concepts of “plant functional types” and “functional diversity” in lake phytoplankton - a new understanding of phytoplankton ecology? Freshwater Biology 48: 1669-1675.
- Zagatto EAG, Jacintho AO, Reis BF, et al 1981 Manual de análises de plantas empregando sistemas de injeção em fluxo. Piracicaba, Universidade de São Paulo.
- Zar JH. 2010. Biostatistical Analysis. New Jersey, Pearson Print Hall.
Publication Dates
-
Publication in this collection
21 Sept 2017 -
Date of issue
Oct-Dec 2017
History
-
Received
16 Jan 2017 -
Accepted
29 May 2017