Abstract
This work presents the development of a composite Index of Susceptibility to Drought (ISD) for semiarid Brazilian Northeast that considers climatology, physical properties, soil usage, social and economic aspects, the risk of harvest losses and the shortage of human and animal drinking water. The index started with the Index FUNCEME of drought Severity (IFS), developed by FUNCEME. Then, it evolved to use some tools proposed by the Joint Research Centre/Organization for Economic Co-operation and Development (JRC/OECD), as well as techniques of multiple imputation for missing data and data winsorization. The work was tested and validated with real data from Rio Grande do Norte State in three climatologic scenarios (dry, regular and rainy). A multivariate analysis test and a Monte Carlo simulation were also produced for a sensibility and strength analysis of the developed model. These analyses validated the composition model and the obtained results with real data. The ISD can be used as a tool to support decision makers in various government levels to help guide the actions for the drought-affected areas.
Keywords:
drought index; composite indicators; Semiarid Brazilian Northeast
Resumo
Esse trabalho teve como objetivo o desenvolvimento de um Índice de Susceptibilidade ao Fenômeno da Seca (ISFS) para o semiárido nordestino brasileiro, que considera além da climatologia, aspectos da natureza física e uso dos solos, aspectos econômicos, sociais e os riscos de perda da safra agrícola e de falta de água para consumo humano e animal. O índice foi desenvolvido tendo como base o Índice FUNCEME de Severidade de seca (IFS) e foi elaborado usando ferramentas propostas pelo Joint Research Centre/Organization for Economic Co-operation and Development (JRC/OECD), e usando também técnicas de preenchimento de dados com falhas e winsorização. Ele foi testado e validado com os dados reais do Estado do Rio Grande do Norte em três cenários climatológicos (ano seco, normal e chuvoso). Foram realizados também um teste de análise multivariada e uma simulação de Monte Carlo para a análise de sensibilidade e robustez do modelo desenvolvido, cujos resultados validaram a sua composição e os resultados obtidos com dados reais. O ISFS pode ser utilizado como uma ferramenta de auxílio aos decisores, em vários níveis governamentais, para orientar as ações de socorro às áreas atingidas pela seca.
Palavras-chave:
índice de seca; indicadores compostos; Semiárido Nordestino
1. Introduction
The phenomenon of drought is characterized by the partial or total absence of rain or by its irregular distribution. Drought is cyclic and occurs more often in and is characteristic of semiarid regions around the world, even though it may also happen in regions with higher levels of precipitation. Compared with other natural disasters, such as floods, earthquakes and hurricanes, the impacts of drought are silent but no less severe due to the combination of slow effects, periodicity, political assistance measures that keep local populations dependent on governmental aid and worker migration to areas with higher economical flux, which creates several social problems such as increase of population living in slums in large cities. Thus, the severity of a drought is not only associated with environmental aspects, the scarcity of water, and limiting ecological factors for plants, animals and humans but also the social, economic and cultural conditions of the affected populations. (Dantas, 1961DANTAS, J.A. Homens e fatos do Seridó Antigo. Garanhuns: Gráfica do “O Monitor”, 1961. 168 p.; Guerra, 1981GUERRA, P.B.A civilização da seca. Fortaleza, DNOCS, 1981. 324 p.; Duarte, 2002DUARTE, R.S. A seca de 1958: uma avaliação pelo ETENE. Fortaleza: Banco do Nordeste; Recife: Fundação Joaquim Nabuco, 2002. 200 p. (Série Estudos sobre as Secas no Nordeste, 1).; Freitas, 2005FREITAS, M.A.S. Um sistema de suporte à decisão para o monitoramento de secas meteorológicas em regiões semiáridas. Revista Tecnologia, v. Suplem, p. 84-95, 2005.).
In Brazil, the Northeast Semiarid region is the region most affected by drought, with the first historical record of this phenomenon occurring in the XVI century (Dantas, 1961DANTAS, J.A. Homens e fatos do Seridó Antigo. Garanhuns: Gráfica do “O Monitor”, 1961. 168 p.; Guerra, 1981GUERRA, P.B.A civilização da seca. Fortaleza, DNOCS, 1981. 324 p.; Carvalho, 1988CARVALHO, O. A economia política do Nordeste (seca, irrigação e desenvolvimento). Rio de Janeiro-RJ: Editora Campus, 1988. 505 p.). Since then, droughts have been repeatedly recorded in the region, with harmful effects, particularly on agriculture, livestock and the water supply of urban and rural populations (Dantas, 1961DANTAS, J.A. Homens e fatos do Seridó Antigo. Garanhuns: Gráfica do “O Monitor”, 1961. 168 p.; Guerra, 1981GUERRA, P.B.A civilização da seca. Fortaleza, DNOCS, 1981. 324 p.; Duarte, 2002DUARTE, R.S. A seca de 1958: uma avaliação pelo ETENE. Fortaleza: Banco do Nordeste; Recife: Fundação Joaquim Nabuco, 2002. 200 p. (Série Estudos sobre as Secas no Nordeste, 1).; Moreira Filho, 2002MOREIRA FILHO, J.C. A seca de 1993: crônica de um Flagelo anunciado. Fortaleza: Banco do Nordeste; Recife: Fundação Joaquim Nabuco, 2002. 138 p. (Série Estudos sobre as Secas no Nordeste; v. 4); Pessoa, 2002PESSOA, D.M. Caráter e efeito da seca nordestina de 1970. Fortaleza: Banco do Nordeste; Recife: Fundação Joaquim Nabuco, 2002. 302 p. (Série Estudos sobre as Secas no Nordeste; v. 2).; Freitas, 2005FREITAS, M.A.S. Um sistema de suporte à decisão para o monitoramento de secas meteorológicas em regiões semiáridas. Revista Tecnologia, v. Suplem, p. 84-95, 2005.). The main meteorological phenomenon associated with drought occurrences in the Northeast Semiarid region is the El-Niño Southern Oscillation (ENSO) (Nobre and Melo, 2004NOBRE, P.; MELO, A.B.C. Variabilidade climática intrasazonal sobre o Nordeste do Brasil em 1998-2000. Revista Climanálise, ano 2, n. 1, 2004.; Araújo et al., 2008ARAÚJO, L.E.; SOUZA, F.A.S.; RIBEIRO, M.A.F.M.; SANTOS, A.S.; MEDEIROS, P.C. Análise estatística de chuvas intensas na bacia hidrográfica do Rio Paraíba. Revista Brasileira de Meteorologia, v. 23, n. 2, p. 162-169, 2008.). The ENSO has caused droughts in the Brazilian Northeast and in many regions around the world in addition to floods in other regions, such as the Southern and Southeastern regions of Brazil. During the ENSO-positive phase, the Northeast Semiarid region experiences a seasonal decrease in rains and consequently an increase in drought intensity (Alves et al., 1998ALVES, J.M.B.; CAMPOS, J.N.B.; SOUZA, E.B.; REPELLI, C.A. Produção agrícola de subsistência no Estado do Ceará com ênfase aos anos de ocorrência de El Niño e La Niña. Revista Brasileira de Agrometeorologia, v. 6, n. 2, p. 249-256, 1998.; Brunini et al., 2005BRUNINI, O.; DIAS, P.L.S.; GRIMM, A.M.; ASSAD, E.D.; BOKEN, V.K. Agricultural drought phenomenon in Latin America with focus on Brazil. In: BOKEN, V.K.; CRACKNELL, A.P.; HEATCOTE, R.L. Monitoring and predicting agricultural drought: A global study. New York, Oxford University Press. pp. 156-168, 2005.; Andreoli and Kayano, 2007ANDREOLI, R.V.; KAYANO, M.T. A importância relativa do Atlântico tropical sul e Pacífico leste na variabilidade de precipitação do nordeste do Brasil. Revista Brasileira de Meteorologia, v. 22, n. 1, p. 63-74, 2007.; Mendonça and Danni-Oliveira, 2007MENDONÇA, F.; DANNI-OLIVEIRA, I.M. Climatologia: Noções básicas e climas do Brasil. São Paulo: Oficina de Textos, 2007. 206 p.; Araújo et al., 2008ARAÚJO, L.E.; SOUZA, F.A.S.; RIBEIRO, M.A.F.M.; SANTOS, A.S.; MEDEIROS, P.C. Análise estatística de chuvas intensas na bacia hidrográfica do Rio Paraíba. Revista Brasileira de Meteorologia, v. 23, n. 2, p. 162-169, 2008.; Gonzalez et al., 2013GONZALEZ, R.A.; ANDREOLI, R.V.; CANDIDO, L.A.; KAYANO, M.T.; SOUZA, R.A.F. A influência do evento El Niño-Oscilação sul e Atlântico equatorial na precipitação sobre as regiões norte e nordeste da América do Sul. Acta Amazonica (Impresso), v. 43, p. 469-480, 2013.; Kayano et al., 2013KAYANO, M.T.; ANDREOLI, R.V.; SOUZA, R.A.F. Relations between ENSO and the South Atlantic SST modes and their effects on the South American rainfall. International Journal of Climatology, v. 33, p. 2008-2023, 2013.; Kayano and Capistrano, 2014KAYANO, M.T.; CAPISTRANO, V.B. How the Atlantic multidecadal oscillation (AMO) modifies the ENSO influence on the South American rainfall. International Journal of Climatology, v. 34, p. 162-178, 2014.).
Even disregarding the ENSO, still the Tropical Atlantic (TA) has influenced the variability of precipitation in the Brazilian Northeast, due to the anomalies of Sea Surface Temperature (SST). The SST's influence is more remarkable in the Tropical South Atlantic (TSA) than in the Tropical North Atlantic (TNA). Researchers have demonstrated that when the SST's anomalies show balanced values, but with signs TSA and TNA opposing each other, the precipitation's anomalies are more pronounced in the Brazilian Northeast. Nevertheless, the probability of these events occur without the ENSO's influence is somewhere around 12% (Andreoli and Kayano, 2007ANDREOLI, R.V.; KAYANO, M.T. A importância relativa do Atlântico tropical sul e Pacífico leste na variabilidade de precipitação do nordeste do Brasil. Revista Brasileira de Meteorologia, v. 22, n. 1, p. 63-74, 2007.; Gonzalez et al., 2013GONZALEZ, R.A.; ANDREOLI, R.V.; CANDIDO, L.A.; KAYANO, M.T.; SOUZA, R.A.F. A influência do evento El Niño-Oscilação sul e Atlântico equatorial na precipitação sobre as regiões norte e nordeste da América do Sul. Acta Amazonica (Impresso), v. 43, p. 469-480, 2013.).
Another issue to be considered is the impact of global climate change. Studies have shown that for the Brazilian Northeast is expected a reduction in rainfall with a consequent increase in periods of drought accompanied by an increase in temperature in the range of 3 to 5.5 °C, for the worst case scenario projected by the Intergovernmental Panel on Climate Change (IPCC) until the end of this century. Should this scenario occur disastrous consequences in food production will follow, causing food insecurity due to the decrease of subsistence farming in the region (Marengo, 2006INSTITUTO BRASILEIRO DE GEOGRAFIA E ESTATÍSTICA. Censo agropecuário – 2006: Resultados Preliminares. Rio de Janeiro, 2006. 146 p.; Angelotti; Sá; Melo, 2009ANGELOTTI, F.; SÁ, I.B.; MELO, R.F. Mudanças climáticas e desertificação no semiárido brasileiro. In: ANGELOTTI, F.; SÁ, I.B.; MENEZES, E.A.; PELLEGRINO, G.Q. Mudanças climáticas e desertificação no semiárido brasileiro. Petrolina, PE: Embrapa Semiárido; Campinas, SP: Embrapa Informática Agropecuária, 2009. cap. 3. p. 41-49.; PBMC, 2013PAINEL BRASILEIRO DE MUDANÇAS CLIMÁTICAS (PBMC). Contribuição do grupo de trabalho 2 ao primeiro relatório de avaliação nacional do Painel Brasileiro de Mudanças Climáticas. Sumário executivo do GT2. PBMC, Rio de Janeiro. 2013. 28 p.).
In recent years, significant progress has been made in the monitoring of climatic events in the Northeast Semiarid region. An example of this is the climatic and weather monitoring accomplished by the Center for Weather Forecasting and Climate Studies/ National Institute for Space Research - CPTEC/INPE (http://www.cptec.inpe.br), with its northeastern climatic regional centers, among them the Meteorology Foundation of Ceará State (FUNCEME) (http://funceme.br). A service resulting from this monitoring is the drought-occurrence forecast. This forecast allows the executive governmental sphere to plan actions to mitigate the effects of droughts, which typically only occur when the drought has already been completely established, farming is in decline, and the population is in a state of calamity, suffering shortages of water even for basic human consumption.
Drought forecasting is also realized through the use of drought indexes, which are tools that trace relevant information using aggregation, quantification and simplification to understand the phenomenon. In short, drought indexes are essential tools for facilitating a more precise diagnosis of drought magnitude in the affected regions, and several models of evaluation exist for this purpose. Simpler drought indexes consider only meteorological and/or hydrological variables (Byun and Whilite, 1999BYUN, H.; WILHITE, D.A. Objective quantification of drought severity and duration. Journal of Climate, v. 12, p. 2747-2756, 1999.). The most sophisticated indexes also associate the precipitation level to economic, social, cultural, environmental and political parameters of the affected regions (Byun and Wilhite, 1999BYUN, H.; WILHITE, D.A. Objective quantification of drought severity and duration. Journal of Climate, v. 12, p. 2747-2756, 1999.; Pandey et al., 2010PANDEY, C.B.; SINGH, G.B.; SINGH, S.K.; SINGH, R.K. Soil nitrogen and microbial biomass carbon dynamics in native forests and derived agricultural land uses in a humid tropical climate of India. Plant and Soil, v. 33, n. 3, p. 453-467, 2010.; Magalhães and Martins, 2011MAGALHÃES, A.R.; MARTINS, E.S. Drought and drought policy in Brazil. In: SIVAKUMAR, M.V. K.; MOTHA, R.P.; WILHITE, D.A.; QU, J.J. (Eds.). Towards a Compendium on National Drought Policy. Proceedings of an Expert Meeting, july 14-15, 2011, Washington DC, USA: Geneva, Switzerland: World Meteorological Organization. AGM-12; WAOB-2011. p. 57-67.). This is the case with the Index FUNCEME of drought Severity (IFS), developed in 2000 by FUNCEME (Ensslin et al., 2000ENSSLIN, L.; ENSSLIN, S.R.; NORONHA, S.M.D.; PETRI, S.M. Elaboração de um índice de severidade de seca para o Ceará utilizando-se uma metodologia de apoio à decisão (MCDA). In: XXXII SIMPÓSIO BRASILEIRO DE PESQUISA OPERACIONAL, 1, 2000, Viçosa, MG. Anais… Viçosa: Sociedade Brasileira de Pesquisa Operacional, 2000. pp. 1147-1164.; FUNCEME, 2000FUNDAÇÃO CEARENSE DE METEOROLOGIA. Manual do índice FUNCEME de severidade de seca. Fortaleza, 2000. 278 p.; Silvia and Forte, 2002SILVA, J.S.V., FORTE, S.H.A.C. Uma contribuição nas decisões emergenciais da gestão pública em regiões semiáridas. Revista Econômica do Nordeste, v. 33, n 4, p. 176, 2002.). The IFS considers climatology, physics, social and economic aspects, risk of harvest loss and the rural and urban water supply status of affected cities (Ensslin et al., 2000ENSSLIN, L.; ENSSLIN, S.R.; NORONHA, S.M.D.; PETRI, S.M. Elaboração de um índice de severidade de seca para o Ceará utilizando-se uma metodologia de apoio à decisão (MCDA). In: XXXII SIMPÓSIO BRASILEIRO DE PESQUISA OPERACIONAL, 1, 2000, Viçosa, MG. Anais… Viçosa: Sociedade Brasileira de Pesquisa Operacional, 2000. pp. 1147-1164.; FUNCEME, 2000FUNDAÇÃO CEARENSE DE METEOROLOGIA. Manual do índice FUNCEME de severidade de seca. Fortaleza, 2000. 278 p.; Silvia and Forte, 2002SILVA, J.S.V., FORTE, S.H.A.C. Uma contribuição nas decisões emergenciais da gestão pública em regiões semiáridas. Revista Econômica do Nordeste, v. 33, n 4, p. 176, 2002.). However, most likely due to its complex data structure and operational difficulty, this index has not been deployed and has remained a mere prototype.
Other sample is the index named Municipality Watch Index (MWI) that is calculated by the Institute for Research and Economic Strategy of Ceará (www.ipece.ce.gov.br). It is calculated since 2004 and measures the vulnerability y of each of the 184 municipalities of the state in relation to climatic and agricultural issues. It considers 12 indicators: 1. Agricultural productivity per hectare; 2. Agricultural production per capita; 3. Use of harvested area with subsistence farming; 4. Crop shortfall; 5. Proportion of families benefiting from “Bolsa Família” (a cash transfer program to poor families); 6. Number of “Seguro Safra” (crop insurance) per 100 rural residents; 7.Climatology; 8.Standard deviation of rainfall; 9.Runoff; 10.Rainfall distribution index; 11.Aridity index; 12.Coverage rate of urban water supply (Neves, 2010NEVES, J.A. Um índice de susceptibilidade ao fenômeno da seca para o semiárido nordestino. 2010. 399 p. Tese (Doutorado em Matemática Computacional) - Universidade Federal de Pernambuco, Recife, 2010.; Magalhães and Martins, 2011MAGALHÃES, A.R.; MARTINS, E.S. Drought and drought policy in Brazil. In: SIVAKUMAR, M.V. K.; MOTHA, R.P.; WILHITE, D.A.; QU, J.J. (Eds.). Towards a Compendium on National Drought Policy. Proceedings of an Expert Meeting, july 14-15, 2011, Washington DC, USA: Geneva, Switzerland: World Meteorological Organization. AGM-12; WAOB-2011. p. 57-67.). All sub-indicators have an equal weight in the composite index, however its application until now has been limited to the state of Ceará (Neves, 2010NEVES, J.A. Um índice de susceptibilidade ao fenômeno da seca para o semiárido nordestino. 2010. 399 p. Tese (Doutorado em Matemática Computacional) - Universidade Federal de Pernambuco, Recife, 2010.).
The drought phenomenon's inherent complexity implies that a single index hardly would be suitable because it cannot summarize all the factors involved in drought events. Complex indices should produce superior results and more appropriate answers for the mitigation of the drought impact and improved preparation strategies (Smakhtin and Huges, 2004SMAKHTIN, V. U.; HUGHES, D.A. Review, automated estimation and analyses of drought indices in South Asia. Working Paper 83. Colombo, Sri Lanka: International Water Management Institute, 2004.).
The necessity for the development of more indexes with data and accessible information, deployed in user-friendly software to facilitate its implementation to clarify drought phenomenon in the Northeast Semiarid region is clear. Such indexes could become a valuable tool to aid decision makers in fund allocation as well as directing effective actions to confront the effects of drought.
In this context, this work describes the Index of Susceptibility to Drought (ISD) for the Brazilian semiarid region that was subject of a doctoral thesis developed by Neves (2010)NEVES, J.A. Um índice de susceptibilidade ao fenômeno da seca para o semiárido nordestino. 2010. 399 p. Tese (Doutorado em Matemática Computacional) - Universidade Federal de Pernambuco, Recife, 2010. and that considers climatology, the aspects of physical nature and the land usage, economics, social factors, the risk of harvest losses and shortages of human and animal drinking water at the local level. The ISD was developed from IFS and evolved by using some tools proposed by the Joint Research Center of the European Commission/Organization for Economic Co-operation and Development - JRC/OECD (http://www.oecd.org, Nardo et al., 2009). More details about the ISD will be presented in the methodology item.
The paper is structured as follow: Section 2 describes the material and methodology. Section 3 presents the results and discussions. Summary and concluding remarks are presented in Section 4.
2. Materials and Methods
The construction of the ISD started with the IFS (Ensslin et al.,FUNCEME, 2000FUNDAÇÃO CEARENSE DE METEOROLOGIA. Manual do índice FUNCEME de severidade de seca. Fortaleza, 2000. 278 p.; Silva and Forte, 2002SILVA, J.S.V., FORTE, S.H.A.C. Uma contribuição nas decisões emergenciais da gestão pública em regiões semiáridas. Revista Econômica do Nordeste, v. 33, n 4, p. 176, 2002.) using the same dimensions and weights or importance levels, and then it evolved by using as a methodological basis some tools for the construction of composite indicators proposed by the JRC/OECD (Nardo et al., 2009). The ISD consists of using statistical techniques of multiple imputation for missing data and data winsorization, which is defined as a statistical transformation that brings the extreme observations to μ + c (μ is the median and c ∈ ℜ). The ISD was implemented in a computer application written in the C# language for operational use. The ISD was tested and validated with real data related to the municipalities of the Rio Grande do Norte state situated in the Brazilian Northeast. It was subjected to a sensibility analysis through a Monte Carlo simulation. The analysis results validated the municipality classification obtained in the tests with real data and ensured the consistency of the weights used in its composition. Mainly, the available variants and/or alternatives that represent a qualitative improvement over the parameters originally used in the ISD as well as the information availability were considered.
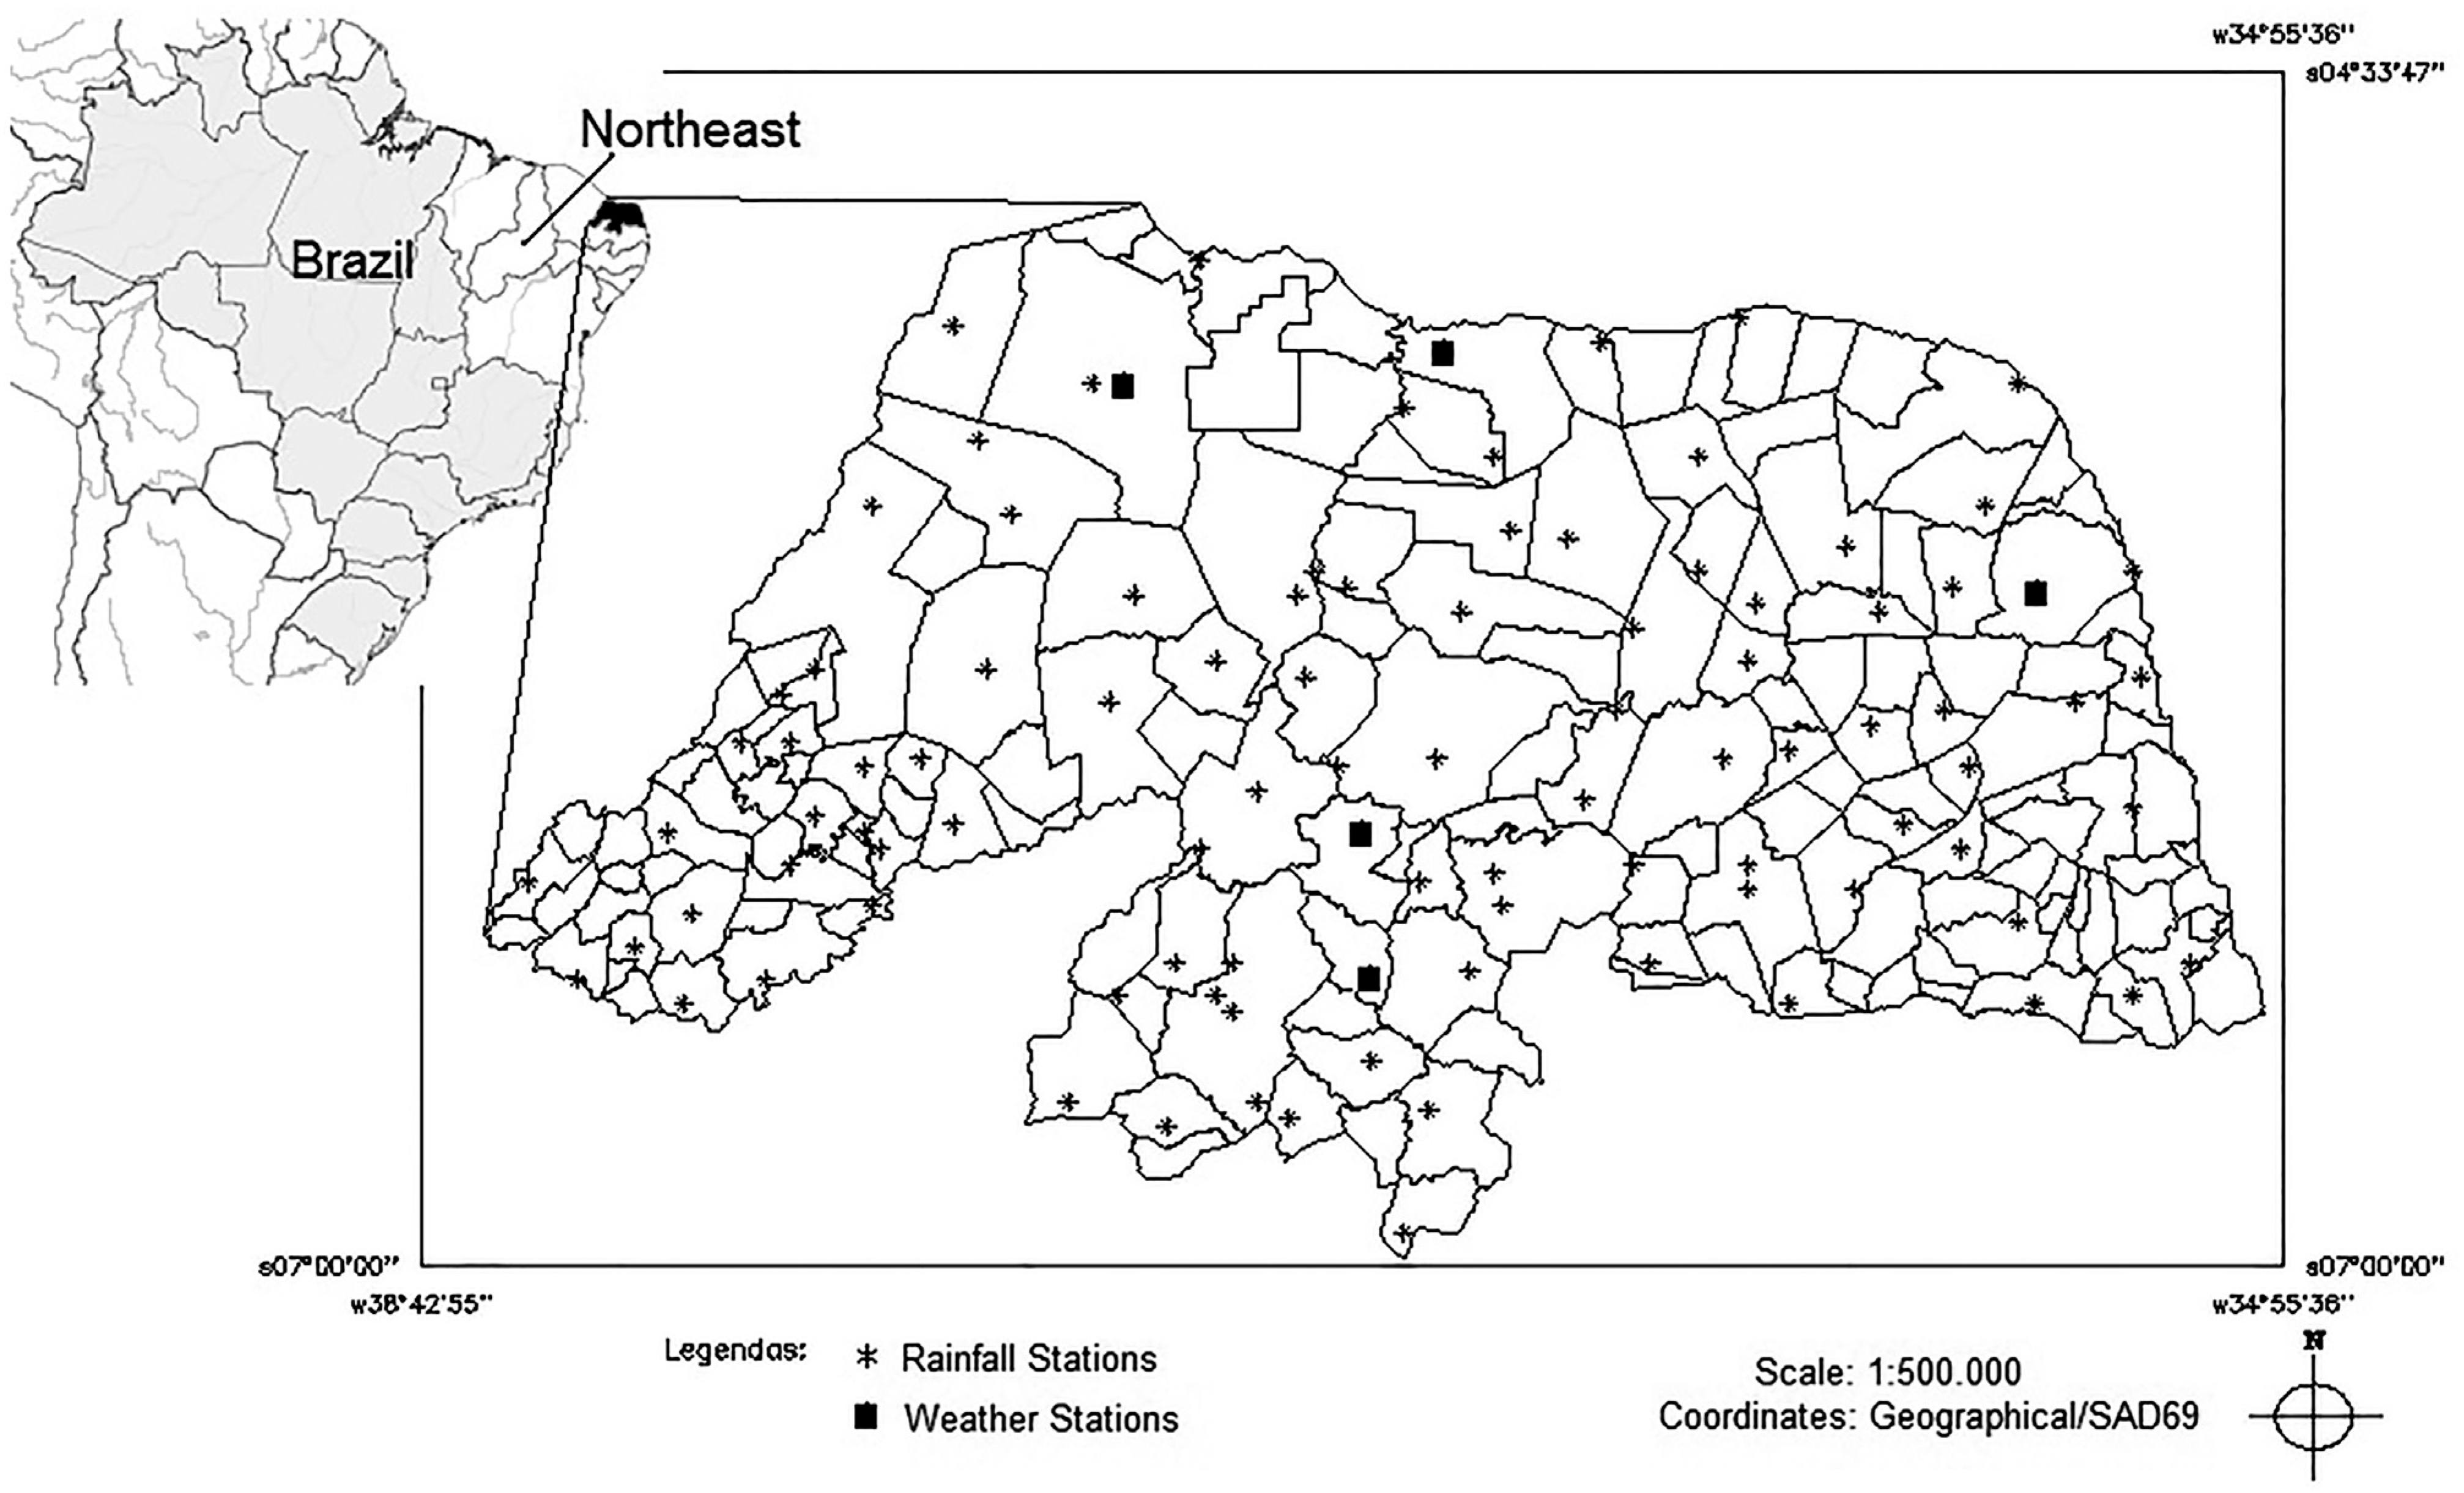
The rainfall daily data of 93 rainfall stations and five weather stations, distributed over 85 municipalities in the nineteen micro-regions of the Rio Grande do Norte State (RN), Brazil (Fig. 1), were used for obtaining the climatological normal of each of the municipalities, for the ISD validation and computation. The data used were provided by the Rio Grande do Norte Agricultural Research Company (EMPARN). The data were filtered and only those rainfall stations with at least 30 years of data were considered, totaling 93 stations in 85 municipalities out of the State's 167 municipalities.
Location of the sites (rainfall and weather stations) in Rio Grande do Norte, Brazil, used in this work.
In addition, other data sets were used, as follow: areas of fallow, permanent and temporary crops and native and planted pastures, according to the 2006 IBGE Agricultural Census; population data from the 2000 IBGE Census; rural Gross Domestic Product (GDP) and total GDP of the municipalities in the Rio Grande do Norte State (IBGE, 2005INSTITUTO BRASILEIRO DE GEOGRAFIA E ESTATÍSTICA. Produto interno bruto dos municípios: 1999-2002. Contas Nacionais, n. 14. Rio de Janeiro, 2005. 188 p.); current municipality income data from the National Treasure Secretariat – Farm Secretariat (IBGE, 2007INSTITUTO BRASILEIRO DE GEOGRAFIA E ESTATÍSTICA. Contas regionais do Brasil: 2002-2005. Contas Regionais do Brasil, n. 21. Rio de Janeiro, 2007. 110 p.); national data concerning sanitation – Ministry of Cities (www.snis.gov.br); and agricultural suitability information for RN municipalities (MA/DNPEA-SUDENE/DRN, 1971MA/DNPEA-SUDENE/DRN. Levantamento exploratório - reconhecimento de solos do Estado do Rio Grande do Norte. Recife: MA/DNPEA-SUDENE/DRN, PE, 1971. 534 p.).
The ISD validation was based on real data from Rio Grande do Norte (1963 to 2006). It was chosen four years of daily rainfall data from a series (1963 to 2006), consisting of a regular rainfall scenario (2000), two dry years (1998 and 2005) and a rainy year scenario (2006).
Finally, the results were evaluated by using multivariate analysis of the data aiming at validating the proportions of ISD components after an analysis of sensibility by using a Monte Carlo simulation. The main objective is to estimate the confidence intervals of the developed model, the stochastic dominance of the municipalities' classification and the consistency of the weights used in the building of the index. The data multivariate analysis was conducted through the application of Principal Component Analysis (PCA) in all tested years as implemented in the R's PRCOMP library.
The ISD sensibility analysis was performed by using a Monte Carlo Simulation based on Butler et al. (1997)BUTLER, J.; JIA, J.; DYER, J. Simulation techniques for the sensitivity analysis of multi-criteria decision models. European Journal of Operation Research, v. 3, p. 531-546, 1997.. Initially, the sub-indicator values that showed variation in the tested years were modeled by the generation of 5,000 simulations of those sub-indicators in the R system, by using the Mersenne Twister pseudo-random number generator. Then the statistics were computed, and boxplots together with a final graph to evaluate the stochastic dominance of the model alternatives were generated. One alternative, A, is said to stochastically dominate the classification of an alternative B in the stochastic dominance plot if B is never above or to the left of A (Butler et al., 1997BUTLER, J.; JIA, J.; DYER, J. Simulation techniques for the sensitivity analysis of multi-criteria decision models. European Journal of Operation Research, v. 3, p. 531-546, 1997.).
For the second stage, the relaxation of the ISD weights used was accomplished by using a two-step simulation approach: 1) randomization that preserves the subindicator weight order but allows different weight values, and 2) randomization that preserves the order of sub-indicator weights and maintains equal values among the original weights of some sub-indicators. The same simulation parameters were used. The same statistics, plots and graphics as used in the previous simulation were generated. This final analysis stage examined the impact of the original weight changes on the results of ISD classification in the different tested scenarios.
The R scripts used in the Monte Carlo simulation were run on a computer with a 4-GHz Core 2 Duo processor and 4 GB of RAM, and the processing time was approximately 7 min for the first simulation and 56 min for the second simulation.
2.1. The composite ISD
The ISD was built with seven sub-indicators (Fig. 2), e.g. VP11, VP12, VP21, VP22, VP131, VP132, VP133, and its meaning are shown in the Table 1. The term VP used in the codification of the sub-indicators is the abbreviation for “viewpoint”. The numbers to the right of the sub-indicators stand for their levels of importance or significance in the model.
ISD Structure. The term VP is the abbreviation for “viewpoint”. The numbers to the right of the sub-indicators indicate their levels of importance in the model.
List of indicators for drought susceptibility, respective weights and levels of importance.
The ISD is obtained by the following equation:
where = indicator value for the municipality m in period t, with m = 1, 2, .., L; L indicates the total number of municipalities, = normalized value of the sub-indicator u for the municipality m at time t, wu = weight associated with the sub-indicator u with w1 = 0.15; w2 = 0.12; w3 = 0.15; w4 = 0.12; w5 = 0.06; w6 = 0.2; w7 = 0.2.Assuming that
with = raw value of the sub-indicator u for the municipality m at time t; fu() = normalization function of the sub-indicator u.Thus, for the Rio Grande do Norte state the function f is defined as follows:
For u = 1 (VP11 sub-indicator),
where WASm = Weight (score) of the Agricultural Suitability of municipality land m; APCm = Area of Permanent Crops in the municipality m (ha); ATCm = Area of Temporary Crops in the municipality m (ha); FAm = Fallow Area in the municipality m (ha); NPAm = Native Pasture Area of the municipality m (ha); PPAm = Planted Pasture Area in the municipality m (ha).For u = 2 (VP12 sub-indicator),
- historical mean rainfall in the municipality m.
For u = 3 (VP131 sub-indicator),
= rural population of the municipality m.
For u = 4 (VP132 sub-indicator),
where the rural and total GDP(Gross Domestic Product) refer to the year preceding the calculationFor u = 5 (VP133 sub-indicator),
= current income per capita received by municipality m in the year preceding the calculation
For u = 6 (VP21 sub-indicator),
= rainfall Distribution Index (RDI) for the municipality m at time t.
and where IS = Drought index; φ1 = Number of days with rain; φ2 = Duration in days of the longest period without rain; φ3 = Number of days in the longest period of rain that did not occur in a short summer less than 15 days; Pobs = Precipitation during the period; P = Average rainfall for the period chosen for the entire state; ND = Total number of days in the period chosen for calculating the RDI.For u = 7 (VP22 sub-indicator),
where I055 = Index of total water service; I050 = Index of total linear losses; I022 = Average per capita consumption of water.Notably, the above described functions were adjusted for the Rio Grande do Norte State conditions. Thus, utilization of the ISD in another state and/or region would require adjustments of all of the functions with the exception of the VP21 sub-indicator function.
The ISD calculation occurs in a maximum of six stages (Fig. 3). When data are not missing, the procedure will be finished in a minimum of two stages. In stage one (F1), all variables of the seven sub-indicators are calculated according to the previously described equations. A sub-indicator is computed as missing when one of the variables that contribute to this sub-indicator is missing or absent. Stage two (F2) is optional; it will only be necessary if there is a sub-indicator with an asymmetry greater than or equal to two. This procedure is performed to improve the characteristics of the data distribution and to achieve the conditions of multivariate normality required by the multiple imputation data method used in the next stage. Stage three (F3) consists of multiple imputation of the missing data from the initial phase. There are three available methods for multiple imputation: Predictive Mean Matching, Bayesian Linear Regression and Markov-Chain Monte Carlo. Stage four (F4) only will occur if F2 is executed, and stage five (F5) consists of the winsorization procedure, using two allowable patterns of winsorization (5% and 10%). Finally, stage six (F6) involves the generation of the final map with the ISD results, the chart containing the municipality drought susceptibility calculations and radar graphics displaying the impact of each of the sub-indicators in the index composition.
The ISD classification is based on the quantiles of distribution of the index for the data mass of the region adjusted by the region of interest in five categories: high susceptibility (ISD > q0.85), medium-high susceptibility (q0.65 < ISD ≤ q.085), medium susceptibility (q0.35 < ISD ≤ q.065), medium-low susceptibility (q0.15 < ISD ≤ q.035), and low susceptibility (ISD ≤ q.015) (Xavier and Xavier, 1999XAVIER, T.M.B.S.; XAVIER, A.F.S. Caracterização de períodos secos ou excessivamente chuvosos no Estado do Ceará através da técnica dos quantis: 1964-1998. Revista Brasileira de Meteorologia, v. 14, n. 2, p. 63-78, 1999.). The classification data obtained after the adjustments for Rio Grande do Norte State are given in Table 2.
3. Results and Discussion
3.1. Validation of the ISD with real data
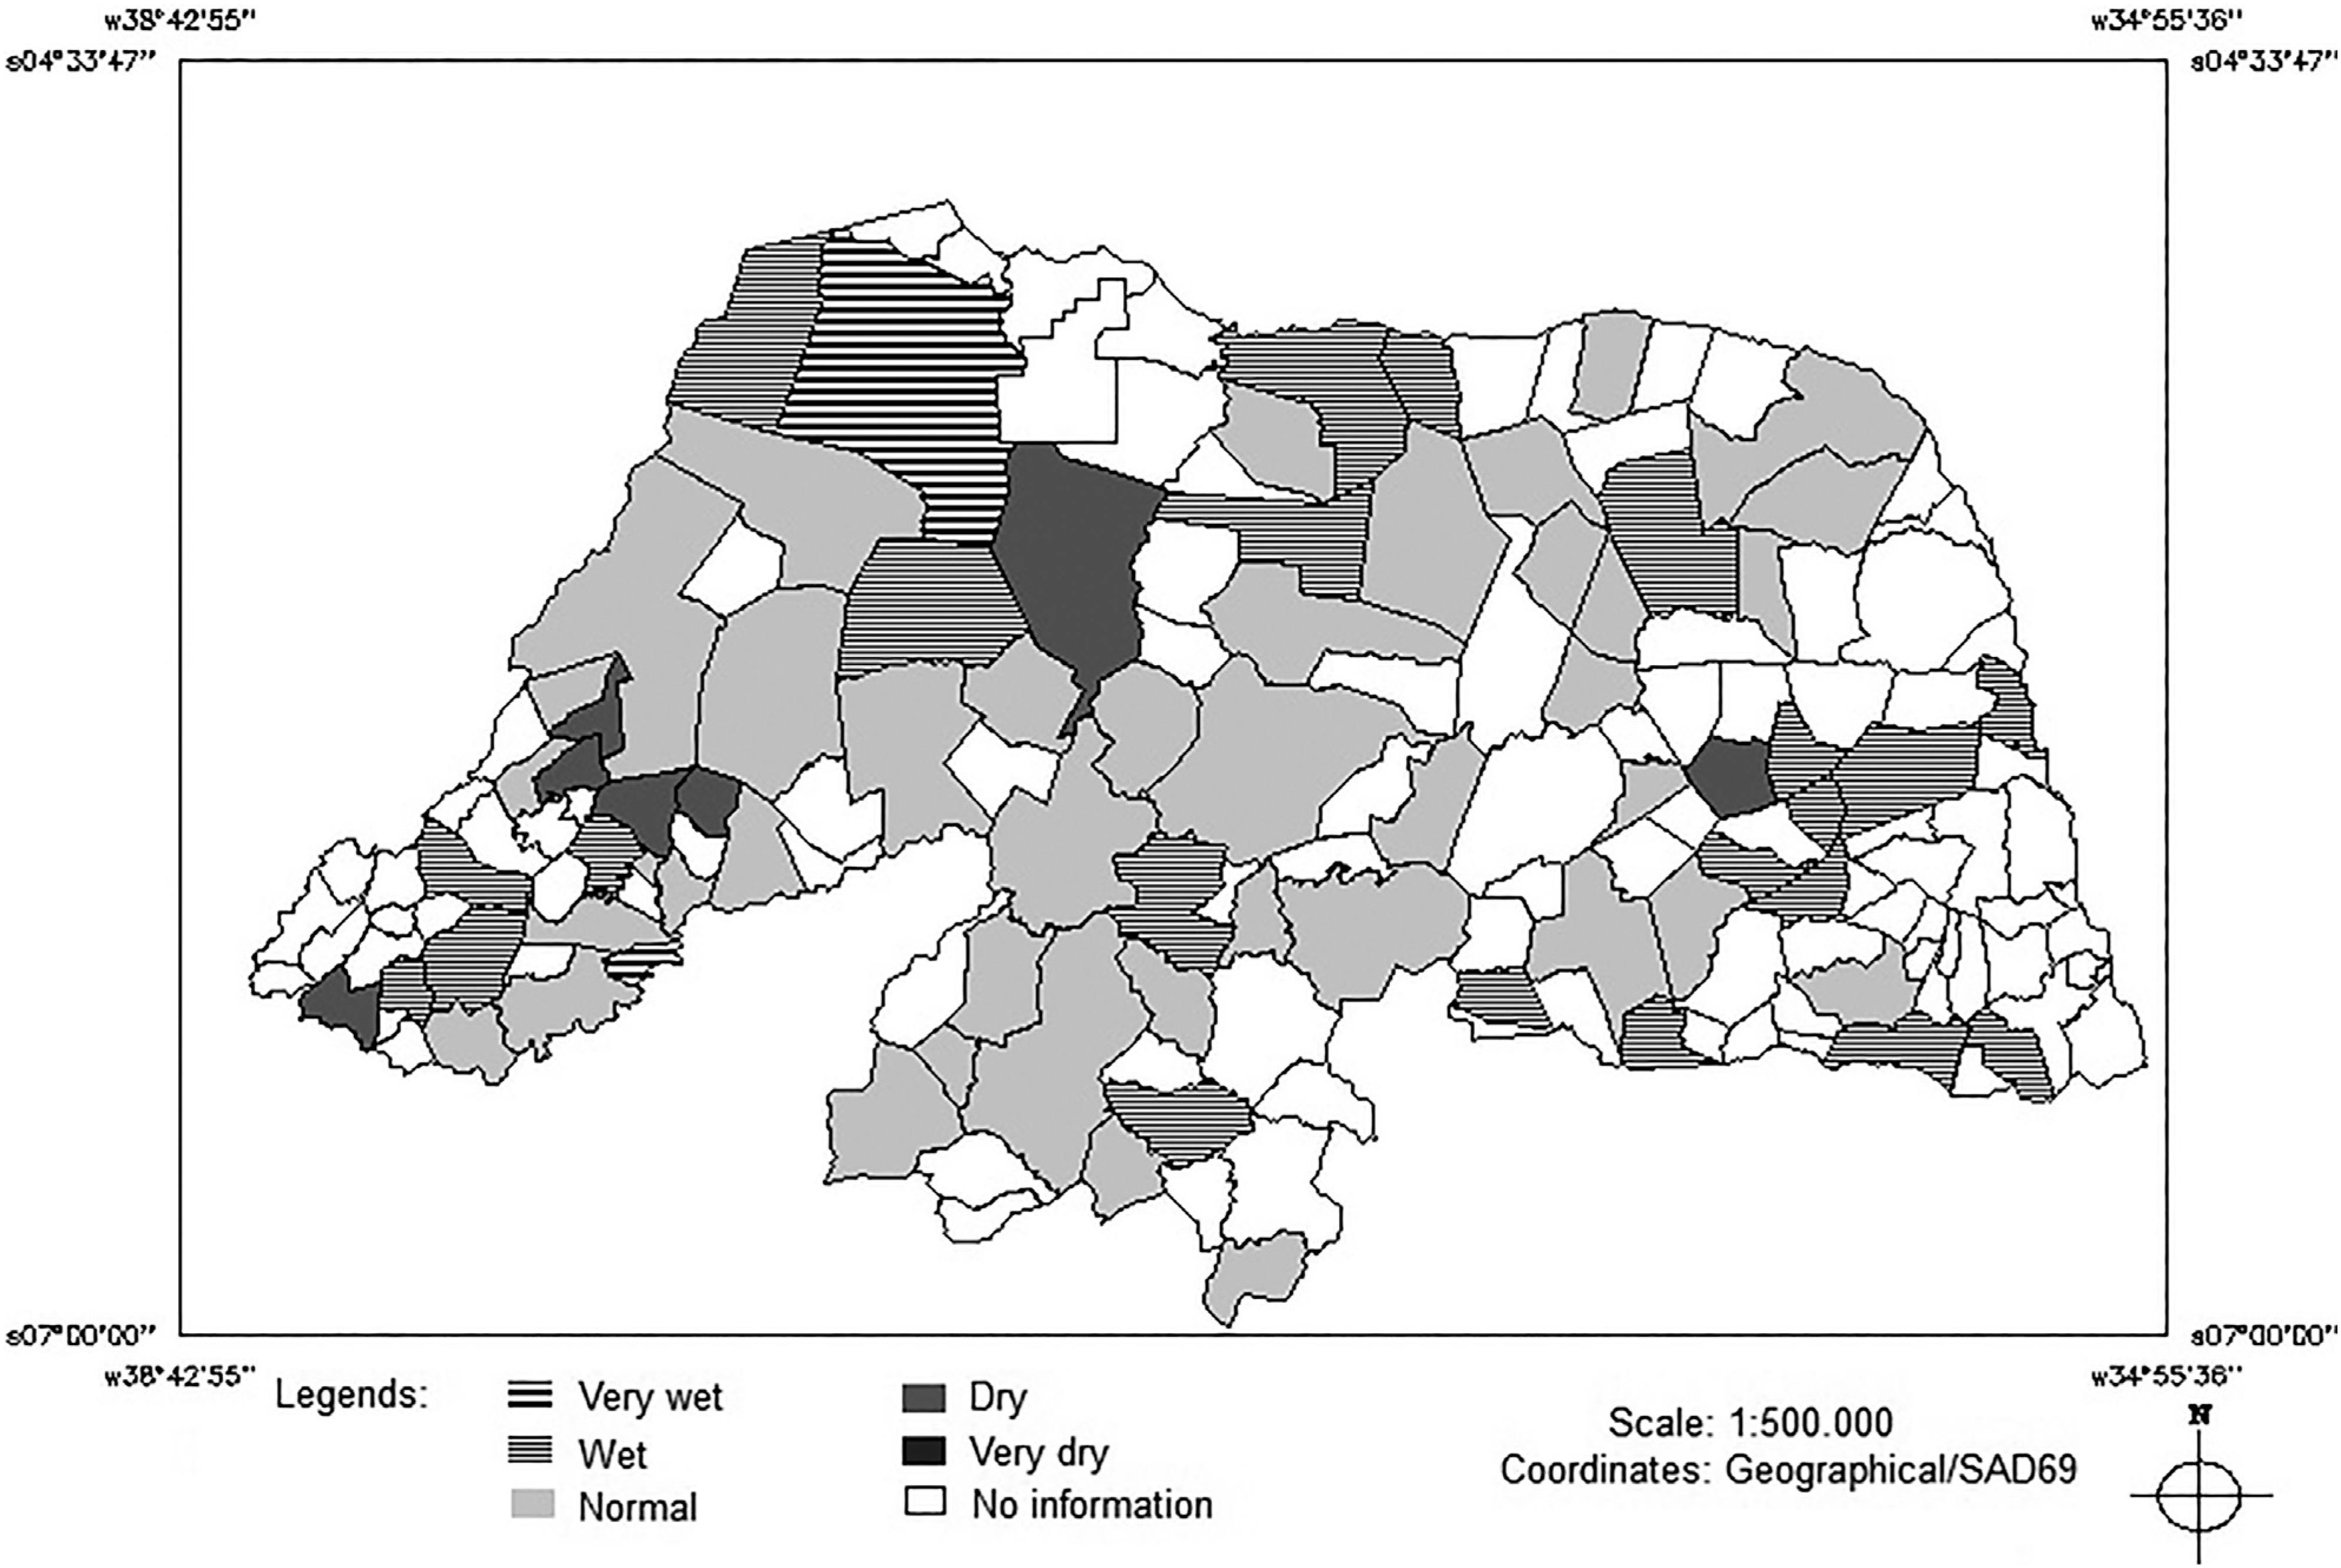
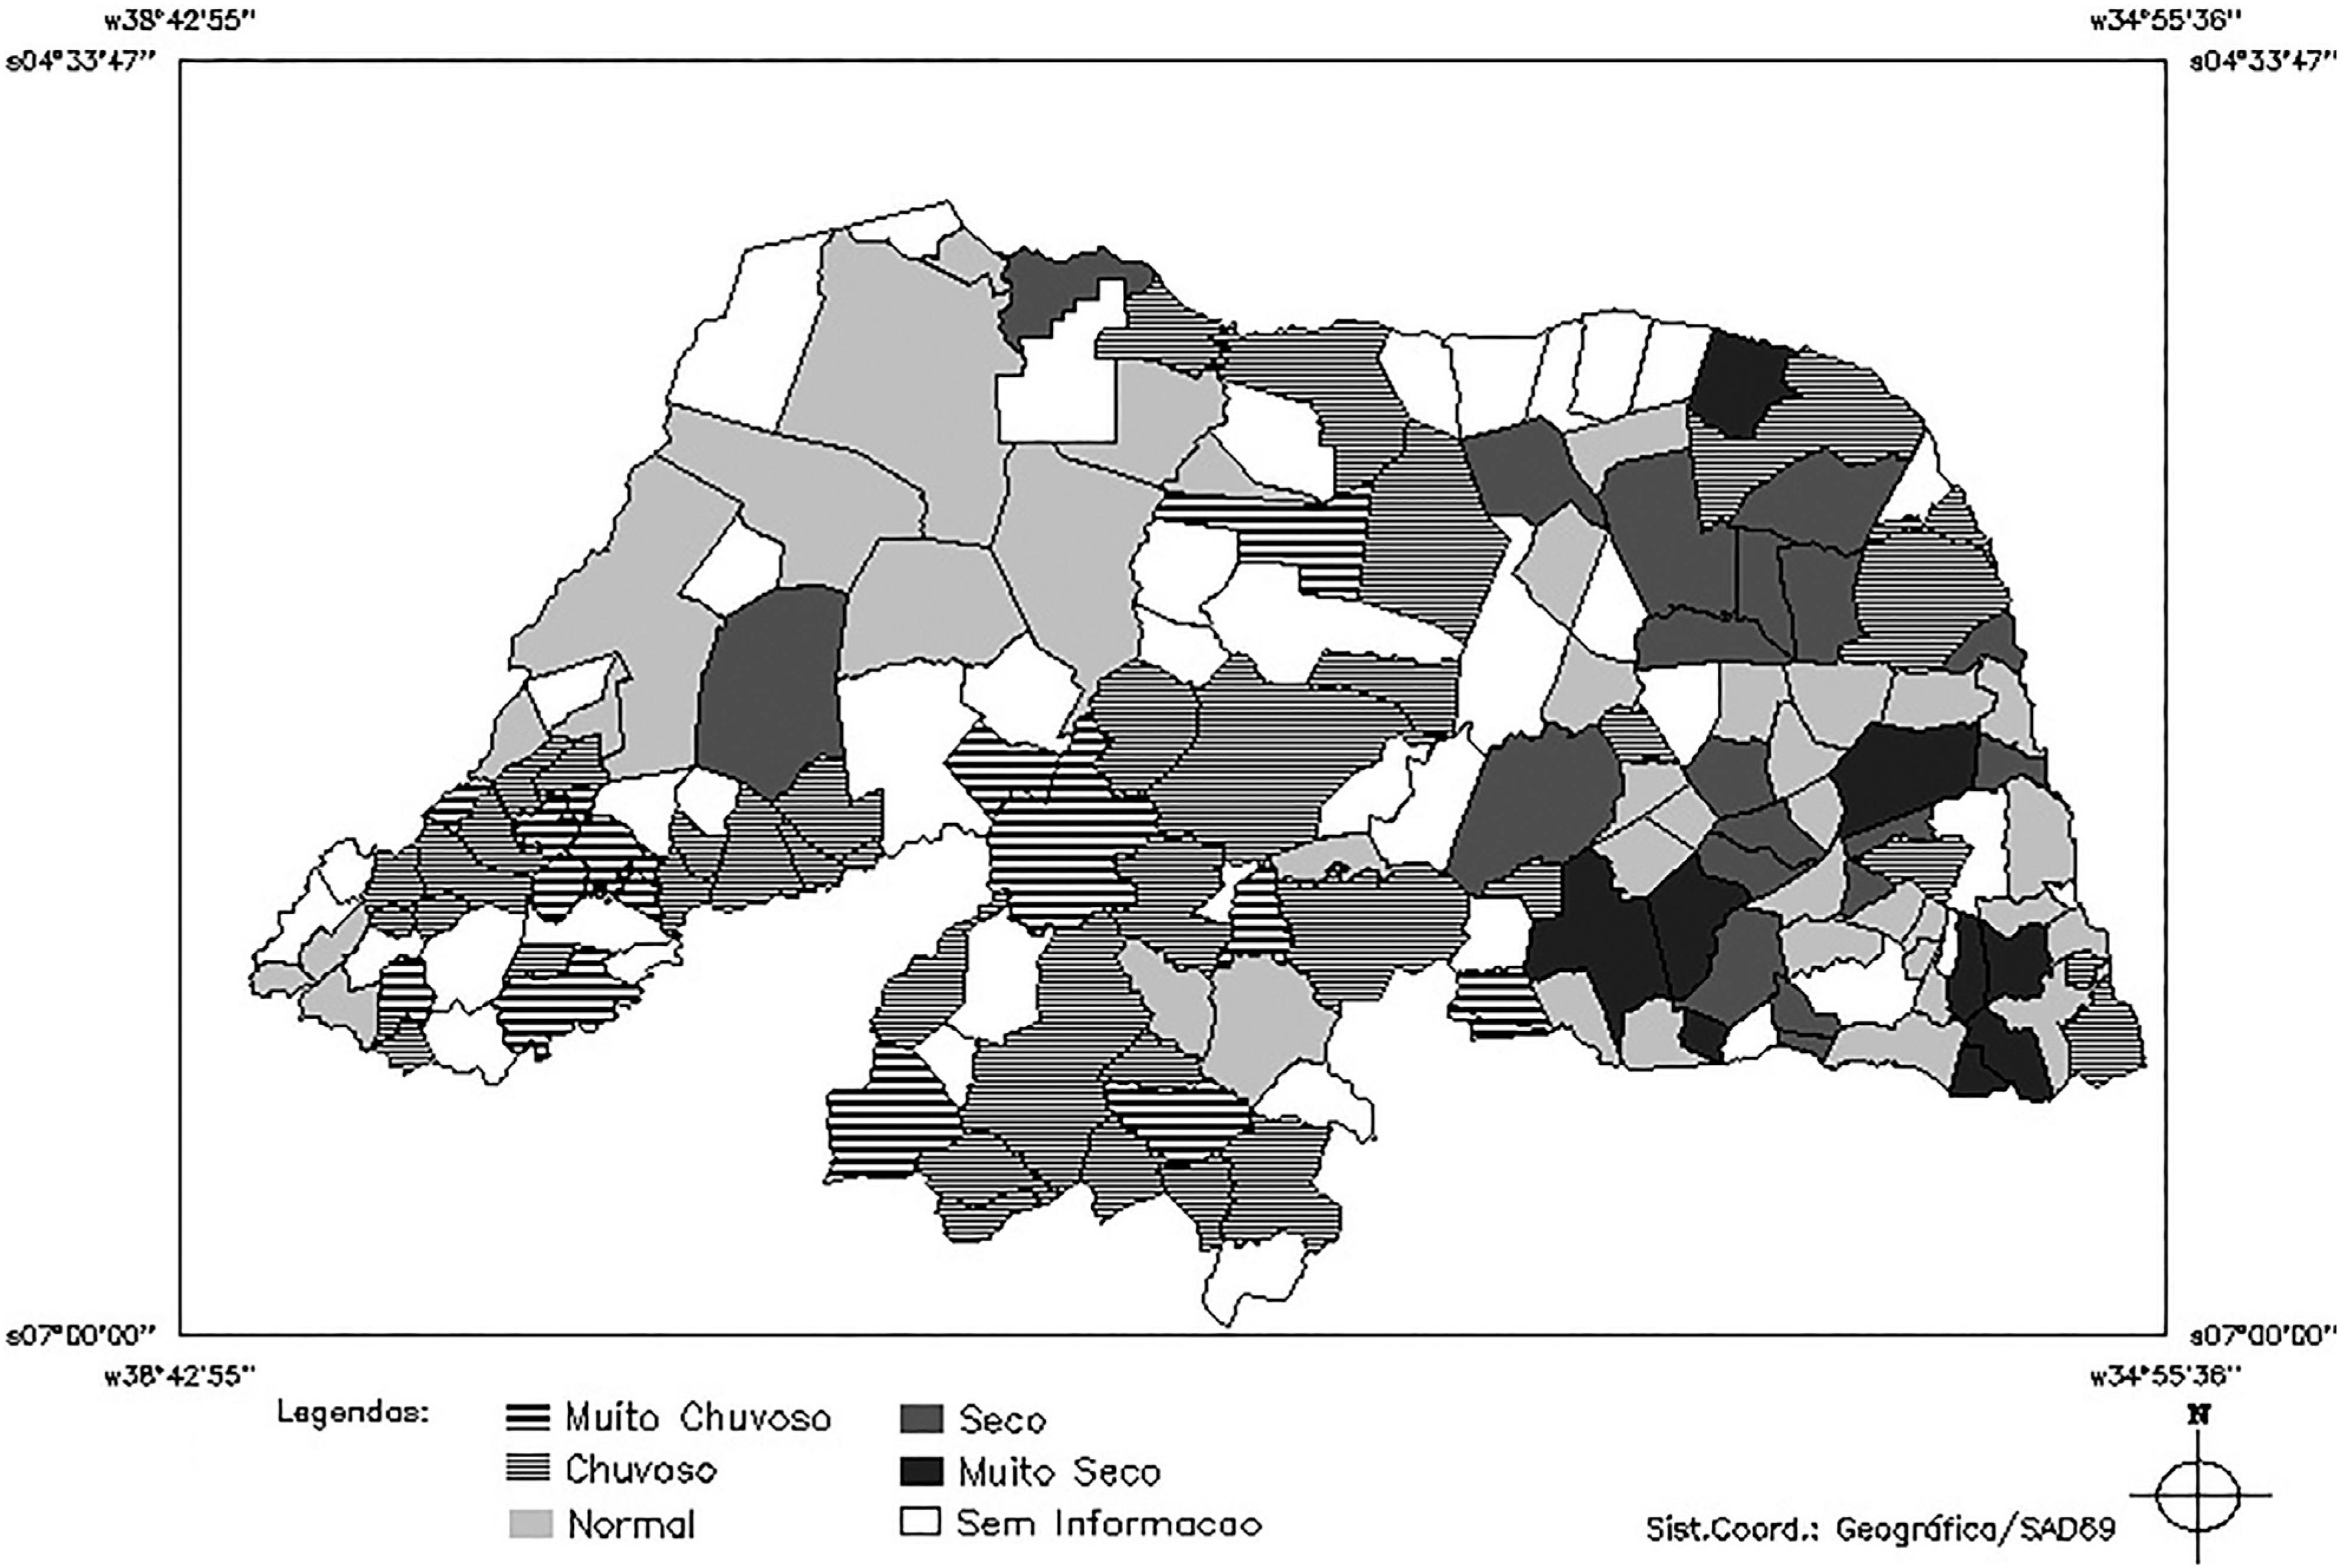
First, for the ISD test and validation with real data, scenarios were chosen that represent the conditions of dry, regular and normal years. Preference was also given to more recent years since their information is more thoroughly available, allowing that all relevant parameters could be used. Thus, the years 1998 and 2005 were chosen for the extremely dry and dry scenario, respectively, the year 2000 was chosen as a primarily normal scenario, and 2006 was chosen for a rainy scenario (Figs. 4, 5, 6 and 7, respectively). The numbers in Fig. 4 were placed to identify the municipalities and assist subsequent analysis.
Figures 8, 9, 10 and 11 show the maps with the ISD results for 1998, 2000, 2005 and 2006, respectively. When comparing these results with the results shown in Figs. 4 to 7, it is possible to verify that the ISD generally followed the rainfall tendency of each year for every tested scenario. The analysis should be done in the reverse order of the categories of precipitation maps; for example, the “Very Dry” category would have its equivalent in the category of “High Susceptibility” of the ISD, and so forth.
However, some differences were observed in the more susceptible regions, such as some regions with municipalities in the high susceptibility and medium-high susceptibility categories in the regular and rainy years, notably in the central and western central mesoregions of Rio Grande do Norte.
3.2. Multivariate data analysis
The results of the PCA (Table 3) indicate that for 1998, 2000 and 2006, five main components explain more than 80% of the variation in the data (values in bold in the table), and for 2005, four main components explain more than 80% of the variation in the data. These results indicate a desirable balance for the ISD component dimensions.
Table 4 shows the charge factors for the ISD subindicators in all tested years. High charges (> 0.75) and moderate charges (> 0.50) indicate that the sub-indicators are related to the main components. The bold values indicate which sub-indicators are significant for each of the components and consequently the total variation of the explained data for each component in Table 3.
The main component is determined by the sub-indicators VP12 and VP21 in almost every tested year, which means that the climate (historical mean rainfall) and the risk of harvest loss explain the highest proportion of data variation. These sub-indicators also appear to influence only one of the main components, which means that they are independent from the other ISD sub-indicator components.
The second component in every tested year is mainly influenced by the sub-indicators VP11 and VP133, which suggests that agricultural suitability, land use conditions and the current municipality income are the parameters that explain the second highest proportion of data variation.
The third component in every tested year was controlled by the sub-indicators VP132 and VP22, which means that the economic basis, as represented by the agriculture related to other economic activities from the municipalities, and the human and animal drinking water shortage risk are the parameters that explain the third highest proportion of variation in the data.
Finally, components 4 and 5 display a higher variation of contribution from sub-indicators from year to year, except for the sub-indicator VP11. It is also interesting to note that VP131 was redundant in the first two tested years.
3.3. Validation of the ISD with simulated data
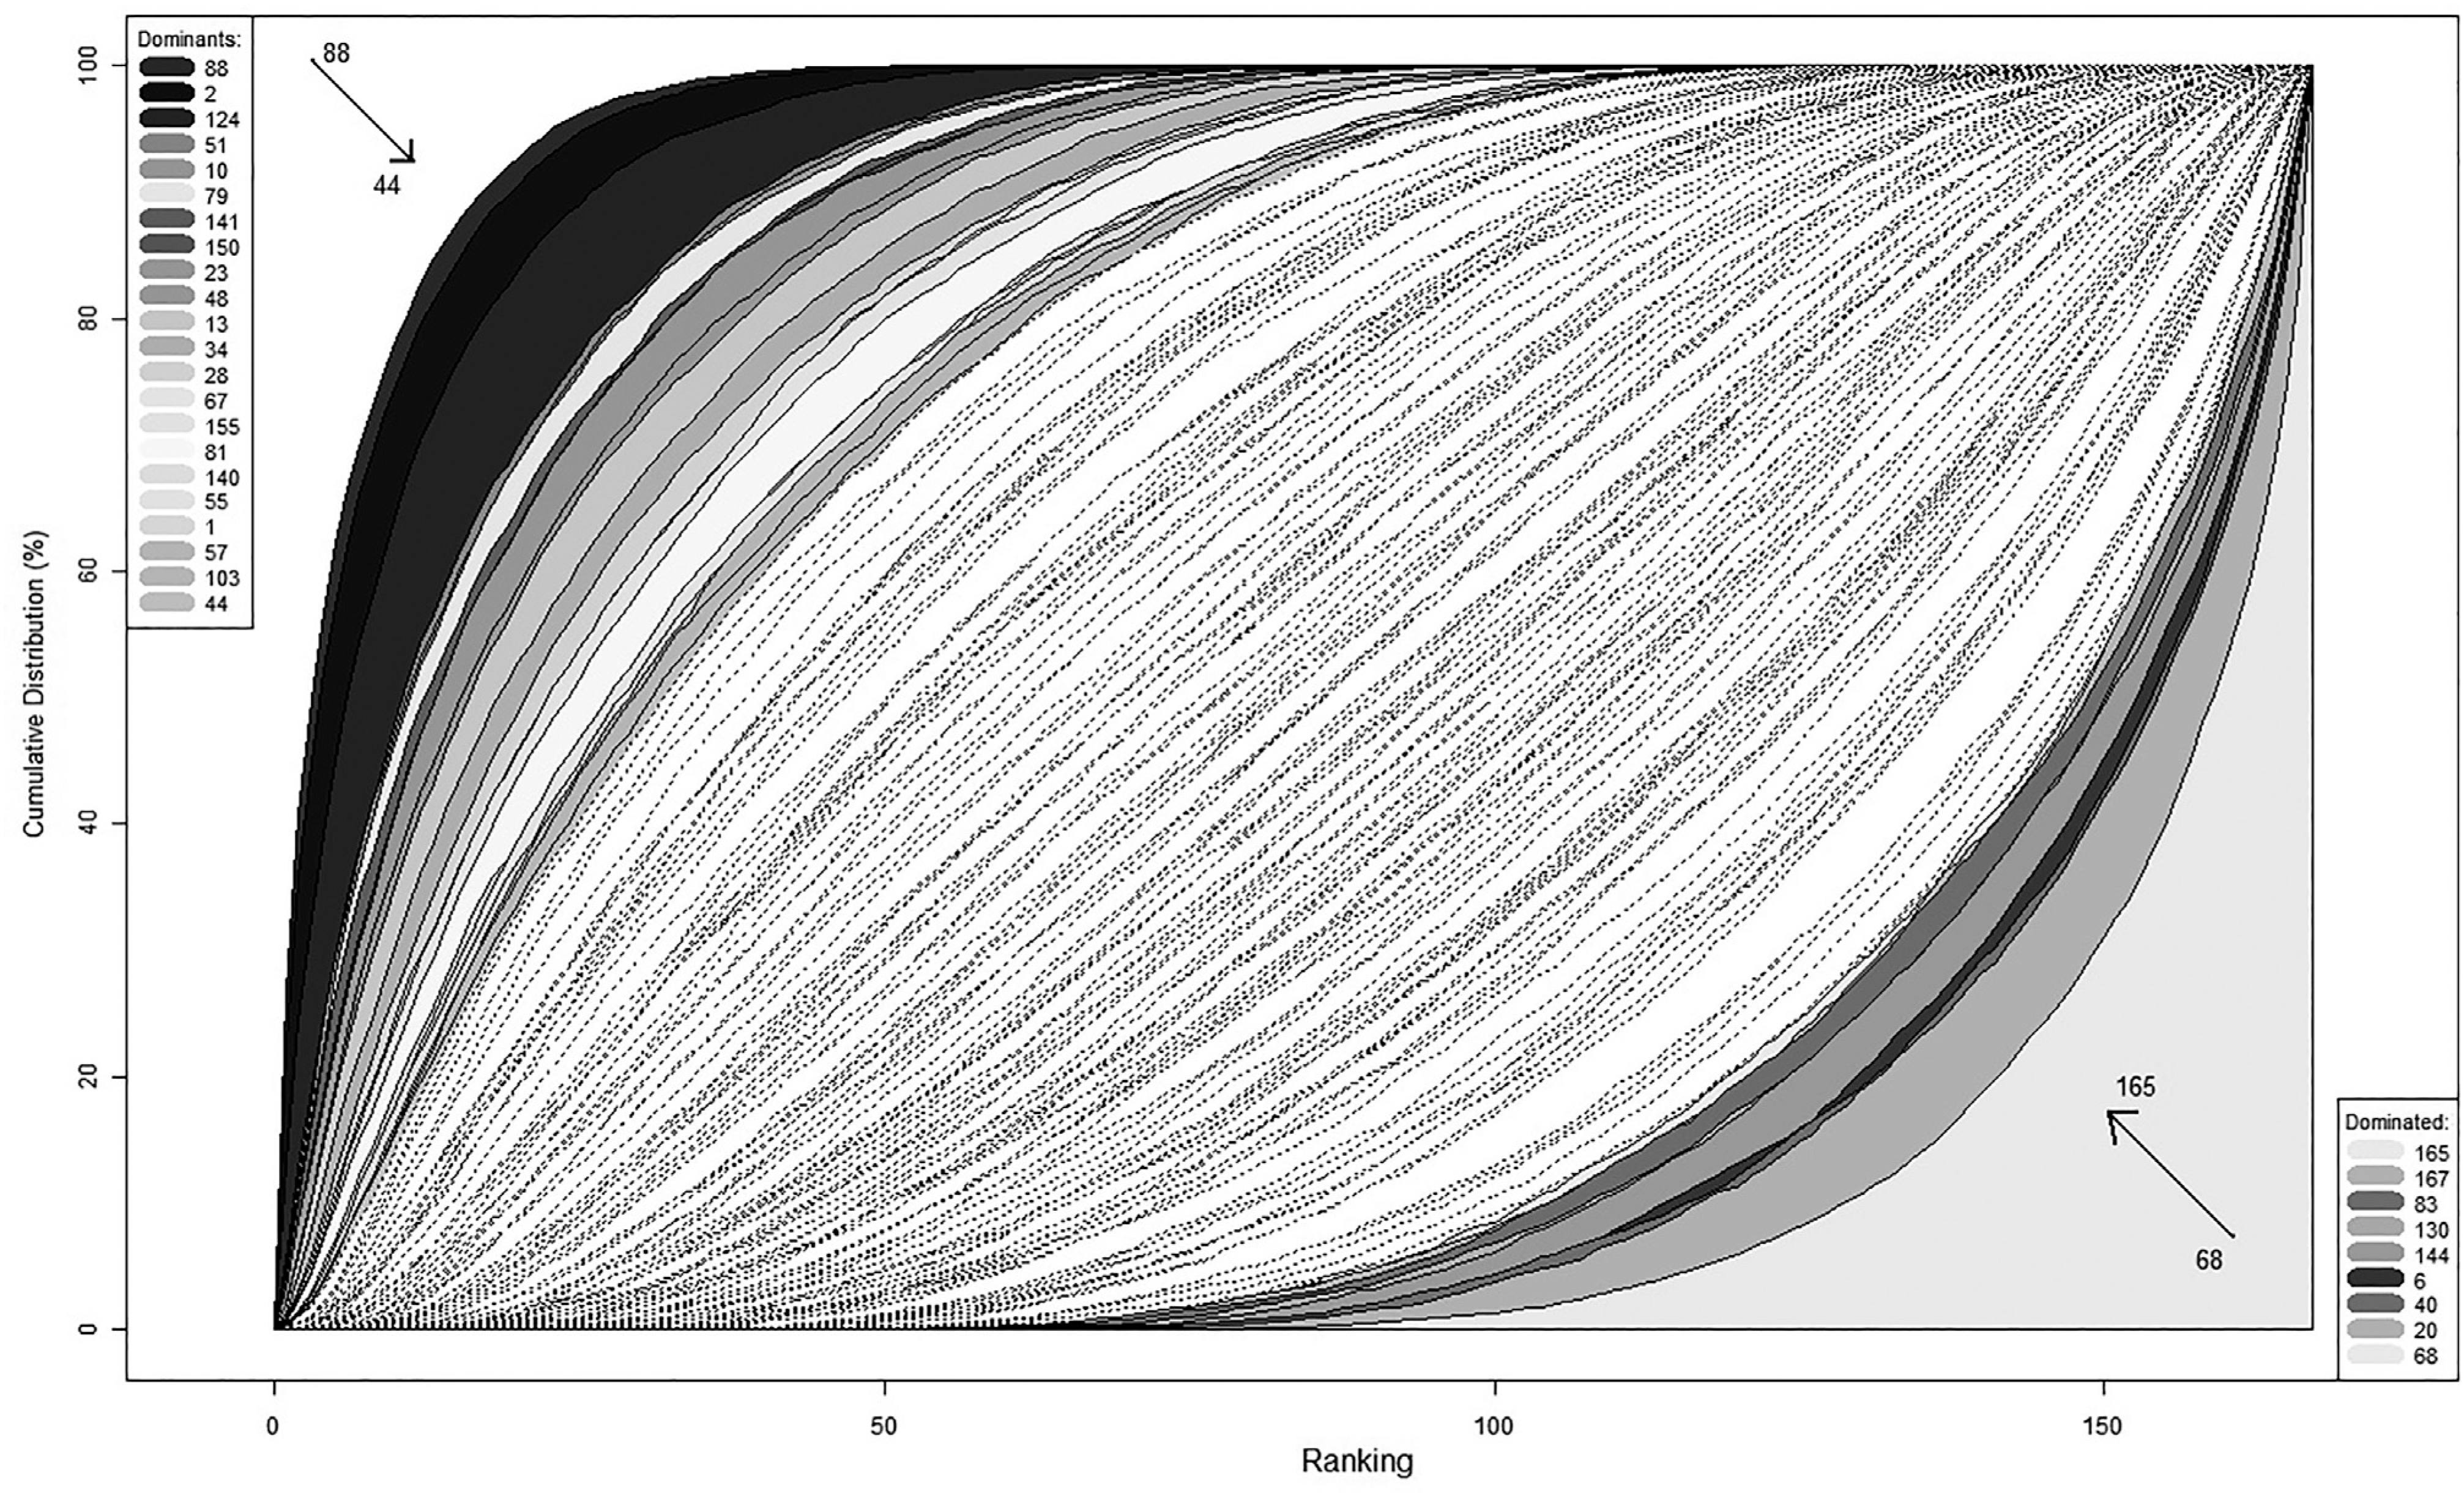
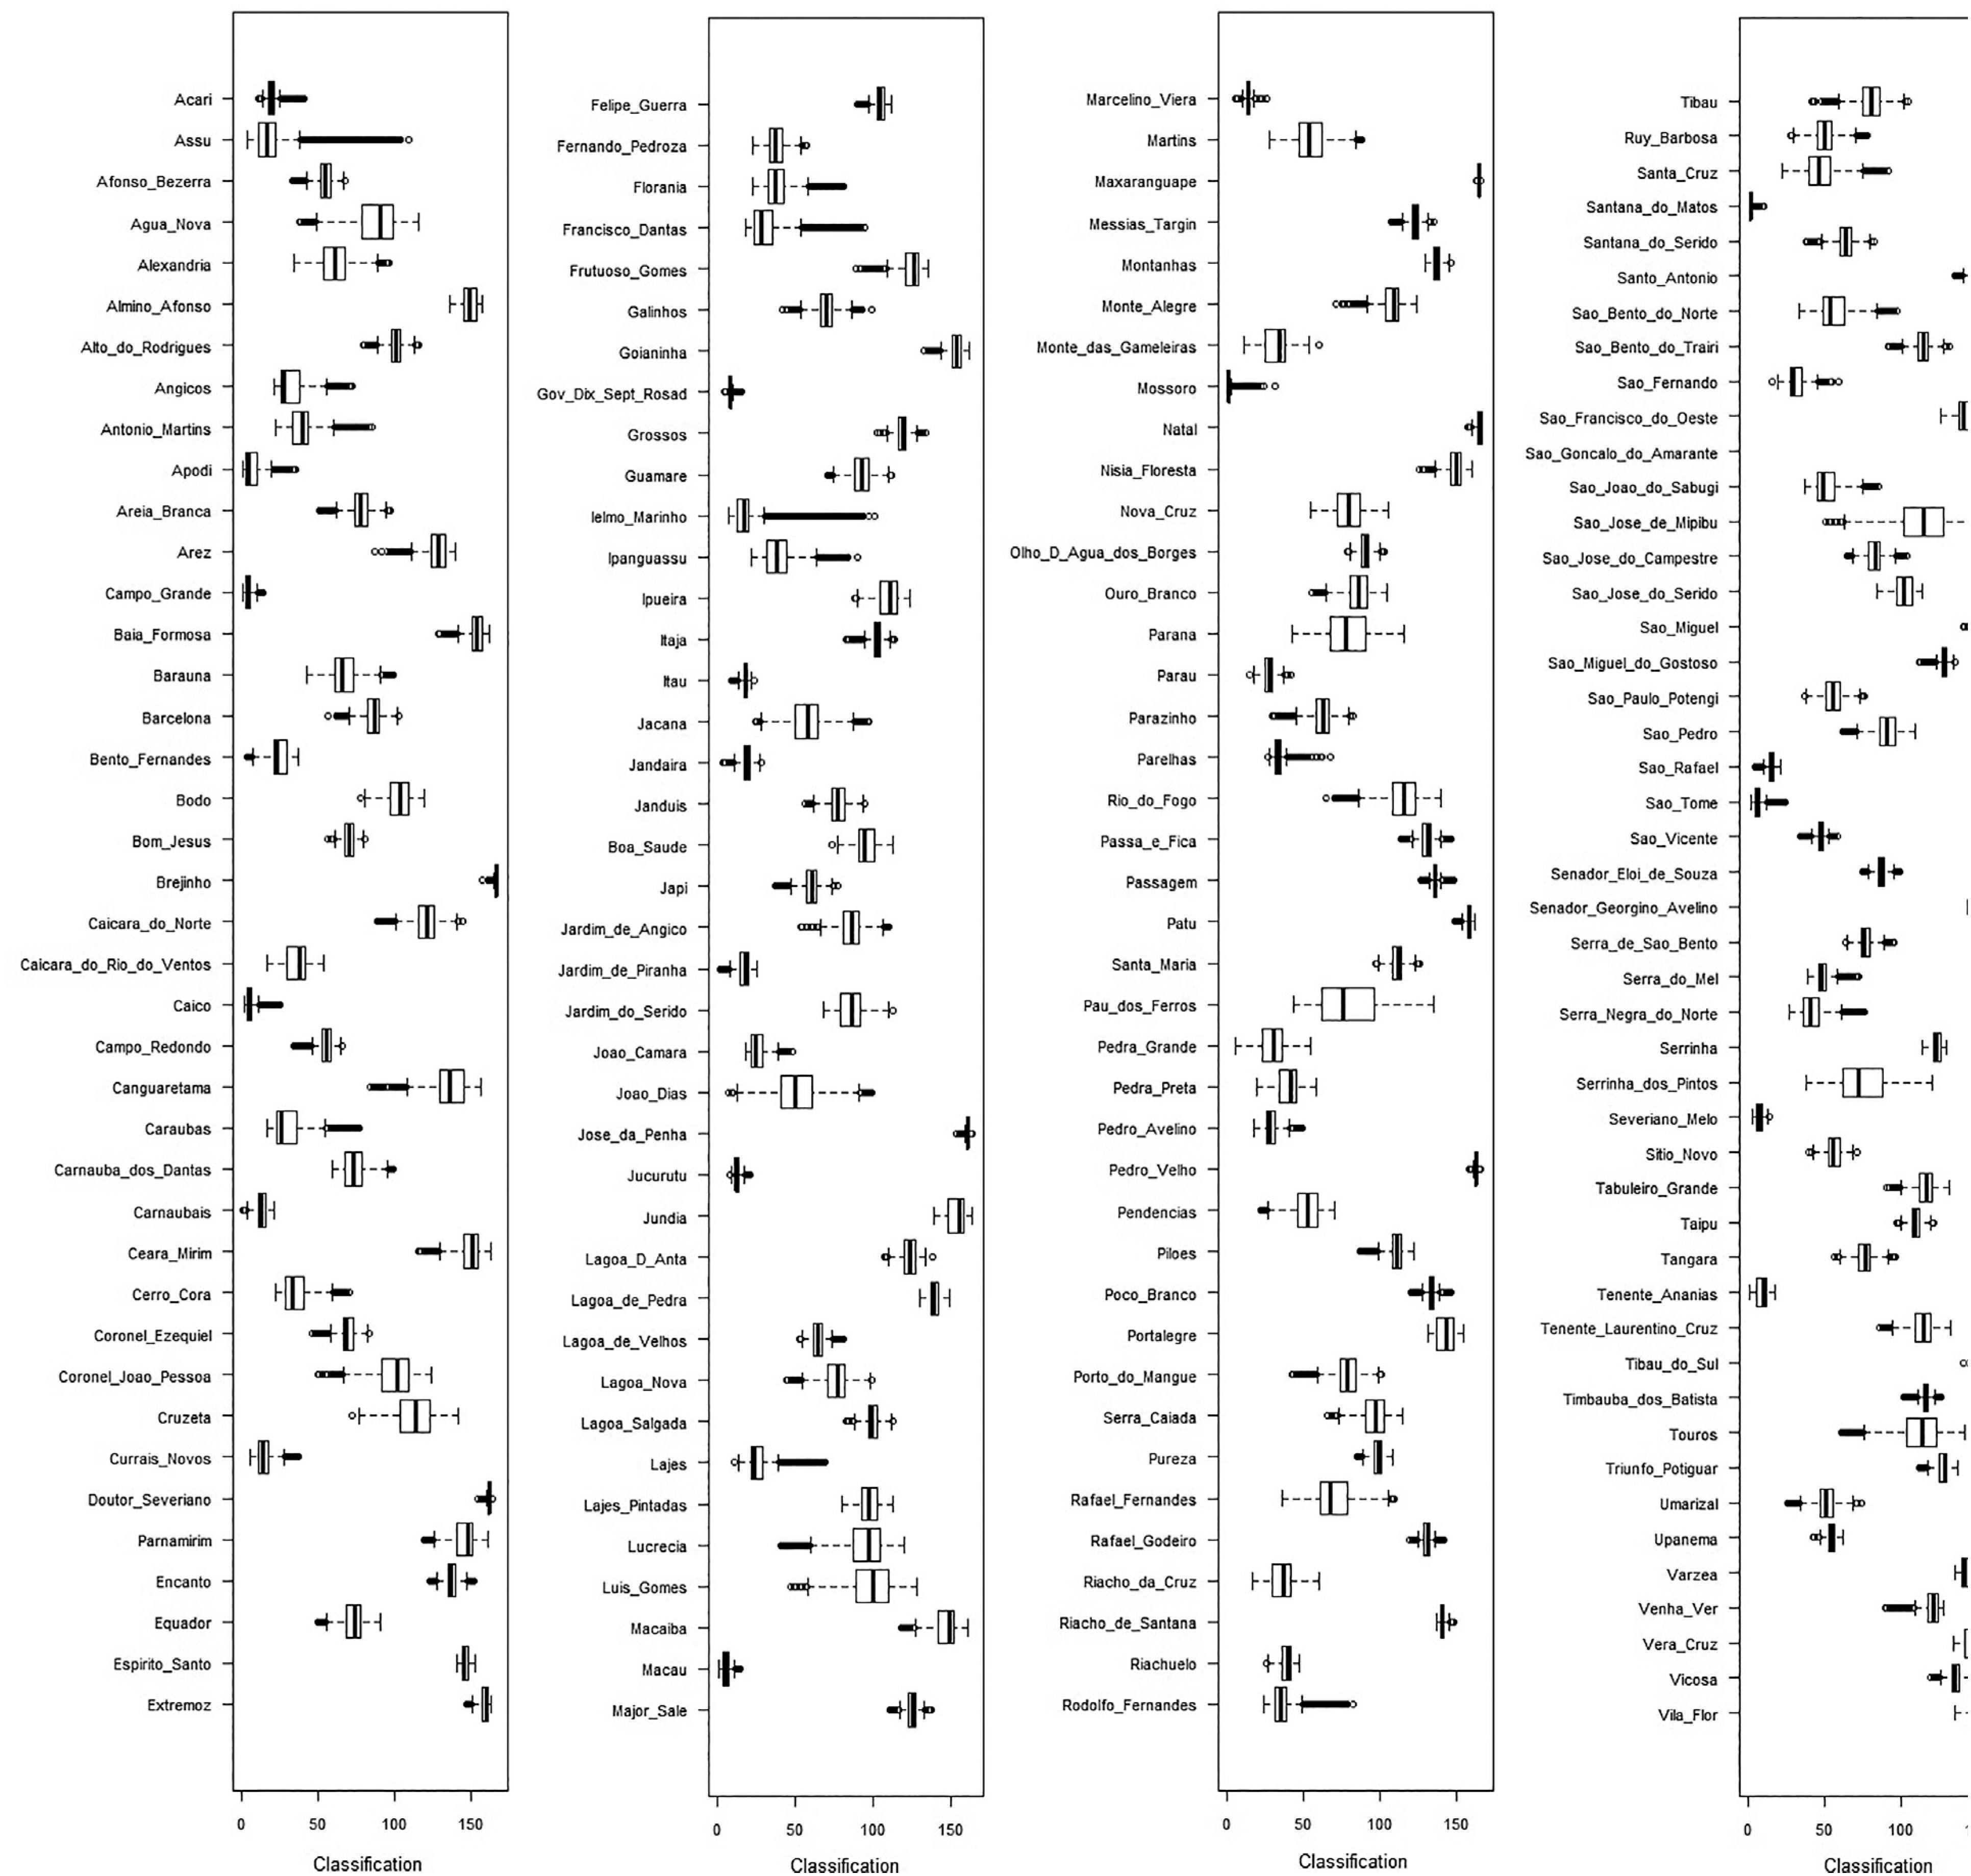
Table 5 lists the statistics of the first simulation, and in Fig. 12, the boxplot of the ISD classification that allows evaluation of the data symmetry, its dispersion and the existence of outliers is shown. In addition, Figure 13 shows the classification of the stochastic dominance of the municipalities from Rio Grande do Norte according to the order number given in Table 5.
The analysis of Table 5 and Fig. 12 indicates that the configuration of three groups of municipalities displayed more critical ISD category values in most simulations.
The first group of municipalities consists of Assu (2), Mossoró (88) and Santana dos Matos (124). The number in parenthesis means the class order of municipalities. These municipalities had positions in 25% of the realized simulations, in the first six positions in 50% of simulations and the first fifteen positions in 75% of simulations. In Fig. 13, it is possible to clearly see the stochastic relation of Mossoró municipality (88) to Assu (2) and Santana do Matos (124). These three municipalities were also stochastically dominant in all of the simulations. These results confirm what was observed with the actual data (Figs. 8 to 11) in that these municipalities were classified as high susceptibility and medium-high susceptibility in all the tested scenarios.
The second group consists of the municipalities of Apodi (10), Campo Grande (13), Caicó (23), Governador Dix Sept Rosado (48), Ielmo Marinho (51), Macau (79), São Tomé (141) and Severiano Melo (150). These municipalities are classified in the first seven positions in 75% of the simulations, in the first sixteen in 50% of simulations and in the first thirty-three in 75% of simulations. This group had three different dominance subgroups (Fig. 13). In the first, the municipalities of Ielmo Marinho (51), Apodi (10) and Macau (79) were dominant. The second sub-group consisted of São Tomé (141), Severiano Melo (150) and Caicó (23) and was dominant compared with Governador Dix Sept Rosado (48) and Campo Grande (13); however, it is not possible to graphically distinguish among these municipalities. Lastly, Governador Dix Sept Rosado was dominant over Campo Grande, although the difference is not very large. These results also confirm the results shown in Figs. 8 to 11.
The third group of municipalities with critical ISD classifications, but which was not as dominant as the previous two groups, included Currais Novos (34), Carnaubais (28), Jucurutu (67), Tenente Ananias (155), Marcelino Vieira (81), São Rafael (140), Itaú (55), Acari (1), Jandaíra (57), Pau dos Ferros (103) and Francisco Dantas (44).
Of the municipalities in the more critical categories, Jundiá (68) displayed the most significant statistics (Table 5) and null stochastic dominance compared with the other municipalities of Rio Grande do Norte. Thus, the obtained results agree with the actual data (Figs. 8 to 11) as it received a less critical classification in that analysis. Following the municipality of Jundiá (68) in reverse order of stochastic dominance are Brejinho (20), Extremoz (40) and Almino Afonso (6), with no distinction in dominance among them, after the municipalities of Senador Georgino Avelino (144) and São Francisco do Oeste (130), which also lack any distinction in dominance between them, and Maxaranguape (83), Vila Flor (167) and Natal (165). All of these municipalities are located in micro-regions next to the coast, except for Almino Afonso and São Francisco do Oeste, which are situated in the mountain region of the Rio Grande do Norte and experience better rainfall (average rainfall above 800 mm). These geographical and climate factors explain their classification in the less susceptible ISD categories.
In the second simulation, the randomization of the ISD weights was achieved by maintaining the original sub-indicator values for each tested year. A substantial reduction of dispersion of the municipality classifications related to the first simulation was observed. When Fig. 14 is compared to Fig. 12 with respect to the stochastic dominance, a predominance of the cities with critical ISD category assignations in the real data analyses are observed, which validates these results. As shown in Table 6 and Fig. 15 (stochastic graphic for the year 1998), Santana do Matos (124) and Mossoró (88) were dominant with respect to drought risk.
Boxplot of the ISD classification resulting from the first approach of the second simulation. Year: 1998.
Summary of the stochastic dominance results from the first approach of the second simulation.
Stochastic dominance of the ISD classification according to the indexing of Table 4, the first approach from the second simulation.
In the second approach of the second simulation, randomization of the ISD weights was realized, maintaining the order of weights and the equality of weights for the sub-indicators VP11 and VP131, VP12 and VP132, and VP21 and VP22. In each step of the simulation, four measures were generated, and these were attributed to their respective sub-indicators, which allowed the order and the equality of the original ISD weights to be maintained.
In addition, the simulation verified a substantial reduction of the municipality classifications related to the first simulation, as translated by the higher break values of the Interquartile Range, and related to the first approach of these simulations. With respect to stochastic dominance, there was a predominance of the municipalities that appeared in the most critical categories of ISD in the real simulations, which also validates these results (Table 7).
Summary of the stochastic dominance results from the second approach of the second simulation.
Thus, respecting the order of importance of the ISD sub-indicators, these results are similar to the results from the first simulation and the first approach from the second simulation in terms of the municipalities classified as belonging to the most critical categories and their relation to the cities in the less susceptible categories. Taken together, these results justify the choice of the weights used in the index.
4. Summary and Concluding Remarks
The ISD allows a higher-level vision of the harmful effects of drought because it correlates and externalizes the impacts beyond the physical and climatic aspects common in most of the indexes in the literature.
Because the ISD is a composite indicator with an information structure hierarchy (vector structure), its components can be evaluated separately. This feature allows public managers to potentially direct interventions towards particular factors contributing to the vulnerability of the regions under evaluation.
In general, the ISD can be used as a helpful tool for decision makers and provides the information necessary to direct actions to care and support populations affected by drought.
Since 2011 the ISD is being provided on the homepage of the EMPARN (http://189.124.135.176/ISFS.html) giving a different view of the drought in Rio Grande do Norte.
In 2012, the ISD was adapted for use in watersheds in Southeastern Brazil (in which the rainy season lasts from October to the end of March) and was tested and validated with real data of the Guandu river basin, Espirito Santo State, Brazil (Batista Júnior, 2012BATISTA JÚNIOR, W. Identificação e avaliação dos fatores de ocorrência de secas na Bacia do Rio Guandu - Espírito Santo. 2012, 127 p. Doutorado em Meteorologia Agrícola. Universidade Federal de Viçosa. UFV. Brasil. (avail. in http://www.tede.ufv.br/tedesimplificado/tde_arquivos/23/TDE-2012-10-25T081915Z-4032/Publico/texto%20completo.pdf)
http://www.tede.ufv.br/tedesimplificado/...
). Dry, normal and wet years scenarios were tested and the results showed up in agreement with the Standardized Precipitation Index (SPI) for the Basin.
References
- ALVES, J.M.B.; CAMPOS, J.N.B.; SOUZA, E.B.; REPELLI, C.A. Produção agrícola de subsistência no Estado do Ceará com ênfase aos anos de ocorrência de El Niño e La Niña. Revista Brasileira de Agrometeorologia, v. 6, n. 2, p. 249-256, 1998.
- ANDREOLI, R.V.; KAYANO, M.T. A importância relativa do Atlântico tropical sul e Pacífico leste na variabilidade de precipitação do nordeste do Brasil. Revista Brasileira de Meteorologia, v. 22, n. 1, p. 63-74, 2007.
- ANGELOTTI, F.; SÁ, I.B.; MELO, R.F. Mudanças climáticas e desertificação no semiárido brasileiro. In: ANGELOTTI, F.; SÁ, I.B.; MENEZES, E.A.; PELLEGRINO, G.Q. Mudanças climáticas e desertificação no semiárido brasileiro. Petrolina, PE: Embrapa Semiárido; Campinas, SP: Embrapa Informática Agropecuária, 2009. cap. 3. p. 41-49.
- ARAÚJO, L.E.; SOUZA, F.A.S.; RIBEIRO, M.A.F.M.; SANTOS, A.S.; MEDEIROS, P.C. Análise estatística de chuvas intensas na bacia hidrográfica do Rio Paraíba. Revista Brasileira de Meteorologia, v. 23, n. 2, p. 162-169, 2008.
- BATISTA JÚNIOR, W. Identificação e avaliação dos fatores de ocorrência de secas na Bacia do Rio Guandu - Espírito Santo. 2012, 127 p. Doutorado em Meteorologia Agrícola. Universidade Federal de Viçosa. UFV. Brasil. (avail. in http://www.tede.ufv.br/tedesimplificado/tde_arquivos/23/TDE-2012-10-25T081915Z-4032/Publico/texto%20completo.pdf)
» http://www.tede.ufv.br/tedesimplificado/tde_arquivos/23/TDE-2012-10-25T081915Z-4032/Publico/texto%20completo.pdf - BRUNINI, O.; DIAS, P.L.S.; GRIMM, A.M.; ASSAD, E.D.; BOKEN, V.K. Agricultural drought phenomenon in Latin America with focus on Brazil. In: BOKEN, V.K.; CRACKNELL, A.P.; HEATCOTE, R.L. Monitoring and predicting agricultural drought: A global study. New York, Oxford University Press. pp. 156-168, 2005.
- BUTLER, J.; JIA, J.; DYER, J. Simulation techniques for the sensitivity analysis of multi-criteria decision models. European Journal of Operation Research, v. 3, p. 531-546, 1997.
- BYUN, H.; WILHITE, D.A. Objective quantification of drought severity and duration. Journal of Climate, v. 12, p. 2747-2756, 1999.
- CARVALHO, O. A economia política do Nordeste (seca, irrigação e desenvolvimento). Rio de Janeiro-RJ: Editora Campus, 1988. 505 p.
- DANTAS, J.A. Homens e fatos do Seridó Antigo. Garanhuns: Gráfica do “O Monitor”, 1961. 168 p.
- DUARTE, R.S. A seca de 1958: uma avaliação pelo ETENE. Fortaleza: Banco do Nordeste; Recife: Fundação Joaquim Nabuco, 2002. 200 p. (Série Estudos sobre as Secas no Nordeste, 1).
- ENSSLIN, L.; ENSSLIN, S.R.; NORONHA, S.M.D.; PETRI, S.M. Elaboração de um índice de severidade de seca para o Ceará utilizando-se uma metodologia de apoio à decisão (MCDA). In: XXXII SIMPÓSIO BRASILEIRO DE PESQUISA OPERACIONAL, 1, 2000, Viçosa, MG. Anais… Viçosa: Sociedade Brasileira de Pesquisa Operacional, 2000. pp. 1147-1164.
- FREITAS, M.A.S. Um sistema de suporte à decisão para o monitoramento de secas meteorológicas em regiões semiáridas. Revista Tecnologia, v. Suplem, p. 84-95, 2005.
- FUNDAÇÃO CEARENSE DE METEOROLOGIA. Manual do índice FUNCEME de severidade de seca. Fortaleza, 2000. 278 p.
- GONZALEZ, R.A.; ANDREOLI, R.V.; CANDIDO, L.A.; KAYANO, M.T.; SOUZA, R.A.F. A influência do evento El Niño-Oscilação sul e Atlântico equatorial na precipitação sobre as regiões norte e nordeste da América do Sul. Acta Amazonica (Impresso), v. 43, p. 469-480, 2013.
- GUERRA, P.B.A civilização da seca. Fortaleza, DNOCS, 1981. 324 p.
- INSTITUTO BRASILEIRO DE GEOGRAFIA E ESTATÍSTICA. Produto interno bruto dos municípios: 1999-2002. Contas Nacionais, n. 14. Rio de Janeiro, 2005. 188 p.
- INSTITUTO BRASILEIRO DE GEOGRAFIA E ESTATÍSTICA. Sinopse preliminar do censo demográfico – 2000. Rio de Janeiro, v. 7, 2001. 415 p.
- INSTITUTO BRASILEIRO DE GEOGRAFIA E ESTATÍSTICA. Censo agropecuário – 2006: Resultados Preliminares. Rio de Janeiro, 2006. 146 p.
- INSTITUTO BRASILEIRO DE GEOGRAFIA E ESTATÍSTICA. Contas regionais do Brasil: 2002-2005. Contas Regionais do Brasil, n. 21. Rio de Janeiro, 2007. 110 p.
- KAYANO, M.T.; ANDREOLI, R.V.; SOUZA, R.A.F. Relations between ENSO and the South Atlantic SST modes and their effects on the South American rainfall. International Journal of Climatology, v. 33, p. 2008-2023, 2013.
- KAYANO, M.T.; CAPISTRANO, V.B. How the Atlantic multidecadal oscillation (AMO) modifies the ENSO influence on the South American rainfall. International Journal of Climatology, v. 34, p. 162-178, 2014.
- MAGALHÃES, A.R.; MARTINS, E.S. Drought and drought policy in Brazil. In: SIVAKUMAR, M.V. K.; MOTHA, R.P.; WILHITE, D.A.; QU, J.J. (Eds.). Towards a Compendium on National Drought Policy. Proceedings of an Expert Meeting, july 14-15, 2011, Washington DC, USA: Geneva, Switzerland: World Meteorological Organization. AGM-12; WAOB-2011. p. 57-67.
- MARENGO, J.A. Mudanças climáticas globais e seus efeitos sobre a biodiversidade: caracterização do clima atual e definição das alterações climáticas para o território brasileiro ao longo do século XXI. Brasília, DF: Ministério do Meio Ambiente, 2006, 159 p. il. (Biodiversidade, 26).
- MENDONÇA, F.; DANNI-OLIVEIRA, I.M. Climatologia: Noções básicas e climas do Brasil. São Paulo: Oficina de Textos, 2007. 206 p.
- MOREIRA FILHO, J.C. A seca de 1993: crônica de um Flagelo anunciado. Fortaleza: Banco do Nordeste; Recife: Fundação Joaquim Nabuco, 2002. 138 p. (Série Estudos sobre as Secas no Nordeste; v. 4)
- MA/DNPEA-SUDENE/DRN. Levantamento exploratório - reconhecimento de solos do Estado do Rio Grande do Norte. Recife: MA/DNPEA-SUDENE/DRN, PE, 1971. 534 p.
- NARDO, M.; SAISANA, M.; SALTELLI, A.; TARANTOLA, S.; HOFFMAN, A.; GIOVANNINI, E. Handbook on constructing composite indicators: Methodology and user guide. OECD Statistics Working Papers, OECD, Statistics Directorate, No 2005/3, 2005. 109 p. Web-site: http://econpapers.repec.org/RePEc:oec:stdaaa:2005/3-en
» http://econpapers.repec.org/RePEc:oec:stdaaa:2005/3-en - NEVES, J.A. Um índice de susceptibilidade ao fenômeno da seca para o semiárido nordestino 2010. 399 p. Tese (Doutorado em Matemática Computacional) - Universidade Federal de Pernambuco, Recife, 2010.
- NOBRE, P.; MELO, A.B.C. Variabilidade climática intrasazonal sobre o Nordeste do Brasil em 1998-2000. Revista Climanálise, ano 2, n. 1, 2004.
- PAINEL BRASILEIRO DE MUDANÇAS CLIMÁTICAS (PBMC). Contribuição do grupo de trabalho 2 ao primeiro relatório de avaliação nacional do Painel Brasileiro de Mudanças Climáticas. Sumário executivo do GT2. PBMC, Rio de Janeiro. 2013. 28 p.
- PANDEY, C.B.; SINGH, G.B.; SINGH, S.K.; SINGH, R.K. Soil nitrogen and microbial biomass carbon dynamics in native forests and derived agricultural land uses in a humid tropical climate of India. Plant and Soil, v. 33, n. 3, p. 453-467, 2010.
- PESSOA, D.M. Caráter e efeito da seca nordestina de 1970. Fortaleza: Banco do Nordeste; Recife: Fundação Joaquim Nabuco, 2002. 302 p. (Série Estudos sobre as Secas no Nordeste; v. 2).
- SMAKHTIN, V. U.; HUGHES, D.A. Review, automated estimation and analyses of drought indices in South Asia. Working Paper 83. Colombo, Sri Lanka: International Water Management Institute, 2004.
- SILVA, J.S.V., FORTE, S.H.A.C. Uma contribuição nas decisões emergenciais da gestão pública em regiões semiáridas. Revista Econômica do Nordeste, v. 33, n 4, p. 176, 2002.
- XAVIER, T.M.B.S.; XAVIER, A.F.S. Caracterização de períodos secos ou excessivamente chuvosos no Estado do Ceará através da técnica dos quantis: 1964-1998. Revista Brasileira de Meteorologia, v. 14, n. 2, p. 63-78, 1999.
Publication Dates
-
Publication in this collection
22 Apr-Jun 2016
History
-
Received
04 Feb 2015 -
Accepted
24 Sept 2015