Abstract
Purpose:
To quantify, through stereological and morphometric analysis, spermatogenesis in rats undergoing the natural aging process.
Methods:
Seventy-two male Wistar rats were divided into 6 equal groups according to age at the time of killing: 3, 6, 9, 12, 18, and 24 months. All the rats were subjected orchiectomy and collection of testicular parenchymal fragments for histological and morphometric analysis. The numerical density of spermatids was calculated using a stereological study, and morphometric analysis was conducted to measure the height of the germinal epithelium and the area of the seminiferous tubules.
Results:
We found that the 18 and 24 months groups showed a significant reduction in the number of round spermatids. However, the height of the germinal epithelium was not significantly different between the groups. The area of seminiferous tubules was also significantly reduced in the elderly rats compared to that in the young ones.
Conclusion:
Aging of rats showed a significant reduction in the number of round spermatids and the area of the seminiferous tubules, more pronounced in the rats at 18 and 24 months of life.
Key words:
Aging; Spermatogenesis; Infertility; Testis; Spermatids; Rats
Introduction
The human population has experienced a sustained increase in life span, especially in recent decades; this increase occurred first in developed countries and, subsequently, in developing countries. Professional and cultural factors and the use of modern contraceptive methods have also led to an increase in the age of paternity. Moreover, the use of assisted reproduction techniques has increased, and changes due to aging have become more evident and important as one of the factors for determining the fertility of couples in such cases11 Kovac JR, Addai J, Smith RP, Coward RM, Lamb DJ, Lipshultz LI. The effects of advanced paternal age on fertility. Asian J Androl. 2013 Nov;15(6):723-8. doi: 10.1038/aja.2013.92.
https://doi.org/10.1038/aja.2013.92...
.
Aging is a natural ongoing process characterized by morphological and structural degeneration, and like other organs, the gonads also deteriorate due to this process; however, unlike women, who present clinical signs of ovarian failure, men do not show accurate visibly signs of testicular failure22 Eskenazi B, Wyrobek AJ, Sloter E, Kidd SA, Moore L, Young S, Moore D. The association of age and semen quality in healthy men. Hum Reprod. 2003 Feb;18(2):447-54. PMID: 12571189.. Although spermatogenesis continues throughout life, the quantity and quality of this process in elderly men is lower than that in young men22 Eskenazi B, Wyrobek AJ, Sloter E, Kidd SA, Moore L, Young S, Moore D. The association of age and semen quality in healthy men. Hum Reprod. 2003 Feb;18(2):447-54. PMID: 12571189.
3 Plas E, Berger P, Hermann M, Pflüger H. Effects of aging on male fertility? Exp Gerontol. 2000 Aug;35(5):543-51. PMID: 10978677.-44 Jiang H, Zhu WJ, Li J, Chen QJ, Liang WB, Gu YQ. Quantitative histological analysis and ultrastructure of the aging human testis. Int Urol Nephrol. 2014 May;46(5):879-85. doi: 10.1007/s11255-013-0610-0.
https://doi.org/10.1007/s11255-013-0610-...
; however, it is difficult to determine the exact moment when this decline becomes more pronounced.
Besides spermatogenesis, another important role played by the testes is in the production of the male hormone, testosterone. Since all testicular functions are related to each other, infertile men have an increased risk of hypogonadism55 O'Brien JH, Lazarou S, Deane L, Jarvi K, Zini A. Erectile dysfunction and andropause symptoms in infertile men. J Urol. 2005 Nov;174(5):1932-4. doi: 10.1097/01.ju.0000177453.14334.a2.
https://doi.org/10.1097/01.ju.0000177453...
. Aging affects both these testicular functions66 Beattie MC, Adekola L, Papadopoulos V, Chen H, Zirkin BR. Leydig cell aging and hypogonadism. Exp Gerontol. 2015 Aug;68:87-91. doi: 10.1016/j.exger.2015.02.014.
https://doi.org/10.1016/j.exger.2015.02....
. The aged male gonad presents structural and morphological changes such as decreased volume and reduced number of germ cells44 Jiang H, Zhu WJ, Li J, Chen QJ, Liang WB, Gu YQ. Quantitative histological analysis and ultrastructure of the aging human testis. Int Urol Nephrol. 2014 May;46(5):879-85. doi: 10.1007/s11255-013-0610-0.
https://doi.org/10.1007/s11255-013-0610-...
, which are associated with a decrease in the quality of sperm and fertility77 Hellstrom WJ, Overstreet JW, Sikka SC, Denne J, Ahuja S, Hoover AM, Sides GD, Cordell WH, Harrison LM, Whitaker JS. Semen and sperm reference ranges for men 45 years of age and older. J Androl. 2006 May-Jun;27(3):421-8. doi: 10.2164/jandrol.05156.
https://doi.org/10.2164/jandrol.05156...
. The decrease in semen quality in elderly men may result, in addition to infertility, in an increase in the possibility of complications during pregnancy and certain diseases such as autism, schizophrenia, bipolarity, and achondroplasia88 Lawson G, Fletcher R. Delayed fatherhood. J Fam Plann Reprod Health Care. 2014 Oct;40(4):283-8. doi: 10.1136/jfprhc-2013-100866.
https://doi.org/10.1136/jfprhc-2013-1008...
.
Stereology is the quantitative assessment of the three-dimensional structure and spatial arrangement of thin two-dimensional sections of biological specimens99 Liu Z, Chang Q, Xu ZL, Zhang ZG. Stereological measurement of rat's seminiferous tubule. Chin Med J (Engl). 2009 Nov;122(21):2643-6. PMID: 19951585.. This technique has been used in previous studies to evaluate parameters of the seminiferous tubule and germ cells99 Liu Z, Chang Q, Xu ZL, Zhang ZG. Stereological measurement of rat's seminiferous tubule. Chin Med J (Engl). 2009 Nov;122(21):2643-6. PMID: 19951585.
10 Bechara GR, de Souza DB, Simoes M, Felix-Patrício B, Medeiros JL Jr, Costa WS, Sampaio FJ. Testicular morphology and spermatozoid parameters in spontaneously hypertensive rats treated with enalapril. J Urol. 2015 Nov;194(5):1498-503. doi: 10.1016/j.juro.2015.06.073.
https://doi.org/10.1016/j.juro.2015.06.0...
-1111 Xia Y, Zhu WJ, Hao SF, Liang WB, Li J. Stereological analysis of age-related changes of testicular peritubular cells in men. Arch Gerontol Geriatr. 2012 Jul-Aug;55(1):116-9. doi: 10.1016/j.archger.2011.05.005.
https://doi.org/10.1016/j.archger.2011.0...
. In the present study, we conducted stereological analysis to precisely determine the stage of life when a greater deterioration in the morphological, cellular, and structural elements of spermatogenesis occurs with aging in rats.
Methods
The study was approved by the Ethics Committee in Animal Experimentation (CEEA), Department of Biological Sciences, Universidade Federal do Paraná. All animal experiments were conducted in accordance with the ethical principles established by the Brazilian College of Animal Experimentation (COBEA) and the requirements laid down in the “Guide for the Care and Use of Experimental Animals”.
Seventy-two 3-months-old male albino Wistar rats (Rattus novergicus albinus, Rodentia, Mammalia) were used in this study. The rats were housed under a controlled temperature of 22°C with a light/dark cycle of 12 h and with controlled air moisture in an environment free from external noises. Filtered water and species-specific rations were supplied ad libitum throughout the experiment.
The animals were divided into six groups (n = 12 in each group) and killed at different ages: 3 months, 6 months, 9 months, 12 months, 18 months, and 24 months.
The animals were anesthetized with ketamine (57.67 mg/kg) and xylazine hydrochloride (10mg/kg) via intraperitoneal injection under aseptic conditions. The procedures consisted of laparotomy and median thoracotomy for removal of organs (for use in other studies), cardiac incision with induction of cardiac arrest by exsanguination, and bilateral orchiectomy by a median scrotal incision, isolation, ligature, and sectioning of the spermatic cord, and resection of both testes. The left testes were immediately frozen at -80°C (for use in another study), and the right testes of all the animals were weighed and measured (length, width, and thickness) and used in the present study.
Morphometric and stereological analysis
A single 2-mm (breadth and depth) incision was made in the upper, middle, and lower thirds of the right testes for better penetration of the fixative, and the testes were then submerged in ALFAC (alcohol 80%, formaldehyde, and acetic acid) for 16 h. The testes were then transferred into 70% alcohol, followed by dehydration in a series of decreasing concentrations of xylene and alcohol for subsequent embedding in paraffin blocks.
The testes were then cut into 5-µm-thick sections using a microtome (American Optical, Spencer AO 820). To obtain random and uniformly isotropic sections, the Orientatior1212 Mattfeldt T, Mobius HJ, Mall G. Orthogonal triplet probes: an efficient method for unbiased estimation of length and surface of objects with unknown orientation in space. J Microsc. 1985 Sep;139(3):279-89. PMID: 3908688. method was used, and the Physical Disector1313 Sterio DC. The unbiased estimation of number and sizes of arbitrary particles using the disector. J Microsc. 1984 May;134(2):127-36. PMID: 6737468. method was used to calculate the numerical density of the spermatids. The sampling of testicular tissue was performed with two consecutive sections excluding, among them, three 5-µm sections, representing a thickness of 25 µm between the planes for the determination of tri-dimensional quantitative parameters of spermatids from two-dimensional sections.
Subsequently, the histological slides were mounted with 3 sections of each sampling with hematoxylin & eosin (HE) staining.
The assessment of the height of the germinal epithelium and calculation of the area of the seminiferous tubule was performed with the aid of an appropriate software (TsVieW).
Ten microscopic fields were chosen in each of the three histological sections to perform the analysis, which yielded a total of 360 fields in each group of rats.
The numerical density of the round spermatids (Nv[spermatids]), expressed as number of round spermatids per µm3 of testicular parenchyma, was calculated using the following formula:
Nv[spermatid] = ΣQ- A[spermatid] / Vol[disector](µm 3 )
In which:
ΣQ-A[spermatid] = number of spermatids
Vol[disector] = e. At
e = thickness of the micrometer
At = test area of the upper plane
Statistical analysis
Statistical analysis was performed by analysis of variance (ANOVA) and by using post-hoc Tukey’s honest significant difference (HSD). Parameters for each group were compared using a statistical significance threshold of less than 5% (P<0.05). Pearson (parametric) and Spearman (nonparametric) correlations were used to correlate numerical variables.
Results
None of the animals in the study died before they were killed, and the animals in older-age groups presented characteristics of aging, such as thinning of hair and hypoactivity.
Stereological analysis
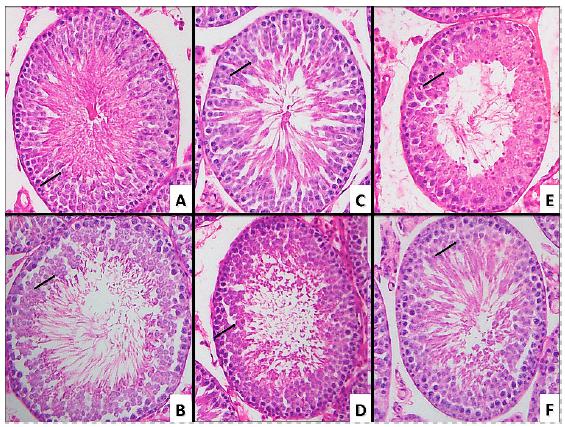
The numerical density of round spermatids was slightly lower in the 6 months group than in the 3 months group. The 9 and 12 months groups showed slightly higher numerical density of round spermatids than the 3 and 6 months groups. In the 18 and 24 months groups, the numerical density of round spermatids was significantly reduced (P<0.0001; Figure 1, and Tables 1 and 2). Figure 2 shows a sample of the photodocumentation of the testicular parenchyma.
Microscopic sample of testicular parenchyma of a rat from the (A) 3-months-old group, (B) 6-months-old group, (C) 9-months-old group, (D) 12-months-group, (E) 18-months-old group, (F) 24-months-old group. Showing a decrease in the number of spermatids (black arrows: round espermatids).
Morphometric analysis
The results of the macroscopic morphometric analysis (weight, dimensions, and volume) were not significantly different between the groups.
The height of the germinal epithelium, as assessed by microscopic analysis, was significantly reduced in the 18 months group (mean=100.06 μm) compared to that in the other groups. However, the 24 months group showed a significant increase (mean=108.21 μm) compared to the 18 months group, with a similar value to that observed in the groups with younger rats (Figure 3, and Tables 3 and 4).
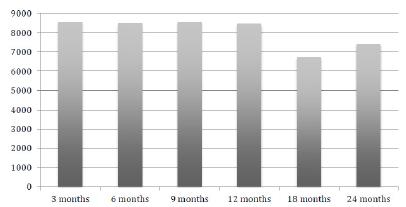
With regard to the tubular area, the results were similar to those found in the stereological analysis of the numerical density of spermatids. The 18 and 24 months groups showed a significant decrease in tubular area (6726.21 μm2 and 7395.75 μm2, respectively) compared to the other groups. However, unlike in the spermatids, the variation in the tubular area between the young and old rats was very slight (Figure 4, and Tables 5 and 6).
Discussion
To better understanding the aging process and its characteristics, it is necessary to conduct studies with long follow-up times and using subjects at different stages of life, which requires experimental animal. Since rats have a short biological cycle, their entire life cycle can be controlled and the changes in spermatogenesis with the passage of time can be compared. The design of the groups in the present study allowed us to examine the animals at critical moments such as young adult (3 months of age) and at old age (24 months of age)1414 Quinn R. Comparing rat's to human's age: how old is my rat in people years? Nutrition. 2005 Jun;21(6):775-7. doi: 10.1016/j.nut.2005.04.002.
https://doi.org/10.1016/j.nut.2005.04.00...
.
With an increase in the average life span and with couples tending to postpone conception, knowledge of the events occurring during spermatogenesis in aged populations and the consequences of aging on spermatogenesis has become important for both treatment and counseling. In a review article, Kovac et al. previously showed that, in addition to low seminal quality and histological changes, paternal aging also leads to an increased risk of miscarriages, genetic abnormalities, cancer, autism, and other psychiatric disorders in the offspring11 Kovac JR, Addai J, Smith RP, Coward RM, Lamb DJ, Lipshultz LI. The effects of advanced paternal age on fertility. Asian J Androl. 2013 Nov;15(6):723-8. doi: 10.1038/aja.2013.92.
https://doi.org/10.1038/aja.2013.92...
. Serre et al.1515 Serre V, Robaire B. Paternal age affects fertility and progeny outcome in the Brown Norway rat. Fertil Steril. 1998 Oct;70(4):625-31. PMID: 9797088. also found similar results in an animal study, which indicated an increase in the pre-implantation loss of the embryo, decrease in fetal weight, and increase in neonatal death in offspring generated by elderly animals.
Spermatogenesis and male fertility have been extensively studied, and the factors that alter them, such as varicocele, torsion of the testis, and cryptorchidism, have already been the targets of numerous studies1616 Al Bakri A, Lo K, Grober E, Cassidy D, Cardoso JP, Jarvi K. Time for improvement in semen parameters after varicocelectomy. J Urol. 2012 Jan;187(1):227-31. doi: 10.1016/j.juro.2011.09.041.
https://doi.org/10.1016/j.juro.2011.09.0...
17 Lorenzini F, Tambara Filho R, Gomes RP, Martino-Andrade AJ, Erdmann TR, Matias JE. Long-term effects of the testicular torsion on the spermatogenesis of the contralateral testis and the preventive value of the twisted testis orchiepididymectomy. Acta Cir Bras. 2012 Jun;27(6):388-95. PMID: 22666756.-1818 Penson DF, Lugg JA, Coyne C, Sadeghi F, Freedman AL, Gonzalez-Cadavid NF, Rajfer J. Effect of cryptorchidism on testicular histology in a naturally cryptorchid animal model. J Urol. 1997 Nov;158(5):1978-82. PMID: 9334653.. As a variable that affects all beings, aging has been the focus of various studies, which have indicated testicular changes and change in seminal quality with increasing age44 Jiang H, Zhu WJ, Li J, Chen QJ, Liang WB, Gu YQ. Quantitative histological analysis and ultrastructure of the aging human testis. Int Urol Nephrol. 2014 May;46(5):879-85. doi: 10.1007/s11255-013-0610-0.
https://doi.org/10.1007/s11255-013-0610-...
,1111 Xia Y, Zhu WJ, Hao SF, Liang WB, Li J. Stereological analysis of age-related changes of testicular peritubular cells in men. Arch Gerontol Geriatr. 2012 Jul-Aug;55(1):116-9. doi: 10.1016/j.archger.2011.05.005.
https://doi.org/10.1016/j.archger.2011.0...
,1919 Well D, Yang H, Houseni M, Iruvuri S, Alzeair S, Sansovini M, Wintering N, Alavi A, Torigian DA. Age-related structural and metabolic changes in the pelvic reproductive end organs. Semin Nucl Med. 2007 May;37(3):173-84. doi: 10.1053/j.semnuclmed.2007.01.004.
https://doi.org/10.1053/j.semnuclmed.200...
. However, most of these studies have only analyzed what occurs in older men or compared it to observations in young men without establishing a time point for when these changes occur. In the present study, we identified stability of the analyzed variables in the first four groups and a significant decrease in the same variables in the last two groups, which indicated that deterioration in spermatogenesis does not occur uniformly.
The results of the present study are also consistent with those of previous studies, which also revealed a regression in the quality of spermatogenesis and decrease in the number of germinal cells with age44 Jiang H, Zhu WJ, Li J, Chen QJ, Liang WB, Gu YQ. Quantitative histological analysis and ultrastructure of the aging human testis. Int Urol Nephrol. 2014 May;46(5):879-85. doi: 10.1007/s11255-013-0610-0.
https://doi.org/10.1007/s11255-013-0610-...
,2020 Levy S, Serre V, Hermo L, Robaire B. The effects of aging on the seminiferous epithelium and the blood-testis barrier of the Brown Norway rat. J Androl. 1999 May-Jun;20(3):356-65. PMID: 10386815.. Our study showed that the histology with regard to spermatogenesis remains unchanged in the period between puberty and the initial two-thirds of life and that there is a marked decline in the last one-third stage of life, which indicates that fertility in a 3-months-old rat and a 12-months-old rat is probably the same. In men, it can be inferred that this decline occurs between the fourth and sixth decade of life1414 Quinn R. Comparing rat's to human's age: how old is my rat in people years? Nutrition. 2005 Jun;21(6):775-7. doi: 10.1016/j.nut.2005.04.002.
https://doi.org/10.1016/j.nut.2005.04.00...
.
Cellular apoptosis is a component of normal spermatogenesis, and it maintains an appropriate number of germ cells and eliminates defective cells. An increase in apoptosis associated with a decrease in cell proliferation in aged testes leads to an imbalance and a consequent decrease in the number of germ cells2121 Pastor LM, Zuasti A, Ferrer C, Bernal-Mañas CM, Morales E, Beltrán-Frutos E, Seco-Rovira V. Proliferation and apoptosis in aged and photoregressed mammalian seminiferous epithelium, with particular attention to rodents and humans. Reprod Domest Anim. 2011 Feb;46(1):155-64. doi: 10.1111/j.1439-0531.2009.01573.x.
https://doi.org/10.1111/j.1439-0531.2009...
. The results of the present study show a reduction in the number of spermatids in aged testes, which is in agreement with previous literature that showed a decrease in the number of spermatids while the number of spermatogonia and spermatocytes remained stable when compared to that in young testes44 Jiang H, Zhu WJ, Li J, Chen QJ, Liang WB, Gu YQ. Quantitative histological analysis and ultrastructure of the aging human testis. Int Urol Nephrol. 2014 May;46(5):879-85. doi: 10.1007/s11255-013-0610-0.
https://doi.org/10.1007/s11255-013-0610-...
,2222 Kimura M, Itoh N, Takagi S, Sasao T, Takahashi A, Masumori N, Tsukamoto T. Balance of apoptosis and proliferation of germ cells related to spermatogenesis in aged men. J Androl. 2003 Mar-Apr;24(2):185-91. PMID: 12634304.. Furthermore, previously, Tomomasa et al.2323 Tomomasa H, Adachi Y, Oshio S, Umeda T, Irie H, Ishikawa H. Germ cell apoptosis in undescended testis: the origin of its impaired spermatogenesis in the TS inbred rat. J Urol. 2002 Jul;168(1):343-7. PMID: 12050567. analyzed the spermatogenesis of cryptorchid rats and found an increase in spermatocyte apoptosis as a cause of germinal cell reduction. Thus, the increase in spermatocyte apoptosis probably explains the results obtained in the present study.
Spermatogenesis is a self-renewing productive system that is maintained by stem cells (spermatogonial stem cells), which continually renew and produce other germ cells and, a priori, maintain their quality and quantity throughout life2424 Brinster RL. Germline stem cell transplantation and transgenesis. Science. 2002 Jun;296(5576):2174-6. doi: 10.1126/science.1071607.
https://doi.org/10.1126/science.1071607...
. In this study, we showed that a decrease in the number of spermatids occurs with aging. In a study involving the transplantation of stem cells from elderly rats into young mouse testes, Ryu et al.2525 Ryu BY, Orwig KE, Oatley JM, Avarbock MR, Brinster RL. Effects of aging and niche microenvironment on spermatogonial stem cell self-renewal. Stem Cells. 2006 Jun;24(6):1505-11. doi: 10.1634/stemcells.2005-0580.
https://doi.org/10.1634/stemcells.2005-0...
found that cells from the elderly rats in a young environment maintained spermatogenesis for another 3 years and concluded that the deterioration of spermatogenesis in elderly men is related to a deterioration of the testicular microenvironment.
Our results also indicate that, unlike spermatid counts, when the tubular area and height of the germinal epithelium were analyzed, there was either no difference or only a slight difference between the elderly rats and the young ones. In a previous study, Xia et al.1111 Xia Y, Zhu WJ, Hao SF, Liang WB, Li J. Stereological analysis of age-related changes of testicular peritubular cells in men. Arch Gerontol Geriatr. 2012 Jul-Aug;55(1):116-9. doi: 10.1016/j.archger.2011.05.005.
https://doi.org/10.1016/j.archger.2011.0...
analyzed the histopathology of the testes of men with advanced prostate cancer subjected to orchiectomy and compared them with the histopathologies of testicular biopsies of young men and found similar results; they therefore hypothesized connective tissue hyperplasia and interstitial laxity as an explanation for this finding.
One limitation of the present study is that we did not conduct seminal analysis. Nevertheless, we established, with follow-up time and stereological (three-dimensional) analysis, that the decrease in the number of spermatids and, consequently, the deterioration of spermatogenesis occurs in rats at 18 months of age. Further studies with more specific analyses aimed at determining the causes and consequences of this deterioration need to be conducted in the future.
Conclusions
The aging of the rats led to a deterioration of histological parameters of the spermatogenesis by a significant decrease in the number of round spermatids and a decrease in the area of the seminiferous tubules. Although, at the stage of life where there is the greater histological loss of the spermatogenesis there are no obvious clinical signs, this study showed that it occurs mainly at 18 months of age
References
-
1Kovac JR, Addai J, Smith RP, Coward RM, Lamb DJ, Lipshultz LI. The effects of advanced paternal age on fertility. Asian J Androl. 2013 Nov;15(6):723-8. doi: 10.1038/aja.2013.92.
» https://doi.org/10.1038/aja.2013.92 -
2Eskenazi B, Wyrobek AJ, Sloter E, Kidd SA, Moore L, Young S, Moore D. The association of age and semen quality in healthy men. Hum Reprod. 2003 Feb;18(2):447-54. PMID: 12571189.
-
3Plas E, Berger P, Hermann M, Pflüger H. Effects of aging on male fertility? Exp Gerontol. 2000 Aug;35(5):543-51. PMID: 10978677.
-
4Jiang H, Zhu WJ, Li J, Chen QJ, Liang WB, Gu YQ. Quantitative histological analysis and ultrastructure of the aging human testis. Int Urol Nephrol. 2014 May;46(5):879-85. doi: 10.1007/s11255-013-0610-0.
» https://doi.org/10.1007/s11255-013-0610-0 -
5O'Brien JH, Lazarou S, Deane L, Jarvi K, Zini A. Erectile dysfunction and andropause symptoms in infertile men. J Urol. 2005 Nov;174(5):1932-4. doi: 10.1097/01.ju.0000177453.14334.a2.
» https://doi.org/10.1097/01.ju.0000177453.14334.a2 -
6Beattie MC, Adekola L, Papadopoulos V, Chen H, Zirkin BR. Leydig cell aging and hypogonadism. Exp Gerontol. 2015 Aug;68:87-91. doi: 10.1016/j.exger.2015.02.014.
» https://doi.org/10.1016/j.exger.2015.02.014 -
7Hellstrom WJ, Overstreet JW, Sikka SC, Denne J, Ahuja S, Hoover AM, Sides GD, Cordell WH, Harrison LM, Whitaker JS. Semen and sperm reference ranges for men 45 years of age and older. J Androl. 2006 May-Jun;27(3):421-8. doi: 10.2164/jandrol.05156.
» https://doi.org/10.2164/jandrol.05156 -
8Lawson G, Fletcher R. Delayed fatherhood. J Fam Plann Reprod Health Care. 2014 Oct;40(4):283-8. doi: 10.1136/jfprhc-2013-100866.
» https://doi.org/10.1136/jfprhc-2013-100866 -
9Liu Z, Chang Q, Xu ZL, Zhang ZG. Stereological measurement of rat's seminiferous tubule. Chin Med J (Engl). 2009 Nov;122(21):2643-6. PMID: 19951585.
-
10Bechara GR, de Souza DB, Simoes M, Felix-Patrício B, Medeiros JL Jr, Costa WS, Sampaio FJ. Testicular morphology and spermatozoid parameters in spontaneously hypertensive rats treated with enalapril. J Urol. 2015 Nov;194(5):1498-503. doi: 10.1016/j.juro.2015.06.073.
» https://doi.org/10.1016/j.juro.2015.06.073 -
11Xia Y, Zhu WJ, Hao SF, Liang WB, Li J. Stereological analysis of age-related changes of testicular peritubular cells in men. Arch Gerontol Geriatr. 2012 Jul-Aug;55(1):116-9. doi: 10.1016/j.archger.2011.05.005.
» https://doi.org/10.1016/j.archger.2011.05.005 -
12Mattfeldt T, Mobius HJ, Mall G. Orthogonal triplet probes: an efficient method for unbiased estimation of length and surface of objects with unknown orientation in space. J Microsc. 1985 Sep;139(3):279-89. PMID: 3908688.
-
13Sterio DC. The unbiased estimation of number and sizes of arbitrary particles using the disector. J Microsc. 1984 May;134(2):127-36. PMID: 6737468.
-
14Quinn R. Comparing rat's to human's age: how old is my rat in people years? Nutrition. 2005 Jun;21(6):775-7. doi: 10.1016/j.nut.2005.04.002.
» https://doi.org/10.1016/j.nut.2005.04.002 -
15Serre V, Robaire B. Paternal age affects fertility and progeny outcome in the Brown Norway rat. Fertil Steril. 1998 Oct;70(4):625-31. PMID: 9797088.
-
16Al Bakri A, Lo K, Grober E, Cassidy D, Cardoso JP, Jarvi K. Time for improvement in semen parameters after varicocelectomy. J Urol. 2012 Jan;187(1):227-31. doi: 10.1016/j.juro.2011.09.041.
» https://doi.org/10.1016/j.juro.2011.09.041 -
17Lorenzini F, Tambara Filho R, Gomes RP, Martino-Andrade AJ, Erdmann TR, Matias JE. Long-term effects of the testicular torsion on the spermatogenesis of the contralateral testis and the preventive value of the twisted testis orchiepididymectomy. Acta Cir Bras. 2012 Jun;27(6):388-95. PMID: 22666756.
-
18Penson DF, Lugg JA, Coyne C, Sadeghi F, Freedman AL, Gonzalez-Cadavid NF, Rajfer J. Effect of cryptorchidism on testicular histology in a naturally cryptorchid animal model. J Urol. 1997 Nov;158(5):1978-82. PMID: 9334653.
-
19Well D, Yang H, Houseni M, Iruvuri S, Alzeair S, Sansovini M, Wintering N, Alavi A, Torigian DA. Age-related structural and metabolic changes in the pelvic reproductive end organs. Semin Nucl Med. 2007 May;37(3):173-84. doi: 10.1053/j.semnuclmed.2007.01.004.
» https://doi.org/10.1053/j.semnuclmed.2007.01.004 -
20Levy S, Serre V, Hermo L, Robaire B. The effects of aging on the seminiferous epithelium and the blood-testis barrier of the Brown Norway rat. J Androl. 1999 May-Jun;20(3):356-65. PMID: 10386815.
-
21Pastor LM, Zuasti A, Ferrer C, Bernal-Mañas CM, Morales E, Beltrán-Frutos E, Seco-Rovira V. Proliferation and apoptosis in aged and photoregressed mammalian seminiferous epithelium, with particular attention to rodents and humans. Reprod Domest Anim. 2011 Feb;46(1):155-64. doi: 10.1111/j.1439-0531.2009.01573.x.
» https://doi.org/10.1111/j.1439-0531.2009.01573.x -
22Kimura M, Itoh N, Takagi S, Sasao T, Takahashi A, Masumori N, Tsukamoto T. Balance of apoptosis and proliferation of germ cells related to spermatogenesis in aged men. J Androl. 2003 Mar-Apr;24(2):185-91. PMID: 12634304.
-
23Tomomasa H, Adachi Y, Oshio S, Umeda T, Irie H, Ishikawa H. Germ cell apoptosis in undescended testis: the origin of its impaired spermatogenesis in the TS inbred rat. J Urol. 2002 Jul;168(1):343-7. PMID: 12050567.
-
24Brinster RL. Germline stem cell transplantation and transgenesis. Science. 2002 Jun;296(5576):2174-6. doi: 10.1126/science.1071607.
» https://doi.org/10.1126/science.1071607 -
25Ryu BY, Orwig KE, Oatley JM, Avarbock MR, Brinster RL. Effects of aging and niche microenvironment on spermatogonial stem cell self-renewal. Stem Cells. 2006 Jun;24(6):1505-11. doi: 10.1634/stemcells.2005-0580.
» https://doi.org/10.1634/stemcells.2005-0580
-
Financial source:
none
-
1
Research performed at Laboratory of Anatomy and Experimental Surgery, Division of Urology, Department of Surgery, Universidade Federal do Paraná (UFPR), Curitiba-PR, Brazil. Part of Master degree thesis, Postgraduate Program in Surgical Clinic. Tutors: Rogério de Fraga and Fernando Lorenzini.
Publication Dates
-
Publication in this collection
Oct 2018
History
-
Received
09 June 2018 -
Reviewed
10 Aug 2018 -
Accepted
12 Sept 2018