Abstracts
OBJECTIVE: To compare the performance of the references (National Health and Nutrition Examination Survey I, National Center for Health Statistics/2000, International Obesity Task Force and Pesquisa Nacional sobre Saúde e Nutrição) to assess the nutritional status of children and adolescents with the new reference of body mass index values proposed by the World Health Organization in 2007. METHODS: Cross-sectional study that enrolled a non-probabilistic sample of 5,122 children and adolescents of low socioeconomic status. In the matrix study, sample size was calculated in order to identify the association between blood pressure changes and stunting in different nutritional status. This interim report relates to the comparison among different references for assessment of nutritional status. Cochran's Q, McNemar, chisquare and Kappa statistics were used to compare the proportion of underweight and overweight by different references and the agreement among them. RESULTS: The five references used in this study showed differences between them. Both for boys as for girls, the estimated prevalence of underweight by the Brazilian reference is much smaller than with the other references. For overweight girls, a higher prevalence was detected by the Pesquisa Nacional sobre Saúde e Nutrição reference, followed by the World Health Organization/2007. There was an excellent agreement (k>0.75) between the references regarding overweight, but the agreement among them regarding underweight was weak (k<0.40). CONCLUSIONS: The new reference of World Health Organization/2007 is appropriated for classifying nutritional disorders in Brazilian teenagers.
reference standards; adolescent; body mass index; overweight; malnutrition
OBJETIVO: Comparar o desempenho das referências (National Health and Nutrition Examination Survey I, National Center for Health Statistics/2000, International Obesity Task Force e Pesquisa Nacional sobre Saúde e Nutrição) para avaliação do estado nutricional de crianças e adolescentes à nova curva de valores de índice de massa corporal, proposta pela Organização Mundial da Saúde em 2007. MÉTODOS: Trata-se de um estudo transversal, cuja população foi constituída por uma amostra não probabilística, com 5.122 crianças e adolescentes de baixa renda. Foi realizado o cálculo do tamanho amostral visando identificar a associação entre alteração na pressão arterial e baixa estatura nos diferentes estados nutricionais. Compararam-se as diferentes referências para avaliação do estado nutricional. Foram aplicados os testes Q de Cochran, McNemar, qui-quadrado e índice Kappa para comparar as proporções e a concordância da classificação de baixo peso e excesso de peso com as diferentes referências. RESULTADOS: As cinco referências utilizadas no presente estudo apresentaram diferenças entre si. Tanto para meninos como para meninas, as prevalências estimadas de baixo peso pela referência da Pesquisa Nacional sobre Saúde e Nutrição foram bem menores que as outras referências. Quanto à prevalência de excesso de peso para os meninos, esta foi maior pela referência da Pesquisa Nacional sobre Saúde e Nutrição. Encontrou-se concordância excelente (k>0,75) entre a maioria das classificações para excesso de peso analisadas. Porém, a concordância entre as classificações para baixo peso apresentou-se fraca (k<0,40). CONCLUSÕES: A nova referência da Organização Mundial da Saúde é adequada para classificar os distúrbios nutricionais nos adolescentes brasileiros.
padrões de referência; adolescente; índice de massa corporal; sobrepeso; desnutrição
OBJETIVO: Comparar el desempeño de las referencias (NHA-NES I, NCHS/2000, IOTF y PNSN) para la evaluación del estado nutricional de niños y adolescentes con la nueva curva de valores del IMC, propuesta por la OMS en 2007. MÉTODOS: Se trata de un estudio transversal cuya pobla-ción fue constituida por una muestra no probabilística, con 5.122 niños y adolescentes de bajos ingresos. Se realizó el cálculo del tamaño de la muestra visando a identificar la asociación entre alteración en la presión arterial y la baja estatura en los distintos estados nutricionales mediante la estadística Odds Ratio. En el presente estudio, se compararon las distintas referencias para evaluación del estado nutricio-nal. Se aplicaron las pruebas Q de Cochran, McNemar, chi cuadrado e índice Kappa para comparar las proporciones y la concordancia de la clasificación de bajo peso y exceso de peso en las distintas referencias. RESULTADOS: Las cinco referencias utilizadas en el presente estudio presentaron diferencias entre sí. Tanto para los niños como para las niñas, las prevalencias estimadas de bajo peso por la referencia del PNSN son bastante menores que las otras referencias. Respecto a las prevalencias de exceso de peso para los niños, se observó la prevalencia mayor por la referencia PNSN. Cuando se utilizó la prueba de Kappa, se encontró la concordancia excelente (k>0.75) entre la mayoría de las clasificaciones para exceso de peso analizadas. Sin embargo, la concordancia entre las clasificaciones para bajo peso se presentódébil (k<0.40), sobre todo en el sexo masculino cuando se realizó la siguiente comparación: PNSN x OMS/2007. CONCLUSIONES: Los datos de este estudio indican que la nueva referencia OMS/2007 se muestra adecuada para la clasificación de los disturbios nutricionales en los adoles-centes brasileños.
estándares de referencia; adolescente; índice de masa corporal; sobrepeso; desnutrición
ORIGINAL ARTICLE
Body mass index of adolescents: comparison among different references
Índice de masa corporal de adolescentes: comparación entre distintas referencias
Ana Paula G. ClementeI; Carla Danusa L. SantosII; Ana Amélia Benedito-SilvaIII; Ana Lydia SawayaIV
Instituição: Universidade Federal de São Paulo (Unifesp), São Paulo, SP, Brasil
IMestre em Endocrinologia Clínica pelo Programa de Pós-Graduação em Endocrinologia Clínica da Unifesp, São Paulo, SP, Brasil
IIDoutora em Pediatria pelo Programa de Pós-Graduação em Pediatria e Ciências Aplicadas à Pediatria da Unifesp, São Paulo, SP, Brasil
IIIDoutora em Engenharia Elétrica pela Escola de Artes, Ciências e Humani-dades da Universidade de São Paulo (USP), São Paulo, SP, Brasil
IVDoutora em Nutrição pelo Departamento de Fisiologia da Unifesp; Profes-sora do Departamento de Fisiologia da Unifesp, São Paulo, SP, Brasil
Endereço para correspondência
ABSTRACT
OBJECTIVE: To compare the performance of the references (National Health and Nutrition Examination Survey I, Na-tional Center for Health Statistics/2000, International Obe-sity Task Force and Pesquisa Nacional sobre Saúde e Nutrição) to assess the nutritional status of children and adolescents with the new reference of body mass index values proposed by the World Health Organization in 2007.
METHODS: Cross-sectional study that enrolled a non-probabilistic sample of 5,122 children and adolescents of low socioeconomic status. In the matrix study, sample size was calculated in order to identify the association between blood pressure changes and stunting in different nutritional status. This interim report relates to the comparison among differ-ent references for assessment of nutritional status. Cochran's Q, McNemar, chi-square and Kappa statistics were used to compare the proportion of underweight and overweight by different references and the agreement among them.
RESULTS: The five references used in this study showed dif-ferences between them. Both for boys as for girls, the estimated prevalence of underweight by the Brazilian reference is much smaller than with the other references. For overweight girls, a higher prevalence was detected by the Pesquisa Nacional sobre Saúde e Nutrição reference, followed by the World Health Organization/2007. There was an excellent agree-ment (k>0.75) between the references regarding overweight, but the agreement among them regarding underweight was weak (k<0.40).
CONCLUSIONS: The new reference of World Health Organization/2007 is appropriated for classifying nutritional disorders in Brazilian teenagers.
Key-words: reference standards; adolescent; body mass index; overweight; malnutrition.
RESUMEN
OBJETIVO: Comparar el desempeño de las referencias (NHA-NES I, NCHS/2000, IOTF y PNSN) para la evaluación del estado nutricional de niños y adolescentes con la nueva curva de valores del IMC, propuesta por la OMS en 2007.
MÉTODOS: Se trata de un estudio transversal cuya pobla-ción fue constituida por una muestra no probabilística, con 5.122 niños y adolescentes de bajos ingresos. Se realizó el cálculo del tamaño de la muestra visando a identificar la asociación entre alteración en la presión arterial y la baja estatura en los distintos estados nutricionales mediante la estadística Odds Ratio. En el presente estudio, se compararon las distintas referencias para evaluación del estado nutricional. Se aplicaron las pruebas Q de Cochran, McNemar, chi cuadrado e índice Kappa para comparar las proporciones y la concordancia de la clasificación de bajo peso y exceso de peso en las distintas referencias.
RESULTADOS: Las cinco referencias utilizadas en el presente estudio presentaron diferencias entre sí. Tanto para los niños como para las niñas, las prevalencias estimadas de bajo peso por la referencia del PNSN son bastante menores que las otras referencias. Respecto a las prevalencias de exceso de peso para los niños, se observó la prevalencia mayor por la referencia PNSN. Cuando se utilizó la prueba de Kappa, se encontró la concordancia excelente (k>0.75) entre la mayoría de las clasificaciones para exceso de peso analizadas. Sin embargo, la concordancia entre las clasificaciones para bajo peso se presentódébil (k<0.40), sobre todo en el sexo masculino cuando se realizó la siguiente comparación: PNSN x OMS/2007.
CONCLUSIONES: Los datos de este estudio indican que la nueva referencia OMS/2007 se muestra adecuada para la clasificación de los disturbios nutricionales en los adoles-centes brasileños.
Palabras clave: estándares de referencia; adolescente; índice de masa corporal; sobrepeso; desnutrición.
Introduction
The latest Household Budget Survey conducted in Brazil (2002-2003) revealed an increase in the prevalence of overweight adolescents (16.7%) when compared to previous surveys (1974-1975: 3.9% and 1989: 8.3%). At the same time, there was a decrease in the prevalence of adolescents with deficit height-for-age (1974-1975: 33.5%; 1989: 20.5%; and 2002-2003: 10.8%) and underweight (1974-1975: 4.8%; 1989: 2.4%; and 2002-2003: 2.8%) over the three surveys(1). This increased prevalence of overweight adolescents requires practical diagnostic methods that allow the screening of at-risk individuals(1-6).
The anthropometric assessment of nutritional status in adolescents is a complex approach, because of the great variability of growth patterns and body size in this age group. This variability depends on the individual's nutritional status as well as on growth performance during childhood and hormonal factors related to the process of sexual maturation(1,5,7,8).
The World Health Organization (WHO), in 1995, suggested that the body mass index [BMI = weight (kg)/height (m2)] be used in the screening of overweight and obese adolescents, because this index is well correlated with body fat, easy to perform, and has reference values that allow a comparison between different populations and the use of this criterion for assessments in adulthood(9).
A comparison between different BMI reference values is therefore relevant to the field of public health intervention, given the diversity of classification systems in the literature and differences regarding the most appropriate BMI reference values for this phase of intense growth and development. Furthermore, ethnic and individual differences in the various stages of pubertal development also hinder the interpretation of anthropometric indices and indicators.
The objective of this study was to evaluate the performance of different criteria for assessing nutritional status in preadolescents and adolescents compared to the new BMI reference curve proposed by the WHO in 2007.
Method
This was a cross-sectional study, based on non-probability sampling, of 5,122 male and female low-income children and adolescents, aged seven to 19 years, who were attending public elementary school (fifth to ninth grades). Sample size was calculated aiming to identify an association between blood pressure changes (dependent variable) and stunting (independent variable) in different nutritional states using odds ratio (OR). However, in the present study, different reference values for the assessment of nutritional status were compared. Therefore, collective efforts were promoted to perform anthropometric measurements in 13 public schools between April 2006 and October 2007 in order to cover the population of individuals enrolled. Sample loss due to non-attendance or refusal amounted to 430 individuals, representing a 8% loss of the population of students enrolled.
Students diagnosed with chronic diseases that could interfere directly with weight and height and those individuals who, during examination, showed some physical limitation that could hinder anthropometric measurements were excluded from the study. The possibility of pregnancy was also investigated, and pregnant girls were excluded. Data were collected by two properly trained nutritionists.
Anthropometric measurements were performed according to the recommendations by Lohman et al(10). Weight was measured using an electronic scale (model SD-150; Country Technologies, Gay Mills, WI, USA), with a capacity of 150kg and accuracy of 100g. Height was measured using a standard stadiometer (model Alturexata) to the nearest 0.1cm. The students wore light clothing and were barefoot.
Nutritional status was classified on the basis of BMI-for-age and -sex, and the following reference curves were used: National Health and Nutrition Examination Survey (NHANES I)(11), National Center for Health Statistics (NCHS/2000)(12), International Obesity Task Force (IOTF)(7), Brazilian National Health and Nutrition Survey (Pesquisa Nacional de Saúde e Nutrição, PNSN)(8), and WHO/2007(13). Table 1 describes the cutoff points for the classification of underweight and overweight according to the classification systems used in the study.
Nutritional status was analyzed using Epi-Info, version 3.3.2, for NCHS/2000(12) reference values. For IOTF(7), PNSN(8), and WHO/2007(13) reference values, the respective tables with the proposed thresholds for age and sex were used. Statistical analysis was performed using SPSS, version 16. The Cochran Q test was used to compare the proportion of underweight and overweight subjects in the total sample among the classification systems used (NHANES I(11), NCHS/2000(12), IOTF(7), PNSN(8), and WHO/2007(13)). Whenever Cochran's Q was significant, the McNemar test was used to compare NHANES I(11), NCHS/2000(12), IOTF(7), and PNSN(8) with the new WHO/2007(13) reference values. The chi-square test was used to compare the proportion of underweight and overweight between sexes in the five references analyzed. Finally, the Kappa index was calculated to determine the degree of agreement between the different references used and WHO/2007 curve. This measure of agreement has a maximum value of 1, indicating complete agreement, and a minimum value of 0, indicating no agreement. Values <0.40 indicate poor agreement, 0.40-075 moderate agreement, and >0.75 excellent agreement(14). In all analysis, significance level was set at 5% (p<0.05).
The study was approved by the Research Ethics Committee of Universidade Federal de São Paulo, Brazil, in accordance with the Helsinki Declaration.
Results
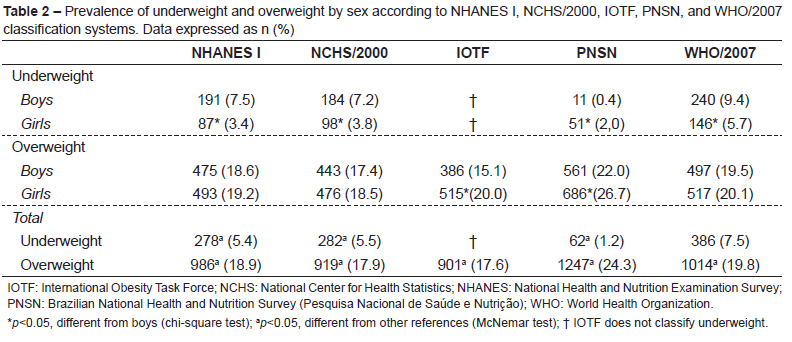
Table 2 shows the prevalence of underweight and overweight according to NHANES I, NCHS/2000, IOTF, PNSN, and WHO/2007 reference values. There was a significant difference in the prevalence of underweight between sexes for all references used: underweight was higher among boys for all references, except PNSN, in which underweight was higher among girls. On the other hand, the prevalence of overweight was significantly higher among girls when PNSN and IOTF reference values were used, whereas no difference between sexes was observed for the remaining references.
Table 2 also shows statistical differences between the prevalence of underweight and overweight in the references used and the new WHO/2007 reference values. Likewise, when WHO/2007 reference values were used, the prevalence of overweight was higher than that of other references, except PNSN, in which prevalence was much higher than that of WHO/2007.
Figure 1A shows the prevalence of underweight according to age for the references used. There was an increase in the prevalence of underweight in the age group 7-9 years compared to 9-12 years for all references analyzed, except PNSN, which showed very low means for all age groups. When WHO/2007 reference values were used, higher prevalence rates were observed throughout puberty, i.e., between age groups 9-12 years and 15-18 years. The Cochran Q test revealed a significant difference between all references and WHO/2007 for students aged > 9 years. It was not possible to perform the Cochran Q test for younger students (7-9 years of age) due to the small number of observations.
Figure 1B shows the prevalence of overweight according to age. There was a characteristic drop in the prevalence of overweight with increasing age. PNSN criteria showed a prevalence rate much higher than that of other references for age groups 7-9 years and 15-18 years. NCHS/2000 and IOTF showed the lowest prevalence of overweight for 7-9 years and 18-19 years, whereas WHO/2007 showed high prevalence of overweight, higher than that of NCHS/2000 and IOTF, but lower than that of PNSN, for 9-18 years. All references showed a significant difference when compared to WHO/2007 for age groups 9-12, 12-15, and 15-18 years.
Table 3 shows the Kappa coefficient of agreement for the classification systems assessed, with minimum values of 0.07 and maximum values of 0.97. Poor agreement was observed for the classification of underweight in males when PNSN reference values were used. Moderate agreement was obtained among females, although values were relatively lower when the PNSN classification system was used. On the other hand, excellent agreement was obtained for the classification of overweight with all references.
Discussion
Establishing the best reference for assessing the nutritional status of adolescents is a complex task. In practical terms, from the perspective of health services, simple, replicable, and reliable diagnostic criteria should be used. The choice of an appropriate classification system in health services is an important factor not only to prevent future nutritional disorders but also to avoid burdening the service with investigation and treatment of a large number of false-positive cases, mistakenly labeling several normal adolescents as patients at risk of nutrition-related complications(3,15,16).
It is well known that nutritional disorders during childhood and adolescence tend to persist into adulthood if not treated properly, leading to increased morbidity and mortality and decreased life expectancy(17,18). Thus, early detection of adolescents at nutritional risk, as well as the introduction of measures to manage this problem during adolescence, may lead to a more favorable prognosis in the long term. The later the detection of nutritional disorders, the harder it is to reverse the problem, because eating habits and metabolic changes are already established(15,17). For this reason, over the past decade several systems were introduced for the classification of nutritional status in adolescents, raising the need to compare their different reference values.
The five classifications systems analyzed in the present study showed significant differences among them. For both boys and girls, the estimated prevalence of underweight using PNSN reference values was much lower than that of other references. Similar prevalence of underweight was observed when NHANES I and NCHS/2000 reference values were used, but both systems showed lower prevalence rates compared to WHO/2007 for both sexes. Regarding overweight among girls, higher prevalence rates were observed using PNSN reference values, followed by WHO/2007, IOTF, NHANES I, and NCHS/2000. Prevalence of overweight among boys was higher using PNSN reference values, followed by WHO/2007, NHANES I, NCHS/2000, and IOTF.
NCHS/2000, IOTF and WHO/2007 classification systems, despite containing, in part, data from the same U.S. population of NHANES I, showed different results for the classification of underweight and overweight. Cutoff points appeared to be an important factor for differences observed among reference values for underweight and overweight, in addition to the fact that the classification systems had different cutoff points according to sex(7,8,11-13). On the other hand, new mathematical adjustments may also have contributed to these differences.
Furthermore, the trend of increasing obesity in the U.S. population, in particular, and in European countries over recent decades is also likely to be a factor underlying the differences observed in prevalence rates when the five classification systems were compared. The systems containing curves with weight data obtained after the increase in obesity observed in the 1980s may have underestimated the prevalence of obesity and overestimated the prevalence of malnutrition, even after adjustments to minimize this effect(7,11,12). For this reason, IOTF and WHO/2007 classification systems did not use recent data from anthropometric surveys in the U.S. population (1988-1994) for the construction of curves.
When the Kappa test was performed to analyze the degree of agreement among classification systems, excellent agreement (k>0.75) was obtained for the classification of overweight among most references. However, poor agreement (k<0.40) was observed for the classification of underweight mainly among males in the following comparison: PNSN x WHO/2007.
Altogether, the results of the different BMI criteria used in the assessment of nutritional status in adolescents, based on the comparison of NHANES I, NCHS/2000, IOTF, and PNSN with the new WHO/2007 reference values, showed good agreement in the classification of overweight. In addition, when WHO/2007 was used to classify underweight, similarly high values were obtained compared to other classification systems and significantly higher values were observed compared to PNSN. Thus, in addition to the advantages of a new mathematical treatment, the possibility of assessing individuals aged 0-19 years altogether, and a wide range of empirical data collected in several countries for the construction of the new WHO classification system, we highlight the advantage of having a single global reference that can serve as a basis for comparisons among different populations.
Therefore, data from this study indicate that the new WHO system is adequate to classify nutritional disorders in Brazilian adolescents, and the application of this classification system is recommended instead of previous references.
References
-
1Instituto Brasileiro de Geografia e Estatística (IBGE). Pesquisa de orçamentos familiares 2002-2003: antropometria e análise do estado nutricional de crianças e adolescentes no Brasil. Rio de Janeiro: IBGE; 2006.
- 2. da Veiga GV, da Cunha AS, Sichieri R. Trends in overweight among adolescents living in the poorest and richest regions of Brazil. Am J Public Health 2004;94:1544-8.
- 3. Vieira AC, Alvarez MM, de Marins VM, Sichieri R, da Veiga GV. Accuracy of different body mass index reference values to predict body fat in adolescents. Cad Saude Publica 2006;22:1681-90.
- 4. Veiga GV, Dias PC, dos Anjos LA. A comparison of distribution curves of body mass index from Brazil and United States for assessing overweight and obesity in Brazilian adolescents. Rev Panam Salud Publica 2001;10:79-85.
- 5. Chiara V, Sichieri R, Martins PD. Sensitivity and specificity of overweight classification of adolescents, Brazil. Rev Saude Publica 2003;37: 226-31.
- 6. Abrantes MM, Lamounier JA, Colosimo EA. Comparison of body mass index values proposed by Cole et al. (2000) and Must et al. (1991) for identifying obese children with weight-for-height index recommended by the World Health Organization. Public Health Nutr 2003;6:307-11.
- 7. Cole TJ, Bellizzi MC, Flegal KM, Dietz WH. Establishing a standard definition for child overweight and obesity worldwide: international survey. BMJ 2000;320:1240-3.
- 8. Conde WL, Monteiro CA. Body mass index cutoff points for evaluation of nutritional status in Brazilian children and adolescents. J Pediatr (Rio J) 2006;82:266-72.
- 9. Autoria não referida. Physical status: the use and interpretation of anthropometry. Report of a WHO Expert Committee. World Health Organ Tech Rep Ser 1995;854:1-452.
- 10. Lohman TG, Roche AF, Martorell R. Antropometric standartization reference manual. Illinois: Human Kinetics Books; 1988.
- 11. Must A, Dallal GE, Dietz WH. Reference data for obesity: 85th and 95th percentiles of body mass index (wt/ht2) and triceps skinfold thickness. Am J Clin Nutr 1991;53:839-46.
- 12. Kuczmarski RJ, Ogden CL, Grummer-Strawn LM, Flegal KM, Guo SS, Wei R et al. CDC growth charts: United States. Advance data from vital and health statistics. Hyattsville (Maryland): National Center for Health Statistics; 2000.
- 13. de Onis M, Onyango AW, Borghi E, Siyam A, Nishida C, Siekmann J. Development of a WHO growth reference for school-aged children and adolescents. Bull World Health Organ 2007;85:660-7.
- 14. Agresti A. Categorical data analysis. New Jersey: Wiley; 2002.
- 15. Sotelo YO, Colugnati FA, Taddei JA. Prevalence of overweight and obesity in public school pupils according to three anthropometric diagnostic criteria. Cad Saude Publica 2004;20:233-40.
- 16. Wang Y, Moreno LA, Caballero B, Cole TJ. Limitations of the current world health organization growth references for children and adolescents. Food Nutr Bull 2006;27 (Suppl 4):S175-88.
- 17. Sawaya AL, Roberts S. Stunting and future risk of obesity: principal physiological mechanisms. Cad Saude Publica 2003;19 (Suppl 1):S21-8.
- 18. Must A. Morbidity and mortality associated with elevated body weight in children and adolescents. Am J Clin Nutr 1996;63:S445-7.
Publication Dates
-
Publication in this collection
16 Feb 2012 -
Date of issue
June 2011
History
-
Received
18 Mar 2010 -
Accepted
08 Sept 2010