
ABSTRACT
Objective:
To compare the incidence of small for gestational age infants among late preterm and term newborns, using the Fenton and Intergrowth-21st curves.
Methods:
Observational and retrospective study with newborns in a level II maternity. The study was approved by the Institution’s Ethics Committee. Live births from July 2007 to February 2009 with a gestational age from 34 to 41 weeks and seven days were included. Neonates with incomplete data were excluded. Appropriate weight for gestational age was assessed by the Fenton and Intergrowth-21st intrauterine growth curves, considering birth weight <10th percentile as small for gestational age. The degree of agreement between the two curves was assessed by the Kappa coefficient. Numerical variables were compared using the Student t-test or the Mann-Whitney. Categorical variables were compared using the chi-square test. Statistical analyzes were performed using SPSS17® software, considering significant, p<0.05.
Results:
We included 2849 newborns with a birthweight of 3210±483 g, gestational age of 38.8±1.4 weeks; 51.1% male. The incidence of small for gestational age in the full sample was 13.0 vs. 8.7% (p<0.001, Kappa=0.667) by the Fenton and Intergrowth-21st curves, respectively. Among late preterm, the incidence of small neonates was 11.3 vs. 10.9% (p<0.001; Kappa=0.793) and among full-term infants it was 13.1% vs. 8.5% (p<0.001; Kappa=0.656), respectively for the Fenton and Intergrowth-21st curves.
Conclusions:
The incidence of small for gestational age newborns was significantly higher using the Fenton curve, with greater agreement between the Fenton and Intergrowth-21st curves among late preterm, compared to full term neonates.
Keywords:
Infant, newborn; Infant, small for gestational age; Fetal growth retardation; Incidence
RESUMO
Objetivo:
Comparar a incidência de neonatos pequenos para idade gestacional entre nascidos vivos pré-termo tardios e a termo utilizando as curvas de Fenton e Intergrowth-21st.
Métodos:
Estudo observacional retrospectivo com recém-nascidos de uma maternidade pública de nível secundário. Foram incluídos nascidos vivos de julho/2007 a fevereiro/2009 com idade gestacional de 34 a 41 semanas e seis dias. O estudo foi aprovado pelo Comitê de Ética da instituição. Foram excluídos recém-nascidos com dados incompletos. Para adequação do peso/da idade gestacional, utilizaram-se as curvas de crescimento intrauterino de Fenton e Intergrowth-21st, considerando-se pequeno aquele com peso ao nascer <10º percentil. O grau de concordância entre as duas curvas foi avaliado pelo coeficiente Kappa. As variáveis numéricas foram comparadas pelo teste t de Student ou de Mann-Whitney, conforme distribuição, e as categóricas pelo teste χ2. As análises estatísticas foram realizadas no programa Statistical Package for the Social Sciences (SPSS) 17®, considerando-se significante p<0,05.
Resultados:
Foram incluídos 2.849 recém-nascidos com peso ao nascer de 3210±483 g, idade gestacional de 38,8±1,4 semanas, sendo 51,1% masculinos. A incidência de recém-nascidos pequenos para a idade gestacional pela curva de Fenton e Intergrowth-21st na amostra total foi, respectivamente, de 13 e 8,7% (p<0,001; Kappa=0,667). Entre os pré-termo tardios, a incidência foi de 11,3 e 10,9% (p<0,001; Kappa=0,793) e entre os nascidos a termo foi de 13,1 e 8,5%, (p<0,001; Kappa=0,656), respectivamente, para as curvas de Fenton e Intergrowth-21st.
Conclusões:
A incidência de recém-nascidos pequenos para idade gestacional foi significantemente maior pela curva de Fenton, com maior concordância entre as curvas de Fenton e Intergrowth-21st em recém-nascidos pré-termo tardios do que nos nascidos a termo.
Palavras-chave:
Recém-nascido; Recém-nascido pequeno para a idade gestacional; Restrição de crescimento intrauterino; Incidência
INTRODUCTION
Estimates show that 15 million premature babies11. Kinney MV, Lawn JE, Howson CP, Belizan J. 15 Million preterm births annually: what has changed this year? Reprod Health. 2012;9:28. https://doi.org/10.1186/1742-4755-9-28
https://doi.org/https://doi.org/10.1186/...
and 32 million newborns (NBs) that are small for gestational age (SGA) are born annually in the world, corresponding to an incidence of 27% of SGA NBs among live births in low and middle income countries.22. Black RE. Global prevalence of small for gestational age births. Nestlé Nutr Inst Workshop Ser. 2015;81:1-7. https://doi.org/10.1159/000365790
https://doi.org/https://doi.org/10.1159/...
In the Brazilian context, three birth cohorts from 1982, 1993 and 2004 from Pelotas, RS, showed an incidence of SGA infants, defined as birth weight below the 10th percentile of the Williams et al. Curve,33. Williams RL, Creasy RK, Cunningham GC, Hawes WE, Norris FD, Tashiro M. Fetal growth and perinatal viability in California. Obstet Gynecol. 1982;59:624-32. of 14.8, 9.4 and 12%, respectively.44. Barros FC, Victora CG, Matijasevich A, Santos IS, Horta BL, Silveira MF, et al. Preterm births, low birth weight, and intrauterine growth restriction in three birth cohorts in Southern Brazil: 1982, 1993 and 2004. Cad Saude Publica. 2008;24 (Suppl 3):S390-8. http://dx.doi.org/10.1590/S0102-311X2008001500004
https://doi.org/http://dx.doi.org/10.159...
SGA NBs are five times more likely to die in the neonatal period and 4.7 times more likely to die in the first years of life when compared to newborns appropriate for gestational age.55. Boguszewski MC, Mericq V, Bergada I, Damiani D, Belgorosky A, Gunczler P, et al. Latin American Consensus: children born small for gestational age. BMC Pediatr. 2011;11:66. https://doi.org/10.1186/1471-2431-11-66
https://doi.org/https://doi.org/10.1186/...
In addition, survivors may be compromised with regard to their growth, and the development of chronic diseases in adulthood, such as type 2 diabetes, systemic arterial hypertension, obesity and cardiovascular diseases.66. Leonard H, Nassar N, Bourke J, Blair E, Mulroy S, Klerk N, et al. Relation between intrauterine growth and subsequent intellectual disability in a ten-year population cohort of children in Western Australia. Am J Epidemiol. 2008;167:103-11. https://doi.org/10.1093/aje/kwm245
https://doi.org/https://doi.org/10.1093/...
,77. Chen S, Liu Z, Zhu H, Yang H, Gong F, Wang L, et al. Height at three months can indicate overweight at two years in catch-up growth of small for gestational age infants. Sci Rep. 2018;8:13411. https://doi.org/10.1038/s41598-018-29698-8
https://doi.org/https://doi.org/10.1038/...
,88. Malacova E, Regan A, Nassar N, Raynes-Greenow C, Leonard H, Srinivasjois R, et al. Risk of stillbirth, preterm delivery, and fetal growth restriction following exposure in a previous birth: systematic review and meta-analysis. BJOG. 2018;125:183-92. https://doi.org/10.1111/1471-0528.14906
https://doi.org/https://doi.org/10.1111/...
The growth curves differ from each other in accordance with the type of population included and the design of the study adopted. The reference curves, such as Fenton’s,99. Fenton TR, Kim JH. A systematic review and meta-analysis to revise the Fenton growth chart for preterm infants. BMC Pediatr. 2013;13:59. https://doi.org/10.1186/1471-2431-13-59
https://doi.org/https://doi.org/10.1186/...
describe the growth of a sample of children without characterizing it as a normal pattern, and using cross-sections. Another type of curve represents a supposedly normal growth pattern for a population, such as the Intergrowth-21st curve.1010. Villar J, Ismail LC, Victora CG, Ohuma EO, Bertino E, Altman DG, et al. International standards for newborn weight, length, and head circumference by gestational age and sex: the Newborn Cross-Sectional Study of the INTERGROWTH-21st Project. Lancet. 2014;384:857-68. https://doi.org/10.1016/S0140-6736(14)60932-6
https://doi.org/https://doi.org/10.1016/...
The Fenton curve99. Fenton TR, Kim JH. A systematic review and meta-analysis to revise the Fenton growth chart for preterm infants. BMC Pediatr. 2013;13:59. https://doi.org/10.1186/1471-2431-13-59
https://doi.org/https://doi.org/10.1186/...
is based on the analysis of various intrauterine growth reference curves treated by means of a meta-analysis, with the inclusion of patients from developed countries. The population pattern includes European, North American, Canadian and Australian mothers. The Intergrowth-21st curve1010. Villar J, Ismail LC, Victora CG, Ohuma EO, Bertino E, Altman DG, et al. International standards for newborn weight, length, and head circumference by gestational age and sex: the Newborn Cross-Sectional Study of the INTERGROWTH-21st Project. Lancet. 2014;384:857-68. https://doi.org/10.1016/S0140-6736(14)60932-6
https://doi.org/https://doi.org/10.1016/...
was constructed based on a prospective, multiethnic population study, including several countries, such as Brazil, Italy, Oman, the United Kingdom, the United States, China, India and Kenya, and it was designed specifically to create an international growth pattern.
The choice of a certain intrauterine growth curve, among the countless existing ones,99. Fenton TR, Kim JH. A systematic review and meta-analysis to revise the Fenton growth chart for preterm infants. BMC Pediatr. 2013;13:59. https://doi.org/10.1186/1471-2431-13-59
https://doi.org/https://doi.org/10.1186/...
,1010. Villar J, Ismail LC, Victora CG, Ohuma EO, Bertino E, Altman DG, et al. International standards for newborn weight, length, and head circumference by gestational age and sex: the Newborn Cross-Sectional Study of the INTERGROWTH-21st Project. Lancet. 2014;384:857-68. https://doi.org/10.1016/S0140-6736(14)60932-6
https://doi.org/https://doi.org/10.1016/...
,1111. Battaglia FC, Lubchenco LO. A practical classification of newborn infants by weight and gestational age. J Pediatr. 1967;71:159-63. https://doi.org/10.1016/s0022-3476(67)80066-0
https://doi.org/https://doi.org/10.1016/...
,1212. Alexander GR, Himes JH, Kaufman RB, Mor J, Kogan M. A United States National Reference for fetal growth. Obstet Gynecol. 1996;87:163-8. https://doi.org/10.1016/0029-7844(95)00386-X
https://doi.org/https://doi.org/10.1016/...
,1313. Olsen IE, Groveman SA, Lawson ML, Clark RH, Zemel BS. New intrauterine growth curves based on United States data. Pediatrics. 2010;125:e214-24. https://doi.org/10.1542/peds.2009-0913
https://doi.org/https://doi.org/10.1542/...
can influence the incidence of SGA NBs in a population. Thus, in a retrospective cohort in Turkey, Tuzun et al.1414. Tuzun F, Yucesoy E, Baysal B, Kumral A, Duman N, Ozkan H. Comparison of INTERGROWTH-21 and Fenton growth standard to assess size at birth and extrauterine growth in very preterm infants. J Matern Fetal Neonatal Med. 2018;31:2252-7. https://doi.org/10.1080/14767058.2017.1339270
https://doi.org/https://doi.org/10.1080/...
found, among 248 preterm newborns with a mean gestational age of 29.1±2.1 weeks, there was a significantly higher rate of SGA newborns using the Intergrowth-21st curve1010. Villar J, Ismail LC, Victora CG, Ohuma EO, Bertino E, Altman DG, et al. International standards for newborn weight, length, and head circumference by gestational age and sex: the Newborn Cross-Sectional Study of the INTERGROWTH-21st Project. Lancet. 2014;384:857-68. https://doi.org/10.1016/S0140-6736(14)60932-6
https://doi.org/https://doi.org/10.1016/...
compared to Fenton’s curve99. Fenton TR, Kim JH. A systematic review and meta-analysis to revise the Fenton growth chart for preterm infants. BMC Pediatr. 2013;13:59. https://doi.org/10.1186/1471-2431-13-59
https://doi.org/https://doi.org/10.1186/...
(respectively, 12 vs. 15%; p = 0.004).
Considering this issue, the objective of the present study was to compare the incidence of SGA NB between late and full-term preterm live births, in a secondary level maternity hospital, using Fenton’s intrauterine growth curve99. Fenton TR, Kim JH. A systematic review and meta-analysis to revise the Fenton growth chart for preterm infants. BMC Pediatr. 2013;13:59. https://doi.org/10.1186/1471-2431-13-59
https://doi.org/https://doi.org/10.1186/...
and the Intergrowth-21stcurve.1010. Villar J, Ismail LC, Victora CG, Ohuma EO, Bertino E, Altman DG, et al. International standards for newborn weight, length, and head circumference by gestational age and sex: the Newborn Cross-Sectional Study of the INTERGROWTH-21st Project. Lancet. 2014;384:857-68. https://doi.org/10.1016/S0140-6736(14)60932-6
https://doi.org/https://doi.org/10.1016/...
METHOD
This is a retrospective observational study, with secondary analysis of data on live births from a public secondary maternity hospital, prospectively collected from July 2007 to February 2009, in the city of São Paulo, SP, Brazil. This maternity hospital is referred to for high-risk prenatal care and has 30 beds for joint accommodation. The neonatal unit has eight intermediate care beds and six intensive care beds.
This study was developed based on the project called Evaluation of the frequency of neonatal alloimmune neutropenia in Brazilian newborns, and received the NBs’ legal guardians’ signatures on the free and informed consent forms (FICF) (Research Ethics Committee - Comitê de Ética em Pesquisa - CEP - No. 0051/07). The current project was approved by the CEP of the Universidade Federal de São Paulo # 1,624/08, considering the FICF of the original project.
The inclusion criteria were: consecutive live births during the study period with a gestational age of 34 to 41 weeks and six days, and NBs whose parents or guardians signed the FICF for the original project. The chosen gestational age range aimed to include the common scope of the two curves proposed for the study. The exclusion criteria were: NB with missing gestational age, birth weight or sex. It is worth mentioning that, because the objective of the study was to verify the SGA incidence among live births, all live births were included.
The adequacy of weight to gestational age was assessed using the Fenton99. Fenton TR, Kim JH. A systematic review and meta-analysis to revise the Fenton growth chart for preterm infants. BMC Pediatr. 2013;13:59. https://doi.org/10.1186/1471-2431-13-59
https://doi.org/https://doi.org/10.1186/...
and Intergrowth-21st curves,1010. Villar J, Ismail LC, Victora CG, Ohuma EO, Bertino E, Altman DG, et al. International standards for newborn weight, length, and head circumference by gestational age and sex: the Newborn Cross-Sectional Study of the INTERGROWTH-21st Project. Lancet. 2014;384:857-68. https://doi.org/10.1016/S0140-6736(14)60932-6
https://doi.org/https://doi.org/10.1016/...
considering newborns appropriate for gestational age (AGA) those with a birth weight between the percentile 10 and 90. SGA was considered when birth weight was below the 10th percentile, and large for gestational age (LGA) was considered when weight was above the 90th percentile of those curves.1111. Battaglia FC, Lubchenco LO. A practical classification of newborn infants by weight and gestational age. J Pediatr. 1967;71:159-63. https://doi.org/10.1016/s0022-3476(67)80066-0
https://doi.org/https://doi.org/10.1016/...
Data on the maternal and newborn demographic and clinical characteristics of the original project’s Excel spreadsheets were analyzed. Such data had been collected according to the routine established in the hospital. Thus, maternal history was obtained from the parturient’s medical record, and was associated with maternal anamnesis and the consultation with the obstetrician on duty the day of the child’s birth. Demographic, clinical and anthropometric data were recorded by the pediatrician who received the newborn in the delivery room. Gestational age was assigned by the hospital’s neonatology team, which routinely considered the best obstetric estimate based on the date of the last menstrual period or ultrasound examination before 14 weeks.1010. Villar J, Ismail LC, Victora CG, Ohuma EO, Bertino E, Altman DG, et al. International standards for newborn weight, length, and head circumference by gestational age and sex: the Newborn Cross-Sectional Study of the INTERGROWTH-21st Project. Lancet. 2014;384:857-68. https://doi.org/10.1016/S0140-6736(14)60932-6
https://doi.org/https://doi.org/10.1016/...
In the absence of such data, the pediatrician considered the gestational age as assessed by the New Ballard method.1515. Ballard JL, Khoury JC, Wedig K, Wang L, Eilers-Walsman BL, Lipp R. New Ballard score, expanded to include extremely premature infants. J Pediatr. 1991;119:417-23. https://doi.org/10.1016/s0022-3476(05)82056-6
https://doi.org/https://doi.org/10.1016/...
For the number of live births of 3,434 in the period of the study, a 95% confidence level, a maximum acceptable error of 1% and an estimated percentage of SGA newborns of 10 to 15% in the Brazilian population,44. Barros FC, Victora CG, Matijasevich A, Santos IS, Horta BL, Silveira MF, et al. Preterm births, low birth weight, and intrauterine growth restriction in three birth cohorts in Southern Brazil: 1982, 1993 and 2004. Cad Saude Publica. 2008;24 (Suppl 3):S390-8. http://dx.doi.org/10.1590/S0102-311X2008001500004
https://doi.org/http://dx.doi.org/10.159...
,1616. Zambonato AM, Pinheiro RT, Horta BL, Tomasi E. Risk factors for small-for-gestational age births among infants in Brazil. Rev Saude Publica. 2004;38:24-9. http://dx.doi.org/10.1590/S0034-89102004000100004
https://doi.org/http://dx.doi.org/10.159...
,1717. Teixeira MP, Queiroga TP, Mesquita MA. Frequency and risk factors for the birth of small-for-gestational-age newborns in a public maternity hospital. Einstein (São Paulo). 2016;14:317-23. http://dx.doi.org/10.1590/S1679-45082016AO3684
https://doi.org/http://dx.doi.org/10.159...
,1818. Moreira Neto AR, Córdoba JC, Peraçoli JC. Intrauterine growth restriction etiology (IUGR). Comun Ciênc Saúde. 2011;22 (Supl 1):s21-30. the sample size calculated to estimate the incidence of SGA NBs was 1,723 to 2,019 live births.
The numerical variables were expressed as mean and standard deviation or median (minimum-maximum) and compared using the Student’s or Mann-Whitney test, according to the data distribution, assessed by the Kolmogorov-Smirnov test. Categorical variables were described in number and percentage and compared using the χ2 test. In order to verify the degree of agreement between the SGA incidences obtained by the Fenton and Intergrowth-21st curves, the Kappa coefficient was calculated. According to the value of the Kappa coefficient, the following were considered: insignificant agreement (Kappa=0 to 0.20), median agreement (0.21 to 0.40), moderate (0.41 to 0.60), substantial (0.61 to 0.80) and almost perfect (0.81 to 1.00).1919. Landis JR, Koch GG. The measurement of observer agreement for categorical data. Biometrics. 1977;33:159-74. http://dx.doi.org/10.2307/2529310
https://doi.org/http://dx.doi.org/10.230...
Statistical analyzes were performed using the program Statistical Package for the Social Sciences (SPSS) 17® (IBM SPSS Statistics, Somers, NY, United States). Statistical significance was set at p <0.05.
RESULTS
During the study period, 3,434 live NBs were born, of which 2,983 (86.9%) had complete data on gestational age, birth weight and sex. Of these, 134 (4.5%) NBs were excluded because they had a gestational age of less than 34 weeks or equal to or greater than 42 weeks. Thus, 2,849 late or full-term preterm infants were included, corresponding to 95.5% of live births with a known gestational age, birth weight and sex (Figure 1).

The mean maternal age was 25.5±6.5 years (minimum=12.0; maximum=46.0). Regarding gestational history, the median number of pregnancies was 2.0 (range=1-16), and the median number of deliveries was 1.0 (range = 0-15). The number of abortions ranged from zero to four, the number of fetal deaths ranged from zero to three, and the number of live children ranged from zero to fifteen. A total of 2,663 (93.5%) pregnant women had prenatal care with an average of 5.8 ± 3.0 appointments (median = 6; range = 0-17).
With regard to morbidity, 3.8% of pregnant women had chronic arterial hypertension, 2.3% had pregnant hypertensive disease, 0.6% had diabetes mellitus, 1.2% had gestational diabetes, 1.4% had intrauterine growth restriction, 2.7% had a urinary tract infection, 0.5% had placenta previa and 0.3% had placental abruption. The type of delivery was normal in 1,858 (65.2%) pregnant women, forceps in 97 (3.4%), and cesarean sections in 894 (31.4%) pregnant women.
Of the 2,849 NBs assessed in the study, 1,455 (51.1%) were male, had a birth weight of 3210±483 g (minimum=1320 g; maximum=5270 g) and the first minute Apgar score was 8.1±1.4 and the 5th minute was 9.2±0.9. The mean gestational age was 38.8±1.4 weeks (minimum=34.0 weeks; maximum=41.9 weeks), with 221 (7.8%) late preterm infants and 2,628 (92.2%) born at term.
The percentile of birth weight (39.8±25.6 vs. 52.3±28.4; p <0.001), length (26.9 ± 22.5 vs. 41.4 ± 30, 6; p <0.001) and head circumference (42.8 ± 29.5 vs. 58.7 ±, 2; p <0.001) of the total sample was, on average, lower in the newborns evaluated by the Fenton curve when compared to the results obtained by the Intergrowth-2st curve (Figure 2).
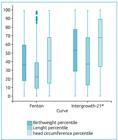
A boxplot with percentiles of birth weight, length and head circumference of newborns (n=2,849), showing significantly lower percentile values for the three parameters on the Fenton curve, compared to the Intergrowth-21st curve (p <0.001).
There was a significant difference (p <0.001) and moderate agreement (Kappa=0.554; standard error=0.020) in the distribution of birth weight/gestational age of 2,849 NBs, according to the Fenton and Intergrowth-21st curves. The distribution of 2,849 NBs using the Fenton curve was: AGA = 2,382 (83.6%; 95% confidence interval - 95% CI 82.2-84.9%), SGA=369 (13%; 95% CI 11.8-14.2%) and LGA=98 (3.4%; 95% CI 2.8-4.2%). Through the Intergrowth-21st curve, 2,290 (80.4%; 95% CI 78.9-81.8%) were AGA, 247 (8.7%; 95% CI 7.7-9.8%) were SGA and 312 (11%; 95% CI 9.9-12.2%) were LGA.
When only the incidence of SGA NBs was compared using the Fenton and Intergrowth-21st curves (13 vs. 8.7%, respectively, p <0.001), there was agreement between the two curves in 216 (7.6 %; 95% CI 6.7-8.6%) cases and a Kappa coefficient=0.677 (standard error = 0.023) (Figure 3A).

Distribution of percentages of live births, according to birth weight/gestational age, classified by the Fenton and Intergrowth-21st curves in (A) total sample, (B) among NB births at term and (C) among preterm NB (PT). Kappa coefficients (k) refer to the degree of agreement only for the classification of small newborns for gestational age (SGA) between the two curves. AGA: NB appropriate for gestational age; SGA: Small NB for gestational age; LGA: Large NB for gestational age.
The agreement between the two curves in the distribution of NBs was greater among late preterm NBs than between full-term NBs. Considering the 2,628 term newborns, according to the Fenton curve, the incidence of AGA newborns was 83.8% (95% CI 82.4-85.2%), for SGA it was 13.1% (95% CI 11.0 -14.4%) and for LGA it was 3.1% (95% CI 2.5-3.8%). Through the Intergrowth-21stcurve, 80.6% AGA newborns (95% CI 79-82.1%), 8.5% SGA newborns (95% CI 7.5-9.6%) and 10.9 % LGA (95% CI 9.8-12.2%) (p <0.001; Kappa = 0.532, standard error = 0.021;) were detected. There was agreement between the two curves in relation to SGA newborns in 196 (7.5%) cases (Kappa=0.656, standard error = 0.024) (Figure 3B).
According to the Fenton curve, among the 221 late preterm infants, 81% were AGA (95% CI 75.3-85.6%), 11.3% were SGA (95% CI 7.8-16.0%) and 7.7% were LGA (95% CI 4.9-12.0). Through the Intergrowth-21st curve, 77.8% were AGA (95%CI 71.9-82.8), 10.9% were SGA (95% CI 7.4-15.7) and 11.3% were LGA (95% CI 7.8-16.2) (p <0.001; Kappa=0.779; standard error=0.051). In 20 (9.0%) cases, there was agreement in the classification of SGA newborns using the two curves (Kappa=0.795, standard error=0.067) (Figure 3C).
The maternal and neonatal clinical characteristics of newborns classified as SGA by the two curves were similar, except for the greater proportion of males (57.2 vs. 48.6%; p=0.036) and higher birth weight values (2640±319 vs. 2464±312 g; p<0.001), length (46.4±21.3 vs. 45.6±2.3 cm; p<0.001) and head circumference (32.9±1.8 vs. 32.5± .7 cm; p=0.001) using the Fenton curve, as compared to the Intergrowth-21st curve.
Among the SGA newborns, the mean and standard deviation of the birth weight percentiles (4.5±2.8 vs. 4.5±3.0; p=0.796) and length (7.1±9.3 vs. 8.4 ± 13.2; p = 0.106) were similar in the two curves, respectively, the Fenton vs. the Intergrowth-21st. However, it was observed that the percentile of head circumference (19.7±21.6 vs. 28.7±28; p<0.001) was lower when evaluated by the Fenton curve (Figure 4).

Boxplot of weight percentile (p = 0.796), length (p = 0.106) and head circumference (p <0.001) at birth among newborns that were small for gestational age, according to the Fenton (n=369) and Intergrowth-21st curves (n = 247)
It was found that, among the SGA NBs, even when the birth weight was below the 10th percentile, there was a very large variation in the percentile of length and head circumference, with approximately 25 and 50% of the SGA NB reaching percentiles of length and head circumference above the 10th percentile (Figure 4).
The incidence of SGA/intrauterine growth restriction (IUGR) in the total number of newborns studied according to the adopted curve and the respective Kappa coefficients is shown in Table 1.
Incidence of newborns (NB) that were small for gestational age (SGA) and/or suffered from intrauterine growth restriction (IUGR) and the degree of agreement between the Fenton and Intergrowth-21st curves in the identification of SGA/IUGR newborns, according to the criterion used and the curve adopted (n = 2,849).
DISCUSSION
The results of the present study showed incidences of SGA NBs between late and full-term preterm live births, in a secondary level maternity hospital, using Fenton’s intrauterine growth99. Fenton TR, Kim JH. A systematic review and meta-analysis to revise the Fenton growth chart for preterm infants. BMC Pediatr. 2013;13:59. https://doi.org/10.1186/1471-2431-13-59
https://doi.org/https://doi.org/10.1186/...
and the Intergrowth-21st curves.1010. Villar J, Ismail LC, Victora CG, Ohuma EO, Bertino E, Altman DG, et al. International standards for newborn weight, length, and head circumference by gestational age and sex: the Newborn Cross-Sectional Study of the INTERGROWTH-21st Project. Lancet. 2014;384:857-68. https://doi.org/10.1016/S0140-6736(14)60932-6
https://doi.org/https://doi.org/10.1016/...
There was a statistically significant difference in the incidences detected by the Fenton99. Fenton TR, Kim JH. A systematic review and meta-analysis to revise the Fenton growth chart for preterm infants. BMC Pediatr. 2013;13:59. https://doi.org/10.1186/1471-2431-13-59
https://doi.org/https://doi.org/10.1186/...
and Intergrowth-21st curves,1010. Villar J, Ismail LC, Victora CG, Ohuma EO, Bertino E, Altman DG, et al. International standards for newborn weight, length, and head circumference by gestational age and sex: the Newborn Cross-Sectional Study of the INTERGROWTH-21st Project. Lancet. 2014;384:857-68. https://doi.org/10.1016/S0140-6736(14)60932-6
https://doi.org/https://doi.org/10.1016/...
however the agreement between the two curves was substantial.
The incidence of SGA newborns found in this research is compatible with some other Brazilian studies.44. Barros FC, Victora CG, Matijasevich A, Santos IS, Horta BL, Silveira MF, et al. Preterm births, low birth weight, and intrauterine growth restriction in three birth cohorts in Southern Brazil: 1982, 1993 and 2004. Cad Saude Publica. 2008;24 (Suppl 3):S390-8. http://dx.doi.org/10.1590/S0102-311X2008001500004
https://doi.org/http://dx.doi.org/10.159...
,1616. Zambonato AM, Pinheiro RT, Horta BL, Tomasi E. Risk factors for small-for-gestational age births among infants in Brazil. Rev Saude Publica. 2004;38:24-9. http://dx.doi.org/10.1590/S0034-89102004000100004
https://doi.org/http://dx.doi.org/10.159...
In Pelotas, Zambonato et al.1616. Zambonato AM, Pinheiro RT, Horta BL, Tomasi E. Risk factors for small-for-gestational age births among infants in Brazil. Rev Saude Publica. 2004;38:24-9. http://dx.doi.org/10.1590/S0034-89102004000100004
https://doi.org/http://dx.doi.org/10.159...
found a 13.1% prevalence of SGA births, considering SGA to be birth weight below the 10th percentile of the Williams curve.33. Williams RL, Creasy RK, Cunningham GC, Hawes WE, Norris FD, Tashiro M. Fetal growth and perinatal viability in California. Obstet Gynecol. 1982;59:624-32. At Hospital das Clínicas of the School of Medicine of the Universidade de São Paulo, Rodrigues et al.2020. Rodrigues FP, Martinelli S, Bittar RE, Francisco RP, Zugaib M. Comparison between two growth curves for small for gestational age diagnosis. Rev Bras Ginecol Obstet. 2015;37:59-63. http://dx.doi.org/10.1590/SO100-720320140005180
https://doi.org/http://dx.doi.org/10.159...
observed an incidence of SGA newborns for the 38-41 week gestational ranges of 18.8 vs. 14.2%, and for 37-41 weeks gestational ranges of 24.3 and 15.2%, respectively, with the Alexander et al. 1313. Olsen IE, Groveman SA, Lawson ML, Clark RH, Zemel BS. New intrauterine growth curves based on United States data. Pediatrics. 2010;125:e214-24. https://doi.org/10.1542/peds.2009-0913
https://doi.org/https://doi.org/10.1542/...
,1212. Alexander GR, Himes JH, Kaufman RB, Mor J, Kogan M. A United States National Reference for fetal growth. Obstet Gynecol. 1996;87:163-8. https://doi.org/10.1016/0029-7844(95)00386-X
https://doi.org/https://doi.org/10.1016/...
and Fenton curves.99. Fenton TR, Kim JH. A systematic review and meta-analysis to revise the Fenton growth chart for preterm infants. BMC Pediatr. 2013;13:59. https://doi.org/10.1186/1471-2431-13-59
https://doi.org/https://doi.org/10.1186/...
Such data showed an incidence close to that found in this study for the Fenton curve99. Fenton TR, Kim JH. A systematic review and meta-analysis to revise the Fenton growth chart for preterm infants. BMC Pediatr. 2013;13:59. https://doi.org/10.1186/1471-2431-13-59
https://doi.org/https://doi.org/10.1186/...
in term NBs.
However, other studies have found a higher incidence of SGA NB. For example, Teixeira et al.1717. Teixeira MP, Queiroga TP, Mesquita MA. Frequency and risk factors for the birth of small-for-gestational-age newborns in a public maternity hospital. Einstein (São Paulo). 2016;14:317-23. http://dx.doi.org/10.1590/S1679-45082016AO3684
https://doi.org/http://dx.doi.org/10.159...
indicated a 17.9% frequency of SGA newborns in a public maternity hospital in São Paulo, using the curve of Alexander et al.1212. Alexander GR, Himes JH, Kaufman RB, Mor J, Kogan M. A United States National Reference for fetal growth. Obstet Gynecol. 1996;87:163-8. https://doi.org/10.1016/0029-7844(95)00386-X
https://doi.org/https://doi.org/10.1016/...
Kozuki et al.2121. Kozuki N, Katz J, Christian P, Lee AC, Liu L, Silveira MF, et al. Comparison of US Birth Weight References and the International Fetal and Newborn Growth Consortium for the 21st Century Standard. JAMA Pediatr. 2015;169:e151438. https://doi.org/10.1001/jamapediatrics.2015.1438
https://doi.org/https://doi.org/10.1001/...
reached a 23.7% prevalence of SGA newborns using the Intergrowth-21st curve,1010. Villar J, Ismail LC, Victora CG, Ohuma EO, Bertino E, Altman DG, et al. International standards for newborn weight, length, and head circumference by gestational age and sex: the Newborn Cross-Sectional Study of the INTERGROWTH-21st Project. Lancet. 2014;384:857-68. https://doi.org/10.1016/S0140-6736(14)60932-6
https://doi.org/https://doi.org/10.1016/...
compared with 32.8% using the Alexander et al. curve1212. Alexander GR, Himes JH, Kaufman RB, Mor J, Kogan M. A United States National Reference for fetal growth. Obstet Gynecol. 1996;87:163-8. https://doi.org/10.1016/0029-7844(95)00386-X
https://doi.org/https://doi.org/10.1016/...
and 36% using the Oken et al. curve2222. Oken E, Kleinman KP, Rich-Edwards J, Gillman MW. A nearly continuous measure of birth weight for gestational age using a United States national reference. BMC Pediatr. 2003;3:6. https://doi.org/10.1186/1471-2431-3-6
https://doi.org/https://doi.org/10.1186/...
in 16 prospective cohorts from ten low- and middle-income countries. This shows that studies using the Alexander et al. curve1212. Alexander GR, Himes JH, Kaufman RB, Mor J, Kogan M. A United States National Reference for fetal growth. Obstet Gynecol. 1996;87:163-8. https://doi.org/10.1016/0029-7844(95)00386-X
https://doi.org/https://doi.org/10.1016/...
had a higher incidence of SGA NBs, possibly because it is a personalized curve for the American population, with greater weight and height than most of the other populations evaluated. This demonstrates the influence of population type included in the construction of the curves with regard to the incidence of SGA NB. In New Zealand, Anderson et al.2323. Anderson NH, Sadler LC, McKinlay CJ, McCowan LM. INTERGROWTH-21st vs customized birthweight standards for identification of perinatal mortality and morbidity. Am J Obstet Gynecol. 2016;214:509.e1-509.e7. https://doi.org/10.1016/j.ajog.2015.10.931
https://doi.org/https://doi.org/10.1016/...
found a 4.5% SGA NB incidence through using the Intergrowth-21st curve and 11.6% through using Gardosi et al.2424. Gardosi J, Mongelli M, Wilcox M, Chang A. An adjustable fetal weight standard. Ultrasound Obstet Gynecol. 1995;6:168-74. https://doi.org/10.1046/j.1469-0705.1995.06030168.x
https://doi.org/https://doi.org/10.1046/...
In a population study in Kobe, Japan, with 27,288 children, the prevalence of birth weight or length for gestational age below -2 standard deviations was 3%.2525. Fujita K, Nagasaka M, Iwatani S, Koda T, Kurokawa D, Yamana K, et al. Prevalence of small for gestational age (SGA) and short stature in children born SGA who qualify for growth hormone treatment at 3 years of age: Population-based study. Pediatr Int. 2016;58:372-6. https://doi.org/10.1111/ped.12859
https://doi.org/https://doi.org/10.1111/...
Therefore, the incidence of SGA infants depends on the definition criteria, the selection of the curve used, and the socioeconomic, environmental and health conditions of the population studied.
In this sense, in the present study, there was a difference in incidence identified by the Fenton curve99. Fenton TR, Kim JH. A systematic review and meta-analysis to revise the Fenton growth chart for preterm infants. BMC Pediatr. 2013;13:59. https://doi.org/10.1186/1471-2431-13-59
https://doi.org/https://doi.org/10.1186/...
and by that of Intergrowth-21st,1010. Villar J, Ismail LC, Victora CG, Ohuma EO, Bertino E, Altman DG, et al. International standards for newborn weight, length, and head circumference by gestational age and sex: the Newborn Cross-Sectional Study of the INTERGROWTH-21st Project. Lancet. 2014;384:857-68. https://doi.org/10.1016/S0140-6736(14)60932-6
https://doi.org/https://doi.org/10.1016/...
since the models for the construction of these curves differed.
In addition, another factor that may have contributed to the difference in the incidence of SGA NB between the two curves is the composition of the gestational age ranges included in its construction. The Intergrowth-21st curve1010. Villar J, Ismail LC, Victora CG, Ohuma EO, Bertino E, Altman DG, et al. International standards for newborn weight, length, and head circumference by gestational age and sex: the Newborn Cross-Sectional Study of the INTERGROWTH-21st Project. Lancet. 2014;384:857-68. https://doi.org/10.1016/S0140-6736(14)60932-6
https://doi.org/https://doi.org/10.1016/...
covered a small number of newborns with a gestational age of less than 33 weeks, and its accuracy in classifying the neonatal population was limited to gestational ages of less than 33 weeks. This restriction no longer exists today, because, subsequently, an extension of the curve for extreme premature infants was published using the same methodology as the original curve, and was available for use in premature infants with 24 weeks of gestational age or more.2626. Villar J, Giuliani F, Fenton TR, Ohuma EO, Ismail LC, Kennedy SH, et al. Intergrowth-21st very preterm size at birth reference charts. Lancet. 2016; 27;387:844-5. https://doi.org/10.1016/S0140-6736(16)00384-6
https://doi.org/https://doi.org/10.1016/...
The Fenton curve99. Fenton TR, Kim JH. A systematic review and meta-analysis to revise the Fenton growth chart for preterm infants. BMC Pediatr. 2013;13:59. https://doi.org/10.1186/1471-2431-13-59
https://doi.org/https://doi.org/10.1186/...
mirrors the intrauterine curves between 24 and 36 weeks of gestational age, however, after 36 weeks, it shows important differentiation in growth, perhaps due to the physiological aspects of postpartum newborns. In addition, the mathematical process of smoothing the Fenton curve99. Fenton TR, Kim JH. A systematic review and meta-analysis to revise the Fenton growth chart for preterm infants. BMC Pediatr. 2013;13:59. https://doi.org/10.1186/1471-2431-13-59
https://doi.org/https://doi.org/10.1186/...
may not actually reflect normal growth after 36 weeks of gestational age, because it was constructed with cross-sectional data of children born prematurely and, as such, does not correspond to normal conditions.2727. Fenton TR, Nasser R, Eliasziw M, Kim JH, Bilan D, Sauve R. Validating the weight gain of preterm infants between the reference growth curve of the fetus and the term infant. BMC Pediatr. 2013;13:92. https://doi.org/10.1186/1471-2431-13-92
https://doi.org/https://doi.org/10.1186/...
This limitation can be observed in the present study, when the incidence and degree of agreement between term and late preterm newborns were compared separately. In the present study, the difference in the incidence of SGA NBs between late preterm NBs decreased from 11.3% using the Fenton curve to 10.9% using the Intergrowth-21st curve, and the degree of agreement increased (Kappa=0.793). However, among term NBs, the difference in the incidence of SGA NBs between the two curves persisted (13.1 vs. 8.5%), and the degree of agreement was lower than in preterm (Kappa=0.656). These results suggest that the two curves similarly assess gestational weight/age adequacy and show less agreement when it comes to term pregnancy.
Thus, despite the difficulty in choosing the best intrauterine growth curve, in our context the standard Intergrowth-21st curve1010. Villar J, Ismail LC, Victora CG, Ohuma EO, Bertino E, Altman DG, et al. International standards for newborn weight, length, and head circumference by gestational age and sex: the Newborn Cross-Sectional Study of the INTERGROWTH-21st Project. Lancet. 2014;384:857-68. https://doi.org/10.1016/S0140-6736(14)60932-6
https://doi.org/https://doi.org/10.1016/...
seems to be a better option for late and full-term preterm infants, since this curve was carefully standardized in order to reflect standard intrauterine growth. It included Brazilian pregnant women, and women from other nationalities, and it contemplated the gestational age range studied here. Thus, although the objective of the present study was only to compare the incidences of SGA NBs detected by the two curves, because of the population characteristics and the gestational age range evaluated, in addition to the specificities of the construction of the curves used, it can be assumed that the incidence of SGA NBs in the population studied would be 8 to 10%, according to the 95%CI of the incidence detected by the Intergrowth-21st curve.1010. Villar J, Ismail LC, Victora CG, Ohuma EO, Bertino E, Altman DG, et al. International standards for newborn weight, length, and head circumference by gestational age and sex: the Newborn Cross-Sectional Study of the INTERGROWTH-21st Project. Lancet. 2014;384:857-68. https://doi.org/10.1016/S0140-6736(14)60932-6
https://doi.org/https://doi.org/10.1016/...
Among the SGA newborns identified by the two curves, length was also below the 10th percentile in about 75% of cases. Head circumference was above the 10th percentile in more than 50% of cases, with some NBs reaching the 98th to 99th percentiles on the Fenton99. Fenton TR, Kim JH. A systematic review and meta-analysis to revise the Fenton growth chart for preterm infants. BMC Pediatr. 2013;13:59. https://doi.org/10.1186/1471-2431-13-59
https://doi.org/https://doi.org/10.1186/...
and Intergrowth-21st curves,1010. Villar J, Ismail LC, Victora CG, Ohuma EO, Bertino E, Altman DG, et al. International standards for newborn weight, length, and head circumference by gestational age and sex: the Newborn Cross-Sectional Study of the INTERGROWTH-21st Project. Lancet. 2014;384:857-68. https://doi.org/10.1016/S0140-6736(14)60932-6
https://doi.org/https://doi.org/10.1016/...
respectively, suggesting a brain protection mechanism. Such data refer to the need to differentiate the SGA NBs in isolation from the ones who suffered from IUGR, to define follow-up strategies.2525. Fujita K, Nagasaka M, Iwatani S, Koda T, Kurokawa D, Yamana K, et al. Prevalence of small for gestational age (SGA) and short stature in children born SGA who qualify for growth hormone treatment at 3 years of age: Population-based study. Pediatr Int. 2016;58:372-6. https://doi.org/10.1111/ped.12859
https://doi.org/https://doi.org/10.1111/...
,2828. Shoji H, Watanabe A, Awaji A, Ikeda N, Hosozawa M, Ohkawa N, et al. Intrauterine growth restriction affects z-scores of anthropometric parameters during the first 6 years in very low-birth-weight-children born at less than 30 weeks of gestation. J Dev Orig Health Dis. 2019;24:1-5. https://doi.org/10.1017/S2040174419000369
https://doi.org/https://doi.org/10.1017/...
As such, the use of the definition criteria for IUGR by Beune et al.2929. Beune IM, Bloomfield FH, Ganzevoort W, Embleton ND, Rozance PJ, van Wassenaer-Leemhuis AG, et al. Consensus based definition of growth restriction in the newborn. J Paediatr Child Health. 2018;196:71-6. https://doi.org/10.1111/jpc.13882_16
https://doi.org/https://doi.org/10.1111/...
showed that, among the SGA newborns, 22 to 30% presented IUGR, making the incidence of 2.5 to 3.9% of newborns with IUGR depending on the criterion and curves adopted. Such data show that, although the sample of the present study was collected in a secondary-level hospital, the frequency of maternal morbidity and IUGR was relevant, possibly because it meets high-risk prenatal care. In addition, the incidence of SGA NBs among full-term NBs found here was close to that observed at the Hospital das Clínicas from the School of Medicine of the Universidade de São Paulo,2020. Rodrigues FP, Martinelli S, Bittar RE, Francisco RP, Zugaib M. Comparison between two growth curves for small for gestational age diagnosis. Rev Bras Ginecol Obstet. 2015;37:59-63. http://dx.doi.org/10.1590/SO100-720320140005180
https://doi.org/http://dx.doi.org/10.159...
when the Fenton curve was used 99. Fenton TR, Kim JH. A systematic review and meta-analysis to revise the Fenton growth chart for preterm infants. BMC Pediatr. 2013;13:59. https://doi.org/10.1186/1471-2431-13-59
https://doi.org/https://doi.org/10.1186/...
As limitations of the study, it is possible to consider the retrospective design and the analysis of secondary data, which may have compromised the accuracy of the collected data. Another limiting factor was the fact that the sample studied was collected ten years ago and in a single center, with no guarantees of external validity of the study. As positive points, we highlight the sample size and the inclusion of 95% of live NBs who met the inclusion criteria, in addition to the sample calculation, which ensured the internal validity of the study.
In conclusion, it can be said that the incidence of SGA newborns ranged from 8.7 to 13%, with a significant difference in incidence and moderate agreement in the distribution of birth weight adequacy to gestational age, assessed by the Fenton99. Fenton TR, Kim JH. A systematic review and meta-analysis to revise the Fenton growth chart for preterm infants. BMC Pediatr. 2013;13:59. https://doi.org/10.1186/1471-2431-13-59
https://doi.org/https://doi.org/10.1186/...
and Intergrowth-21st curves.1010. Villar J, Ismail LC, Victora CG, Ohuma EO, Bertino E, Altman DG, et al. International standards for newborn weight, length, and head circumference by gestational age and sex: the Newborn Cross-Sectional Study of the INTERGROWTH-21st Project. Lancet. 2014;384:857-68. https://doi.org/10.1016/S0140-6736(14)60932-6
https://doi.org/https://doi.org/10.1016/...
Furthermore, the agreement in the identification of SGA newborns is higher among late preterm newborns when compared to that observed in term newborns.
REFERENCES
-
1Kinney MV, Lawn JE, Howson CP, Belizan J. 15 Million preterm births annually: what has changed this year? Reprod Health. 2012;9:28. https://doi.org/10.1186/1742-4755-9-28
» https://doi.org/https://doi.org/10.1186/1742-4755-9-28 -
2Black RE. Global prevalence of small for gestational age births. Nestlé Nutr Inst Workshop Ser. 2015;81:1-7. https://doi.org/10.1159/000365790
» https://doi.org/https://doi.org/10.1159/000365790 -
3Williams RL, Creasy RK, Cunningham GC, Hawes WE, Norris FD, Tashiro M. Fetal growth and perinatal viability in California. Obstet Gynecol. 1982;59:624-32.
-
4Barros FC, Victora CG, Matijasevich A, Santos IS, Horta BL, Silveira MF, et al. Preterm births, low birth weight, and intrauterine growth restriction in three birth cohorts in Southern Brazil: 1982, 1993 and 2004. Cad Saude Publica. 2008;24 (Suppl 3):S390-8. http://dx.doi.org/10.1590/S0102-311X2008001500004
» https://doi.org/http://dx.doi.org/10.1590/S0102-311X2008001500004 -
5Boguszewski MC, Mericq V, Bergada I, Damiani D, Belgorosky A, Gunczler P, et al. Latin American Consensus: children born small for gestational age. BMC Pediatr. 2011;11:66. https://doi.org/10.1186/1471-2431-11-66
» https://doi.org/https://doi.org/10.1186/1471-2431-11-66 -
6Leonard H, Nassar N, Bourke J, Blair E, Mulroy S, Klerk N, et al. Relation between intrauterine growth and subsequent intellectual disability in a ten-year population cohort of children in Western Australia. Am J Epidemiol. 2008;167:103-11. https://doi.org/10.1093/aje/kwm245
» https://doi.org/https://doi.org/10.1093/aje/kwm245 -
7Chen S, Liu Z, Zhu H, Yang H, Gong F, Wang L, et al. Height at three months can indicate overweight at two years in catch-up growth of small for gestational age infants. Sci Rep. 2018;8:13411. https://doi.org/10.1038/s41598-018-29698-8
» https://doi.org/https://doi.org/10.1038/s41598-018-29698-8 -
8Malacova E, Regan A, Nassar N, Raynes-Greenow C, Leonard H, Srinivasjois R, et al. Risk of stillbirth, preterm delivery, and fetal growth restriction following exposure in a previous birth: systematic review and meta-analysis. BJOG. 2018;125:183-92. https://doi.org/10.1111/1471-0528.14906
» https://doi.org/https://doi.org/10.1111/1471-0528.14906 -
9Fenton TR, Kim JH. A systematic review and meta-analysis to revise the Fenton growth chart for preterm infants. BMC Pediatr. 2013;13:59. https://doi.org/10.1186/1471-2431-13-59
» https://doi.org/https://doi.org/10.1186/1471-2431-13-59 -
10Villar J, Ismail LC, Victora CG, Ohuma EO, Bertino E, Altman DG, et al. International standards for newborn weight, length, and head circumference by gestational age and sex: the Newborn Cross-Sectional Study of the INTERGROWTH-21st Project. Lancet. 2014;384:857-68. https://doi.org/10.1016/S0140-6736(14)60932-6
» https://doi.org/https://doi.org/10.1016/S0140-6736(14)60932-6 -
11Battaglia FC, Lubchenco LO. A practical classification of newborn infants by weight and gestational age. J Pediatr. 1967;71:159-63. https://doi.org/10.1016/s0022-3476(67)80066-0
» https://doi.org/https://doi.org/10.1016/s0022-3476(67)80066-0 -
12Alexander GR, Himes JH, Kaufman RB, Mor J, Kogan M. A United States National Reference for fetal growth. Obstet Gynecol. 1996;87:163-8. https://doi.org/10.1016/0029-7844(95)00386-X
» https://doi.org/https://doi.org/10.1016/0029-7844(95)00386-X -
13Olsen IE, Groveman SA, Lawson ML, Clark RH, Zemel BS. New intrauterine growth curves based on United States data. Pediatrics. 2010;125:e214-24. https://doi.org/10.1542/peds.2009-0913
» https://doi.org/https://doi.org/10.1542/peds.2009-0913 -
14Tuzun F, Yucesoy E, Baysal B, Kumral A, Duman N, Ozkan H. Comparison of INTERGROWTH-21 and Fenton growth standard to assess size at birth and extrauterine growth in very preterm infants. J Matern Fetal Neonatal Med. 2018;31:2252-7. https://doi.org/10.1080/14767058.2017.1339270
» https://doi.org/https://doi.org/10.1080/14767058.2017.1339270 -
15Ballard JL, Khoury JC, Wedig K, Wang L, Eilers-Walsman BL, Lipp R. New Ballard score, expanded to include extremely premature infants. J Pediatr. 1991;119:417-23. https://doi.org/10.1016/s0022-3476(05)82056-6
» https://doi.org/https://doi.org/10.1016/s0022-3476(05)82056-6 -
16Zambonato AM, Pinheiro RT, Horta BL, Tomasi E. Risk factors for small-for-gestational age births among infants in Brazil. Rev Saude Publica. 2004;38:24-9. http://dx.doi.org/10.1590/S0034-89102004000100004
» https://doi.org/http://dx.doi.org/10.1590/S0034-89102004000100004 -
17Teixeira MP, Queiroga TP, Mesquita MA. Frequency and risk factors for the birth of small-for-gestational-age newborns in a public maternity hospital. Einstein (São Paulo). 2016;14:317-23. http://dx.doi.org/10.1590/S1679-45082016AO3684
» https://doi.org/http://dx.doi.org/10.1590/S1679-45082016AO3684 -
18Moreira Neto AR, Córdoba JC, Peraçoli JC. Intrauterine growth restriction etiology (IUGR). Comun Ciênc Saúde. 2011;22 (Supl 1):s21-30.
-
19Landis JR, Koch GG. The measurement of observer agreement for categorical data. Biometrics. 1977;33:159-74. http://dx.doi.org/10.2307/2529310
» https://doi.org/http://dx.doi.org/10.2307/2529310 -
20Rodrigues FP, Martinelli S, Bittar RE, Francisco RP, Zugaib M. Comparison between two growth curves for small for gestational age diagnosis. Rev Bras Ginecol Obstet. 2015;37:59-63. http://dx.doi.org/10.1590/SO100-720320140005180
» https://doi.org/http://dx.doi.org/10.1590/SO100-720320140005180 -
21Kozuki N, Katz J, Christian P, Lee AC, Liu L, Silveira MF, et al. Comparison of US Birth Weight References and the International Fetal and Newborn Growth Consortium for the 21st Century Standard. JAMA Pediatr. 2015;169:e151438. https://doi.org/10.1001/jamapediatrics.2015.1438
» https://doi.org/https://doi.org/10.1001/jamapediatrics.2015.1438 -
22Oken E, Kleinman KP, Rich-Edwards J, Gillman MW. A nearly continuous measure of birth weight for gestational age using a United States national reference. BMC Pediatr. 2003;3:6. https://doi.org/10.1186/1471-2431-3-6
» https://doi.org/https://doi.org/10.1186/1471-2431-3-6 -
23Anderson NH, Sadler LC, McKinlay CJ, McCowan LM. INTERGROWTH-21st vs customized birthweight standards for identification of perinatal mortality and morbidity. Am J Obstet Gynecol. 2016;214:509.e1-509.e7. https://doi.org/10.1016/j.ajog.2015.10.931
» https://doi.org/https://doi.org/10.1016/j.ajog.2015.10.931 -
24Gardosi J, Mongelli M, Wilcox M, Chang A. An adjustable fetal weight standard. Ultrasound Obstet Gynecol. 1995;6:168-74. https://doi.org/10.1046/j.1469-0705.1995.06030168.x
» https://doi.org/https://doi.org/10.1046/j.1469-0705.1995.06030168.x -
25Fujita K, Nagasaka M, Iwatani S, Koda T, Kurokawa D, Yamana K, et al. Prevalence of small for gestational age (SGA) and short stature in children born SGA who qualify for growth hormone treatment at 3 years of age: Population-based study. Pediatr Int. 2016;58:372-6. https://doi.org/10.1111/ped.12859
» https://doi.org/https://doi.org/10.1111/ped.12859 -
26Villar J, Giuliani F, Fenton TR, Ohuma EO, Ismail LC, Kennedy SH, et al. Intergrowth-21st very preterm size at birth reference charts. Lancet. 2016; 27;387:844-5. https://doi.org/10.1016/S0140-6736(16)00384-6
» https://doi.org/https://doi.org/10.1016/S0140-6736(16)00384-6 -
27Fenton TR, Nasser R, Eliasziw M, Kim JH, Bilan D, Sauve R. Validating the weight gain of preterm infants between the reference growth curve of the fetus and the term infant. BMC Pediatr. 2013;13:92. https://doi.org/10.1186/1471-2431-13-92
» https://doi.org/https://doi.org/10.1186/1471-2431-13-92 -
28Shoji H, Watanabe A, Awaji A, Ikeda N, Hosozawa M, Ohkawa N, et al. Intrauterine growth restriction affects z-scores of anthropometric parameters during the first 6 years in very low-birth-weight-children born at less than 30 weeks of gestation. J Dev Orig Health Dis. 2019;24:1-5. https://doi.org/10.1017/S2040174419000369
» https://doi.org/https://doi.org/10.1017/S2040174419000369 -
29Beune IM, Bloomfield FH, Ganzevoort W, Embleton ND, Rozance PJ, van Wassenaer-Leemhuis AG, et al. Consensus based definition of growth restriction in the newborn. J Paediatr Child Health. 2018;196:71-6. https://doi.org/10.1111/jpc.13882_16
» https://doi.org/https://doi.org/10.1111/jpc.13882_16
Funding
-
The study did not receive funding.
Publication Dates
-
Publication in this collection
03 July 2020 -
Date of issue
2021
History
-
Received
10 July 2019 -
Accepted
11 Oct 2019 -
Published
26 June 2020


