Abstract
This study sought evidence of the validity of the Smartphone Addiction Scale-Short Version for a Brazilian sample of 718 individuals, amongst university students (n = 387, M age = 22.1 years) and adults (n = 331, M age = 35.2 years), who completed a sociodemographic questionnaire and the scale. The transcultural adaptation was carried out using specific protocols as recommended by expert’s committees. The factorial structure was evaluated by three methods: Confirmatory Factor Analysis, Principal Component Analysis, and Network Analysis. The adjustment parameters were not adequate and Principal Component Analysis explained 39.2% of the variance. The scale showed good reliability (α = 0.81) and a 39.4% prevalence of problematic phone use. The Network Analysis indicated that the correlations between the items were similar in the two populations. This is an unpublished study evaluating the usage pattern of smartphones in a sample of the adult population from all Brazilian states.
Keywords:
Addiction medicine; Adults; Internet; Smartphone; Students
Resumo
Este estudo buscou evidências de validade da Smartphone Addiction Scale-Short Version para uma amostra brasileira de 718 indivíduos, entre universitários (n = 387; Midade = 22,1 anos) e adultos (n = 331; Midade = 35,2 anos), que preencheram um questionário sociodemográfico e uma escala. Realizou-se a adaptação transcultural com protocolos específicos respondidos por juízes. A estrutura fatorial foi avaliada por três métodos: Análise Fatorial Confirmatória, Análise de Componentes Principais e Análise de Rede. Os parâmetros de ajustes não foram adequados e a Análise de Componentes Principais explicou 39,2% da variância. A escala mostrou boa confiabilidade (α = 0,81) e prevalência de 39,4% de uso problemático de smartphone. A Análise de Rede indicou que as correlações entre os itens foram parecidas nas duas populações. Este é um estudo inédito, avaliando o padrão de uso de smartphones em uma amostra da população adulta de todos os estados brasileiros.
Palavras-chave:
Medicina do vício; Adulto; Internet; Smartphone; Estudantes
Recent technological advances have resulted in the widespread use of smartphones in many cultures, and their increasingly complex functions have led to a new form of social interaction (Ictech, 2019Ictech, B. (2019). Smartphones and face‐to‐face interaction: digital Cross‐Talk during encounters in everyday life. Symbolic Interaction, 42(1), 27-45. http://dx.doi.org/10.1002/symb.406
http://dx.doi.org/10.1002/symb.406...
). The most recent data from the Brazilian Internet Management Committee indicated that the internet use from mobile devices surpassed computers in 2017 and forty-nine percent of Brazilians reported having accessed the internet in the previous three months only by using their smartphones (Comitê Gestor da Internet do Brasil, 2018Comitê Gestor da Internet do Brasil. (2018). Pesquisa sobre o uso das tecnologias de informação e comunicação nos domicílios brasileiros: TIC Domicílios 2017. Brasília: Autor. Recuperado de https://www.cetic.br/media/docs/publicacoes/2/tic_dom_2017_livro_eletronico.pdf
https://www.cetic.br/media/docs/publicac...
). In another report, 85% of individuals aged 9-17 years had access to the internet, with 44% using only their smartphones according to Brazilian Internet Steering Committee (2018Brazilian Internet Steering Committee. (2018). ICT Kids Online Brazil 2017. Brasília: Author. Retrieved from https://www.cetic.br/media/docs/publicacoes/2/tic_kids_ online_2017_livro_eletronico.pdf
https://www.cetic.br/media/docs/publicac...
). Besides, Brazil is ranked fourth globally on the total number of handsets, with more than 231 million smartphones according to Fundação Getúlio Vargas (2019Fundação Getúlio Vargas. (2019). 30ª Pesquisa anual de administração e uso de tecnologia da informação nas empresas. Rio de Janeiro: Autor. Recuperado de https://eaesp.fgv.br/ensinoeconhecimento/centros/cia/pesquisa
https://eaesp.fgv.br/ensinoeconhecimento...
).
Regardless of the amount of time connected to the internet, the World Wide Web Foundation ranked Brazil third place, in which Brazilian people spent more than nine hours daily online (World Wide Web Foundation, 2019World Health Organization. (2019). International Classification of Diseases for Mortality and Morbility Statistics. (ICD-11). Geneva: Author. Retrieved from https://icd.who.int/browse11/l-m/en
https://icd.who.int/browse11/l-m/en...
). On this report, the population also spent more than 3.3 hours per day connected to social networks, only behind the Philippines. Concerning adolescents, Brazil ranks second in time of internet connection outside of school hours (3.1 hours per day), and almost 30% of the students spend more than six hours a day connected, according to the Organization for Economic Co-operation and Development (2017Organization for Economic Co-operation and Development. (2017). PISA: Programme for International Student Assessment 2015 results. Paris: Author. Retrieved from http://gpseducation.oecd.org/CountryProfile?primaryCountry=BRA&treshold=10&topic=PI
http://gpseducation.oecd.org/CountryProf...
).
This high frequency of smartphone use led to studies on its impacts on physical and mental health. There has been strong evidence that overuse of smartphones is associated with various emotional problems, such as anxiety (Elhai, Levine, & Hall, 2018Elhai, J. D., Levine, J. C., & Hall, B. J. (2018). The relationship between anxiety symptom severity and problematic smartphone use: a review of the literature and conceptual frameworks. Journal of Anxiety Disorders, 62, 45-52. http://dx.doi.org/10.1016/j.janxdis.2018.11.005
http://dx.doi.org/10.1016/j.janxdis.2018...
), depression (Elhai, Yang, Fang, Bai, & Hall, 2019Elhai, J. D., Yang, H., Fang, J., Bai, X., & Hall, B. J. (2019). Depression and anxiety symptoms are related to problematic smartphone use severity in Chinese young adults: fear of missing out as a mediator. Addictive Behaviors, 101, e105962. http://dx.doi.org/10.1016/j.addbeh.2019.04.020
http://dx.doi.org/10.1016/j.addbeh.2019....
), stress (Xu et al., 2019Xu, T. T., Wang, H. Z., Fonseca, W., Zimmerman, M. A., Rost, D. H., Gaskin, J., & Wang, J. L. (2019). The relationship between academic stress and adolescents’ problematic smartphone usage. Addiction Research & Theory, 27(2), 162-169. http://dx.doi.org/10.1080/16066359.2018.1488967
http://dx.doi.org/10.1080/16066359.2018....
), sleep disorders (Chung et al., 2018Chung, J. E., Choi, S. A., Kim, K. T., Yee, J., Kim, J. H., Seong, J. W., Seong, J. M., … Gwak, H. S. (2018). Smartphone addiction risk and daytime sleepiness in Korean adolescents. Journal of Paediatrics and Child Health, 54(7), 800-806. http://dx.doi.org/10.1111/jpc.13901
http://dx.doi.org/10.1111/jpc.13901...
), amongst others. Problematic Smartphone Use (PSU) has therefore emerged as a new construct in the field of behavioral dependency studies. The PSU is not formally considered a psychopathology, according to the Diagnostic and Statistical Manual of Mental Disorders (DSM-V) (American Psychiatric Association, 2014American Psychiatric Association. (2014). Diagnostic and Statistical Manual of Mental Disorders (DSM-V). Porto Alegre: Artmed. ) and the International Classification of Diseases (ICD-11) (World Health Organization, 2019World Wide Web Foundation. (2019). 2018 affordability report. London: Author. Retrieved from https://a4ai.org/affordability-report/report/2018/
https://a4ai.org/affordability-report/re...
).
On the other hand, both systems share symptomatic characteristics of clinically dependent behavior, including: (i) tolerance (the user spends an increasingly amount of time using their smartphone); (ii) loss of usage control (the user has difficulty reducing their time of use and of how often they check their device); (iii) excessive concern with hedonic stimulation, disregard over friends and family; (iv) problems in several areas of life and abstinence syndrome (Lopez-Fernandez, 2017Lopez-Fernandez, O. (2017). Short version of the Smartphone Addiction Scale adapted to Spanish and French: towards a cross-cultural research in problematic mobile phone use. Addictive Behaviors, 64, 275-280. http://dx.doi.org/10.1016/j.addbeh.2015.11.013
http://dx.doi.org/10.1016/j.addbeh.2015....
). In many cases, it is common for individuals to worry excessively about posts on the internet (concern), needing to stay connected with their peers rather than building relationships with family and friends (disregard). As a result, PSU can lead to problems in different aspects of life, including family, school, and work (disruption). In the most severe cases, PSU can also lead to clinical symptoms related to being deprived of use (withdrawal), leading especially to mood and anxiety changes (Eide, Aarestad, Pallesen, Andreassen, & Bilder, 2018Eide, T. A., Aarestad, S. H., Pallesen, S., Andreassen, C. S., & Bilder, R. M. (2018). Smartphone restriction and its effect on subjective withdrawal related scores. Frontiers in Psychology, 9, 1444. http://dx.doi.org/10.3389/fpsyg.2018.01444
http://dx.doi.org/10.3389/fpsyg.2018.014...
)
The identification of PSU in most cases is performed using screening instruments, which provide data on the frequency and consequences of the usage pattern in the general population. In Brazil, the Smartphone Addiction Inventory was the first translated and adapted instrument, but it was designed for university students only (Khoury et al., 2017Khoury, J. M., Freitas, A. A. C., Roque, M. A. V., Albuquerque, M. R., Neves, M. D. C. L., & Garcia, F. D. (2017). Assessment of the accuracy of a new tool for the screening of smartphone addiction. Plos One, 12(5), e0176924. http://dx.doi.org/10.1371/journal.pone.0176924
http://dx.doi.org/10.1371/journal.pone.0...
). More recently, the Smartphone Addiction Scale-Short Version (SAS-SV) was adapted for Brazilian university students (Mescollotto, Castro, Pelai, Pertille, & Bigaton, 2019Mescollotto, F. F., Castro, E. M., Pelai, E. B., Pertille, A., & Bigaton, D. R. (2019). Translation of the short version of the Smartphone Addiction Scale into Brazilian Portuguese: cross-cultural adaptation and testing of measurement properties. Brazilian Journal of Physical Therapy, 23(3), 250-256. http://dx.doi.org/10.1016/j.bjpt.2018.08.013
http://dx.doi.org/10.1016/j.bjpt.2018.08...
). The SAS-SV (Kwon, Kim, Cho, & Yang, 2013aKwon, M., Kim, D. J., Cho, H., & Yang, S. (2013a). The Smartphone Addiction Scale: development and validation of a short version for adolescents. Plos One, 8(12), e83558. http://dx.doi.org/10.1371/journal.pone.0083558
http://dx.doi.org/10.1371/journal.pone.0...
) is a reduced version of SAS-Long Version (Kwon et al., 2013bKwon, M., Lee, J. Y., Won, W. Y., Park, J. W., Min, J. A., Hahn, C., … Kim, D. -J. (2013b). Development and validation of a Smartphone Addiction Scale (SAS). Plos One, 8(2), e56936. http://dx.doi.org/10.1371/journal.pone.0056936
http://dx.doi.org/10.1371/journal.pone.0...
), and has 33 items. SAS-SV has 10 items and was developed by the same authors as the original version. SAS-SV has been translated and adapted to the following: German (Haug et al., 2015Haug, S., Castro, R. P., Kwon, M., Filler, A., Kowatsch, T., & Schaub, M. P. (2015). Smartphone use and smartphone addiction among young people in Switzerland. Journal of Behavioral Addictions, 4(4), 299-307. http://dx.doi.org/10.1556/2006.4.2015.037
http://dx.doi.org/10.1556/2006.4.2015.03...
), Spanish and French (Lopez-Fernandez, 2017Lopez-Fernandez, O. (2017). Short version of the Smartphone Addiction Scale adapted to Spanish and French: towards a cross-cultural research in problematic mobile phone use. Addictive Behaviors, 64, 275-280. http://dx.doi.org/10.1016/j.addbeh.2015.11.013
http://dx.doi.org/10.1016/j.addbeh.2015....
), Turkish (Noyan, Darçın, Nurmedov, Yılmaz, & Dilbaz, 2015Noyan, C. O., Darçın, A. E., Nurmedov, S., Yılmaz, O., & Dilbaz, N. (2015). Validity and reliability of the Turkish version of the Smartphone Addiction Scale-Short version among university students. Anatolian Journal of Psychiatry, 16, 73-81. http://dx.doi.org/10.5455/apd.176101
http://dx.doi.org/10.5455/apd.176101...
), Malay (Ching et al., 2015Ching, S. M., Yee, A., Ramachandran, V., Lim, S. M. S., Sulaiman, W. A. W., Foo, Y. L., & kee-Hoo, F. (2015). Validation of a malay version of the Smartphone Addiction Scale among medical students in malaysia. Plos One, 10(10), e0139337. http://dx.doi.org/10.1371/journal.pone.0139337
http://dx.doi.org/10.1371/journal.pone.0...
) and Italian (De Pasquale, Sciacca, & Hichy, 2017De Pasquale, C., Sciacca, F., & Hichy, Z. (2017). Italian validation of Smartphone Addiction Scale Short Version for adolescents and young adults (SAS-SV). Psychology, 8(10), 1513. http://dx.doi.org/10.4236/psych.2017.810100
http://dx.doi.org/10.4236/psych.2017.810...
).
To date, there are still no instruments in Brazil assessing PSU in the adult population. The study by Mescollotto et al. (2019Mescollotto, F. F., Castro, E. M., Pelai, E. B., Pertille, A., & Bigaton, D. R. (2019). Translation of the short version of the Smartphone Addiction Scale into Brazilian Portuguese: cross-cultural adaptation and testing of measurement properties. Brazilian Journal of Physical Therapy, 23(3), 250-256. http://dx.doi.org/10.1016/j.bjpt.2018.08.013
http://dx.doi.org/10.1016/j.bjpt.2018.08...
) only evaluated the reliability of the instrument (α = 0.95) in a university population, without evaluating the factorial structure of the SAS-SV.
The aim of this study was: (i) to obtain evidence of the validity based on internal structure, reliability and validity of the adaptation of the SAS-SV for a Brazilian population of university students and adult population; (ii) to compare the frequency of addictive symptoms measured by SAS-SV between university students and adult population. We hypothesized that: (i) the SAS-SV would have an adequate factorial structure similar to its original version from the confirmatory factor analysis; (ii) the frequency of addictive symptoms would be higher for university students rather than for the adult population.
Method
Participants
The sample was comprised of 718 individuals, part were university students (n = 387, M age = 22.1, SD = 5.07) and another one were adults from the general Brazilian population (n = 331, M age = 35.2, SD = 12.8) from all regions of Brazil. Participants completed a sociodemographic questionnaire and the SAS-SV. The survey was performed using the SurveyMonkey® platform, in which a link to the study was available through social networks and messaging applications during the time period of two weeks. The questionnaire could be answered only once, and all participants had to be resident in Brazil (detected automatically by the internet protocol address of the devices used).
Instruments
To characterize the sample, we used a sociodemographic questionnaire comprised of five general questions for all participants (gender, age, marital status, from which region of Brazil the survey was answered, whether they were attending university). The participants who were university students also answered four specific questions (current semester, type of university, course, and area of knowledge), and the adults answered one specific question (level of education). The SAS-SV has 10 items answered on a six-point scale ranging from 1 = strongly disagree to 6 = strongly agree. The total scale score, therefore, ranges from 10 to 60 points. The original version of SAS-SV showed high internal consistency (α = 0.91).
The prevalence of PSU was estimated using the cut-off point proposed by Kwon et al., (2013aKwon, M., Kim, D. J., Cho, H., & Yang, S. (2013a). The Smartphone Addiction Scale: development and validation of a short version for adolescents. Plos One, 8(12), e83558. http://dx.doi.org/10.1371/journal.pone.0083558
http://dx.doi.org/10.1371/journal.pone.0...
), with 31 points for men and 33 points for women. Additionally, we assessed six different symptoms by using SAS-SV, as proposed by Lopez-Fernandez (2017Lopez-Fernandez, O. (2017). Short version of the Smartphone Addiction Scale adapted to Spanish and French: towards a cross-cultural research in problematic mobile phone use. Addictive Behaviors, 64, 275-280. http://dx.doi.org/10.1016/j.addbeh.2015.11.013
http://dx.doi.org/10.1016/j.addbeh.2015....
): loss of control (items 1 and 8), disruption (items 2 and 10), disregard (items 3 and 7), withdrawal (items 4 and 5), preoccupation (item 6) and tolerance (item 9). Each item has a score of 1 to 6, and the presence of the symptoms was considered when the scores’ average of the grouped items was equal to or greater than 4 points. For the symptoms that were evaluated with only a single question, the item should have a score equal to or higher than 4 to be considered as present. According to Lopez-Fernandez (2017Lopez-Fernandez, O. (2017). Short version of the Smartphone Addiction Scale adapted to Spanish and French: towards a cross-cultural research in problematic mobile phone use. Addictive Behaviors, 64, 275-280. http://dx.doi.org/10.1016/j.addbeh.2015.11.013
http://dx.doi.org/10.1016/j.addbeh.2015....
), this procedure was based on the symptoms of substance use disorders and disorders related to pathological gambling, as stated by the Diagnostic and Statistical Manual of Mental Disorders.
Procedures
Translation and adaptation of the SAS-SV
Initially, all items of the instrument were translated from English into Portuguese by two bilingual translators, one of them a native English speaker with a background in Psychology (PhD) and the other with a qualification on languages (Portuguese-English). Any disagreements were settled by consensus.
Evaluation of the SAS-SV items by an Experts Committee
In the second stage, we developed an initial version of the Portuguese scale and submitted it to five experts in the field, who evaluated the semantic, conceptual, linguistic and cultural equivalence of the SAS-SV. The experts used a scoring table adapted from the study by Balbinotti, Benetti, and Terra (2007Balbinotti, M. A. A., Benetti, C., & Terra, P. R. S. (2007). Translation and validation of the Graham-Harvey survey for the Brazilian context. International Journal of Managerial Finance, 3(1), 26-48. http://dx.doi.org/10.1108/17439130710721644
http://dx.doi.org/10.1108/17439130710721...
). All the items were evaluated for two characteristics: clarity of language and practical/clinical relevance. Regarding the first, they assigned a grade ranging from 1 (very unclear) to 5 (very clear). The same value was assigned to the second characteristic, with a score ranging from 1 (not relevant) to 5 (very relevant).
Assessment by the target population
Operational equivalence and validity of the items were analysed by using three focus groups conducted with both university students(n = 15) and individuals from the general adult population(n = 8). At this stage these participants responding to the instrument and discussed about possible changes to some words and/or phrases that might be better suited to the Brazilian population. The functionality of data collection through the platform and possible technical problems to complete the questionnaire were also assessed. Some syntax and database access errors were fixed. These data were not included in the final sample.
Back translation
This adapted version was translated into English by two translators, and a synthesis of the translations (carried out by the researchers) was sent to the authors of the original scale. There were disagreements in only two items of the scale, which were discussed amongst the researchers and the two experts. The translation into Portuguese was explained to the authors of the original version, who agreed to keep the items in the way they had been translated.
Data analysis
Sociodemographic data
The sociodemographic data, with continuous variables, was analysed through a one-way analysis of variance (ANOVA), and the homogeneity of the variances was evaluated by the Levene Test. When significance was detected, the Scheffé test was performed a posteriori to identify specific differences among the groups. Regarding the nominal variables, they were analysed using the Chi-square Test (χ
2) or Fischer's Exact Test. To assess the effect size, we used Cramer's V for the nominal variables, and Eta squared (η²) for the continuous variables (Cruz, Scatena, Andrade, & De Micheli, 2018Cruz, F. A. D., Scatena, A., Andrade, A. L. M., & De Micheli, D. (2018). Evaluation of Internet addiction and the quality of life of Brazilian adolescents from public and private schools. Estudos de Psicologia (Campinas), 35(2), 193-204. http://dx.doi.org/10.1590/1982-02752018000200008
http://dx.doi.org/10.1590/1982-027520180...
).
Confirmatory Factor Analysis
The adequacy of the sample for the factor analyses was performed by using the Kaiser-Meyer-Olkin method (KMO = 0.858) and the Bartlett's Sphericity Test (p< 0.001). The initial adjustment of the model was performed on Confirmatory Factor Analysis, using as a solution the weighted averages of least squares method as one factor, such as in the original version of the instrument (Kwon et al., 2013aKwon, M., Kim, D. J., Cho, H., & Yang, S. (2013a). The Smartphone Addiction Scale: development and validation of a short version for adolescents. Plos One, 8(12), e83558. http://dx.doi.org/10.1371/journal.pone.0083558
http://dx.doi.org/10.1371/journal.pone.0...
). The following adjustment indices were considered: the Comparative Fit Index (CFI ≥ 0.95), the Tukey-Lewis Index (TLI ≥ 0.95), and the Root Mean Square Error of Approximation (RMSEA ≤ 0.08).
Principal Component Analysis
Because the CFA did not indicate good adequacy in the Brazilian version, we conducted an exploratory analysis using Principal Component Analysis method with oblique rotation and one-factor solution. Only items with a factor weight above 0.30 were considered, according to the methodology recommended by other authors (Giuliani, 2017Giuliani, A. (2017). The application of principal component analysis to drug discovery and biomedical data. Drug Discovery Today, 22(7), 1069-1076. http://dx.doi.org/10.1016/j.drudis.2017.01.005
http://dx.doi.org/10.1016/j.drudis.2017....
). We adopted this factorial solution according to the previous study to validate the SAS-SV (Lopez-Fernandez, 2017Lopez-Fernandez, O. (2017). Short version of the Smartphone Addiction Scale adapted to Spanish and French: towards a cross-cultural research in problematic mobile phone use. Addictive Behaviors, 64, 275-280. http://dx.doi.org/10.1016/j.addbeh.2015.11.013
http://dx.doi.org/10.1016/j.addbeh.2015....
).
Network Analysis
The psychometric properties of the instrument were also analysed using the NA, which combines graphic models with association algorithms that evaluate the strength of the correlations between items. Besides, the Network Analysis analysis also assesses the degree of connectivity (betweenness centrality), the proximity between all variables in the network (closeness centrality) and the frequency of connections each node has from the number of possible connections (degree centrality) (Machado, Vissoci, & Epskamp, 2015Machado, W. L., Vissoci, J., & Epskamp, S. (2015). Análise de rede aplicada à psicometria e à avaliação psicológica. In C. S. Hutz, D. R. Bandeira, & C. M. Trentini (Eds.), Psicometria (pp.125-146). São Paulo: Casa do Psicólogo.). These data allowed to identify those items which had a greater weight in the network, comparing them with the symptoms evaluated by each item. The Gaussian graph method was used, with the procedure of estimation of partial correlations gLASSO (graphical least absolute shrinkage and selection operator) as proposed by some authors (Friedman, Hastie, & Tibshirani, 2008Friedman, J., Hastie, T., & Tibshirani, R. (2008). Sparse inverse covariance estimation with the graphical lasso. Biostatistics, 9(3), 432-441. http://dx.doi.org/10.1093/biostatistics/kxm045
http://dx.doi.org/10.1093/biostatistics/...
). Correlations between items were obtained from a matrix, considering different effect sizes (≤ 0.1 = small; > 0.1 to < 0.5 = moderate; ≥ 0.5 = large). The final model was composed of a finite range of parameters, which came from the data of residual extended Bayesian information criteria (Chen & Chen, 2008Chen, J., & Chen, Z. (2008). Extended Bayesian information criteria for model selection with large model spaces. Biometrika, 95, 759-771. http://dx.doi.org/10.1093/biomet/asn034
http://dx.doi.org/10.1093/biomet/asn034...
). Three measures of centrality were considered in this study: (1) Betweenness: to identify the connection strength between two items; (2) Closeness: to identify the proximity between two items in the network; and (3) Degree: to identify the number of links each node has based on the all possible connections.
Ethical aspects
The study was conducted following the principles of the Declaration of Helsinki and the Brazilian National Health Council (Resolutions CNS 466/12, CNS 510/16) and was approved by the Research Ethics Committee of the Institution (CAAE 75837417.1.0000.5481; nº 2.326.766). The original authors approved the cross-cultural translation and adaptation tool of the SAS-SV (Kwon et al., 2013aKwon, M., Kim, D. J., Cho, H., & Yang, S. (2013a). The Smartphone Addiction Scale: development and validation of a short version for adolescents. Plos One, 8(12), e83558. http://dx.doi.org/10.1371/journal.pone.0083558
http://dx.doi.org/10.1371/journal.pone.0...
).
Results
Table 1 shows the mean SAS-SV scores of the participants according to sociodemographic data. The highest scores were detected amongst male participants, single, from the Northern region of Brazil, and those university students. In the adult population, those with a higher level of education presented lower scores of PSU. In all analyses, we found a low effect that suggests significant observed differences may be due to high sample size.
Prevalence of Problematic Smartphone Use
The total amount of participants with Prevalence of Problematic Smartphone Use was 39.4% (n = 283). When the prevalence was analysed by gender, there was no significant difference (χ2= 0.45,p= 0.49, Cramer's V test = 0.02) found in the proportion of women (n= 184, 40.4%) and men (n = 99; 37.7%) with problematic smartphone use. On the other hand, a statistically significant difference (χ2= 4.25,p= 0.04, Cramer's V test = 0.08) was observed in the prevalence of PSU when comparing the adult population (35.3%) to university students (42.9%).
Table 2 shows the frequency of symptoms when comparing the adult population to university students in the total sample and only among those who presented PSU. In the overall sample, university students had a higher frequency of symptoms than adults, but only in three of them there was a significant effect. When comparing only those with PSU, the frequency of symptoms between the two samples was quite similar, and only the withdrawal’s symptom had a significantly higher frequency in adults compared to the students.
Item analysis and reliability
Considering the 10 items of the SAS-SV, the fit parameters of the unifactorial model from the confirmatory factor analysis, were inadequate (CFI = 0.806; TLI = 0.751; RMSEA = 0.124). For this reason, an exploratory analysis was performed using the PCA method (Table 3). With this method, the average item score varied from 2.55 (question 7) to 4.56 (question 9), and all items were maintained in SAS-SV because they presented a factorial load higher than 0.30. Also, all items on the scale presented good internal consistency, and overall scale reliability was high (α = 0.819).
Network analysis indicated the correlation between the all items of SAS-SV items between university students (Figure 1A) and adults (Figure 1B). All items (nodes) showed positive correlations (green edges), which indicates that the increase in the score of one item led to an increase in the scores of other items. The strength of correlations amongst students (Figure 1A) was higher between items 1 and 2 (r= 0.43); 4 and 5 (r = 0.42) as well as 5 and 6 (r= 0.38). Regarding the adults (Figure 1B), it was detected strongest correlations between items 1 and 2 (r= 0.52); 4 and 5 (r= 0.43), as well as 9 and 10 (r= 0.29). Concerning centrality measurements (Figure 1C), item 6 was one of the most important in both groups, since it had higher levels of connectivity and proximity to other items and showed a more central location in the system. Amongst adults, item 9 stood out in the two measures of centralities. On the other hand, item 3 had the lowest influence on the system with a lower correlation strength with the other items and was the most isolated one.
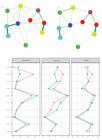
The color of the items (nodes) was based on the criteria proposed by Lopez-Fernandez (2017Lopez-Fernandez, O. (2017). Short version of the Smartphone Addiction Scale adapted to Spanish and French: towards a cross-cultural research in problematic mobile phone use. Addictive Behaviors, 64, 275-280. http://dx.doi.org/10.1016/j.addbeh.2015.11.013
http://dx.doi.org/10.1016/j.addbeh.2015....
). The withdrawal symptoms (items 4 and 5) were the ones that presented the strongest correlations with each other, but items 1-8 (r
students= 0.04; r
adults= 0.05; loss of control); 3-7 (r
students= 0.00;r
adults= 0.05; disregard); and 2-10 (r
students= 0.03;r
adults= 0.12; disruption) showed poor correlations. Regarding the proximity of items, only the connection between items 4-5 showed strong proximity to each other. Items 2-10 presented some proximity, and the other symptoms were very scattered in the network. As described above, item 6 (preoccupation) was the one that most connected with the other symptoms in both groups: university students (betweenness = 2.25) and adults (betweenness = 1.53).
The final version of the SAS-SV with all the items translated into Brazilian Portuguese is presented in Table 4. The instrument is under public domain and can be used freely, complying with its original version (Kwon et al., 2013aKwon, M., Kim, D. J., Cho, H., & Yang, S. (2013a). The Smartphone Addiction Scale: development and validation of a short version for adolescents. Plos One, 8(12), e83558. http://dx.doi.org/10.1371/journal.pone.0083558
http://dx.doi.org/10.1371/journal.pone.0...
).
Discussion
The main goal of this study was to translate and adapt the SAS-SV and to evaluate its validity in a population of Brazilian university students and adults. To our knowledge, this is the first study in the literature evaluating the psychometric properties of the SAS-SV through network analysis. The scale maintained the semantic, idiomatic and conceptual equivalences of the original version. Initially, confirmatory factor analysis was performed, similarly to the SAS-SV validation for Italian (De Pasquale et al., 2017De Pasquale, C., Sciacca, F., & Hichy, Z. (2017). Italian validation of Smartphone Addiction Scale Short Version for adolescents and young adults (SAS-SV). Psychology, 8(10), 1513. http://dx.doi.org/10.4236/psych.2017.810100
http://dx.doi.org/10.4236/psych.2017.810...
) population. However, the CFA did not show goof fit indexes (CFI = 0.80; Standardized Root Mean Square Residual (SRMR) = 0.06). In the study by De Pasquale et al. (2017De Pasquale, C., Sciacca, F., & Hichy, Z. (2017). Italian validation of Smartphone Addiction Scale Short Version for adolescents and young adults (SAS-SV). Psychology, 8(10), 1513. http://dx.doi.org/10.4236/psych.2017.810100
http://dx.doi.org/10.4236/psych.2017.810...
), the authors found better fit indicators (CFI = 0.92, SRMR = 0.06).
A PCA exploratory analysis method with a one-dimensional solution was therefore used, in a similar way to other SAS-SV adaptation studies (Lopez-Fernandez, 2017Lopez-Fernandez, O. (2017). Short version of the Smartphone Addiction Scale adapted to Spanish and French: towards a cross-cultural research in problematic mobile phone use. Addictive Behaviors, 64, 275-280. http://dx.doi.org/10.1016/j.addbeh.2015.11.013
http://dx.doi.org/10.1016/j.addbeh.2015....
; Noyan et al., 2015Noyan, C. O., Darçın, A. E., Nurmedov, S., Yılmaz, O., & Dilbaz, N. (2015). Validity and reliability of the Turkish version of the Smartphone Addiction Scale-Short version among university students. Anatolian Journal of Psychiatry, 16, 73-81. http://dx.doi.org/10.5455/apd.176101
http://dx.doi.org/10.5455/apd.176101...
; Sfendla et al., 2018Sfendla, A., Laita, M., Nejjar, B., Souirti, Z., Touhami, A. A. O., & Senhaji, M. (2018). Reliability of the Arabic Smartphone Addiction Scale and Smartphone Addiction Scale-Short version in two different Moroccan samples. Cyberpsychology, Behavior, and Social Networking, 21(5), 325-332. http://dx.doi.org/10.1089/cyber.2017.0411
http://dx.doi.org/10.1089/cyber.2017.041...
). This procedure showed good validity and adequacy of the instrument in the Brazilian version and explained 39.2% of the variance. This finding was lower than other versions, such Arabic (42.4%, Sfendla et al., 2018Sfendla, A., Laita, M., Nejjar, B., Souirti, Z., Touhami, A. A. O., & Senhaji, M. (2018). Reliability of the Arabic Smartphone Addiction Scale and Smartphone Addiction Scale-Short version in two different Moroccan samples. Cyberpsychology, Behavior, and Social Networking, 21(5), 325-332. http://dx.doi.org/10.1089/cyber.2017.0411
http://dx.doi.org/10.1089/cyber.2017.041...
), Spanish and Belgian (respectively 49.0% and 54.0%;Lopez-Fernandez, 2017Lopez-Fernandez, O. (2017). Short version of the Smartphone Addiction Scale adapted to Spanish and French: towards a cross-cultural research in problematic mobile phone use. Addictive Behaviors, 64, 275-280. http://dx.doi.org/10.1016/j.addbeh.2015.11.013
http://dx.doi.org/10.1016/j.addbeh.2015....
). The reliability level of scale in the present study wasα = 0.819, indicating good internal consistency (Streiner, 2003Streiner, D. L. (2003). Being inconsistent about consistency: when coefficient alpha does and doesn't matter. Journal of Personality Assessment, 80(3), 217-222. http://dx.doi.org/10.1207/S15327752JPA8003_01
http://dx.doi.org/10.1207/S15327752JPA80...
). Good levels of reliability were also obtained in the original version (α = 0.91,Kwon et al., 2013aKwon, M., Kim, D. J., Cho, H., & Yang, S. (2013a). The Smartphone Addiction Scale: development and validation of a short version for adolescents. Plos One, 8(12), e83558. http://dx.doi.org/10.1371/journal.pone.0083558
http://dx.doi.org/10.1371/journal.pone.0...
), Spanish and Belgian (α = 0.88 and α = 0.90, respectively; Lopez-Fernandez, 2017Lopez-Fernandez, O. (2017). Short version of the Smartphone Addiction Scale adapted to Spanish and French: towards a cross-cultural research in problematic mobile phone use. Addictive Behaviors, 64, 275-280. http://dx.doi.org/10.1016/j.addbeh.2015.11.013
http://dx.doi.org/10.1016/j.addbeh.2015....
), Arabic (α = 0.87; Sfendla et al., 2018Sfendla, A., Laita, M., Nejjar, B., Souirti, Z., Touhami, A. A. O., & Senhaji, M. (2018). Reliability of the Arabic Smartphone Addiction Scale and Smartphone Addiction Scale-Short version in two different Moroccan samples. Cyberpsychology, Behavior, and Social Networking, 21(5), 325-332. http://dx.doi.org/10.1089/cyber.2017.0411
http://dx.doi.org/10.1089/cyber.2017.041...
), Turkish (α = 0.88; Noyan et al., 2015Noyan, C. O., Darçın, A. E., Nurmedov, S., Yılmaz, O., & Dilbaz, N. (2015). Validity and reliability of the Turkish version of the Smartphone Addiction Scale-Short version among university students. Anatolian Journal of Psychiatry, 16, 73-81. http://dx.doi.org/10.5455/apd.176101
http://dx.doi.org/10.5455/apd.176101...
), German (α = 0.85; Haug et al., 2015Haug, S., Castro, R. P., Kwon, M., Filler, A., Kowatsch, T., & Schaub, M. P. (2015). Smartphone use and smartphone addiction among young people in Switzerland. Journal of Behavioral Addictions, 4(4), 299-307. http://dx.doi.org/10.1556/2006.4.2015.037
http://dx.doi.org/10.1556/2006.4.2015.03...
) and Italian (α = 0.79; De Pasquale et al., 2017De Pasquale, C., Sciacca, F., & Hichy, Z. (2017). Italian validation of Smartphone Addiction Scale Short Version for adolescents and young adults (SAS-SV). Psychology, 8(10), 1513. http://dx.doi.org/10.4236/psych.2017.810100
http://dx.doi.org/10.4236/psych.2017.810...
).
The NA analysis showed a strong positive correlation between all the items in the scale, particularly items 1-2 and 4-5, with high levels of correlation. Regarding centrality items, 6 and 9 were the most relevant on the network; however, the symptoms proposed for the 10 items, as done by Lopez-Fernandez (2017Lopez-Fernandez, O. (2017). Short version of the Smartphone Addiction Scale adapted to Spanish and French: towards a cross-cultural research in problematic mobile phone use. Addictive Behaviors, 64, 275-280. http://dx.doi.org/10.1016/j.addbeh.2015.11.013
http://dx.doi.org/10.1016/j.addbeh.2015....
) were only partially confirmed in this analysis. Items 4 - "There is nothing more difficult than being without my cell phone" and 5 - "I get impatient and angry when I do not have my phone” (withdrawal) showed a strong correlation with each other, but items 1-8 (loss of control) and 3-7 (disregard) presented poor correlations amongst themselves, as well as being quite separated in the network. It should be noted that the original version of the SAS-SV does not evaluate the six symptoms since this was proposed later by Lopez-Fernandez (2017Lopez-Fernandez, O. (2017). Short version of the Smartphone Addiction Scale adapted to Spanish and French: towards a cross-cultural research in problematic mobile phone use. Addictive Behaviors, 64, 275-280. http://dx.doi.org/10.1016/j.addbeh.2015.11.013
http://dx.doi.org/10.1016/j.addbeh.2015....
), and subsequently evaluated by other authors (Sfendla et al., 2018Sfendla, A., Laita, M., Nejjar, B., Souirti, Z., Touhami, A. A. O., & Senhaji, M. (2018). Reliability of the Arabic Smartphone Addiction Scale and Smartphone Addiction Scale-Short version in two different Moroccan samples. Cyberpsychology, Behavior, and Social Networking, 21(5), 325-332. http://dx.doi.org/10.1089/cyber.2017.0411
http://dx.doi.org/10.1089/cyber.2017.041...
).
Regarding the SAS-SV scores, those participants male, single, and university participants had higher scores (p< 0.001), but in all analyses, we detected a small effect size. The total prevalence of PSU was 39.4%, and in university students, this rate was 42.9%. This finding is higher than that which has been found in another study conducted in Brazil (33.1%;Mescollotto et al., 2019Mescollotto, F. F., Castro, E. M., Pelai, E. B., Pertille, A., & Bigaton, D. R. (2019). Translation of the short version of the Smartphone Addiction Scale into Brazilian Portuguese: cross-cultural adaptation and testing of measurement properties. Brazilian Journal of Physical Therapy, 23(3), 250-256. http://dx.doi.org/10.1016/j.bjpt.2018.08.013
http://dx.doi.org/10.1016/j.bjpt.2018.08...
) and in Swiss and South-Korea, with teenagers (21.6%; Haug et al., 2015Haug, S., Castro, R. P., Kwon, M., Filler, A., Kowatsch, T., & Schaub, M. P. (2015). Smartphone use and smartphone addiction among young people in Switzerland. Journal of Behavioral Addictions, 4(4), 299-307. http://dx.doi.org/10.1556/2006.4.2015.037
http://dx.doi.org/10.1556/2006.4.2015.03...
; and 16.8%: Kwon et al., 2013aKwon, M., Kim, D. J., Cho, H., & Yang, S. (2013a). The Smartphone Addiction Scale: development and validation of a short version for adolescents. Plos One, 8(12), e83558. http://dx.doi.org/10.1371/journal.pone.0083558
http://dx.doi.org/10.1371/journal.pone.0...
, respectively). Regarding the adult population (35.3%), the findings were also higher than those observed in Spanish and Belgian adults (21.5% and 12.3%, respectively;Lopez-Fernandez et al., 2017Lopez-Fernandez, O. (2017). Short version of the Smartphone Addiction Scale adapted to Spanish and French: towards a cross-cultural research in problematic mobile phone use. Addictive Behaviors, 64, 275-280. http://dx.doi.org/10.1016/j.addbeh.2015.11.013
http://dx.doi.org/10.1016/j.addbeh.2015....
). When the frequency of symptoms among individuals with PSU was evaluated, most of the sample showed symptoms of tolerance (98.6%). In this case, similar data was found in Moroccan (93.6%; Sfendla et al., 2018Sfendla, A., Laita, M., Nejjar, B., Souirti, Z., Touhami, A. A. O., & Senhaji, M. (2018). Reliability of the Arabic Smartphone Addiction Scale and Smartphone Addiction Scale-Short version in two different Moroccan samples. Cyberpsychology, Behavior, and Social Networking, 21(5), 325-332. http://dx.doi.org/10.1089/cyber.2017.0411
http://dx.doi.org/10.1089/cyber.2017.041...
) and Spanish samples (93.9%; Lopez-Fernandez, 2017Lopez-Fernandez, O. (2017). Short version of the Smartphone Addiction Scale adapted to Spanish and French: towards a cross-cultural research in problematic mobile phone use. Addictive Behaviors, 64, 275-280. http://dx.doi.org/10.1016/j.addbeh.2015.11.013
http://dx.doi.org/10.1016/j.addbeh.2015....
).
The present study has some limitations that must be considered. A concurrent validity analysis of the SAS-SV was not performed due to the lack of another instrument validated in Brazil for the adult population until de period of the data collection. Test-retest analyses were also not performed. The main strength of this study was the adaptation and validation of the instrument for two populations, as well as the large sample size. The network analysis was also a major point in this work, although a few psychometric studies still use this statistical procedure. This type of analysis ensures better technical information because it estimates associations after multivariate control of all items in the system. Network analysis ensures that the remaining links in the system are the most stable.
The SAS-SV presented reliable semantic equivalence and factor structure for both university students and adults. This instrument is a suitable tool to detect the pattern of smartphone use for the populations studied. The prevalence of PSU was higher than the ones reported in other studies found in the literature, which corroborates the high frequency of use of digital media in Brazil found in international reports.
Acknowledgments
To Department of Psychiatry from the Catholic University of Korea due to the partnership in this study. To teacher L. B. NUCCI of Pontifícia Universidade Católica de Campinas (PUC-Campinas) to the revision of the data analyses.
References
- American Psychiatric Association. (2014). Diagnostic and Statistical Manual of Mental Disorders (DSM-V) Porto Alegre: Artmed.
- Balbinotti, M. A. A., Benetti, C., & Terra, P. R. S. (2007). Translation and validation of the Graham-Harvey survey for the Brazilian context. International Journal of Managerial Finance, 3(1), 26-48. http://dx.doi.org/10.1108/17439130710721644
» http://dx.doi.org/10.1108/17439130710721644 - Brazilian Internet Steering Committee. (2018). ICT Kids Online Brazil 2017 Brasília: Author. Retrieved from https://www.cetic.br/media/docs/publicacoes/2/tic_kids_ online_2017_livro_eletronico.pdf
» https://www.cetic.br/media/docs/publicacoes/2/tic_kids_ online_2017_livro_eletronico.pdf - Chen, J., & Chen, Z. (2008). Extended Bayesian information criteria for model selection with large model spaces. Biometrika, 95, 759-771. http://dx.doi.org/10.1093/biomet/asn034
» http://dx.doi.org/10.1093/biomet/asn034 - Ching, S. M., Yee, A., Ramachandran, V., Lim, S. M. S., Sulaiman, W. A. W., Foo, Y. L., & kee-Hoo, F. (2015). Validation of a malay version of the Smartphone Addiction Scale among medical students in malaysia. Plos One, 10(10), e0139337. http://dx.doi.org/10.1371/journal.pone.0139337
» http://dx.doi.org/10.1371/journal.pone.0139337 - Chung, J. E., Choi, S. A., Kim, K. T., Yee, J., Kim, J. H., Seong, J. W., Seong, J. M., … Gwak, H. S. (2018). Smartphone addiction risk and daytime sleepiness in Korean adolescents. Journal of Paediatrics and Child Health, 54(7), 800-806. http://dx.doi.org/10.1111/jpc.13901
» http://dx.doi.org/10.1111/jpc.13901 - Comitê Gestor da Internet do Brasil. (2018). Pesquisa sobre o uso das tecnologias de informação e comunicação nos domicílios brasileiros: TIC Domicílios 2017 Brasília: Autor. Recuperado de https://www.cetic.br/media/docs/publicacoes/2/tic_dom_2017_livro_eletronico.pdf
» https://www.cetic.br/media/docs/publicacoes/2/tic_dom_2017_livro_eletronico.pdf - Cruz, F. A. D., Scatena, A., Andrade, A. L. M., & De Micheli, D. (2018). Evaluation of Internet addiction and the quality of life of Brazilian adolescents from public and private schools. Estudos de Psicologia (Campinas), 35(2), 193-204. http://dx.doi.org/10.1590/1982-02752018000200008
» http://dx.doi.org/10.1590/1982-02752018000200008 - De Pasquale, C., Sciacca, F., & Hichy, Z. (2017). Italian validation of Smartphone Addiction Scale Short Version for adolescents and young adults (SAS-SV). Psychology, 8(10), 1513. http://dx.doi.org/10.4236/psych.2017.810100
» http://dx.doi.org/10.4236/psych.2017.810100 - Eide, T. A., Aarestad, S. H., Pallesen, S., Andreassen, C. S., & Bilder, R. M. (2018). Smartphone restriction and its effect on subjective withdrawal related scores. Frontiers in Psychology, 9, 1444. http://dx.doi.org/10.3389/fpsyg.2018.01444
» http://dx.doi.org/10.3389/fpsyg.2018.01444 - Elhai, J. D., Levine, J. C., & Hall, B. J. (2018). The relationship between anxiety symptom severity and problematic smartphone use: a review of the literature and conceptual frameworks. Journal of Anxiety Disorders, 62, 45-52. http://dx.doi.org/10.1016/j.janxdis.2018.11.005
» http://dx.doi.org/10.1016/j.janxdis.2018.11.005 - Elhai, J. D., Yang, H., Fang, J., Bai, X., & Hall, B. J. (2019). Depression and anxiety symptoms are related to problematic smartphone use severity in Chinese young adults: fear of missing out as a mediator. Addictive Behaviors, 101, e105962. http://dx.doi.org/10.1016/j.addbeh.2019.04.020
» http://dx.doi.org/10.1016/j.addbeh.2019.04.020 - Friedman, J., Hastie, T., & Tibshirani, R. (2008). Sparse inverse covariance estimation with the graphical lasso. Biostatistics, 9(3), 432-441. http://dx.doi.org/10.1093/biostatistics/kxm045
» http://dx.doi.org/10.1093/biostatistics/kxm045 - Fundação Getúlio Vargas. (2019). 30ª Pesquisa anual de administração e uso de tecnologia da informação nas empresas Rio de Janeiro: Autor. Recuperado de https://eaesp.fgv.br/ensinoeconhecimento/centros/cia/pesquisa
» https://eaesp.fgv.br/ensinoeconhecimento/centros/cia/pesquisa - Giuliani, A. (2017). The application of principal component analysis to drug discovery and biomedical data. Drug Discovery Today, 22(7), 1069-1076. http://dx.doi.org/10.1016/j.drudis.2017.01.005
» http://dx.doi.org/10.1016/j.drudis.2017.01.005 - Haug, S., Castro, R. P., Kwon, M., Filler, A., Kowatsch, T., & Schaub, M. P. (2015). Smartphone use and smartphone addiction among young people in Switzerland. Journal of Behavioral Addictions, 4(4), 299-307. http://dx.doi.org/10.1556/2006.4.2015.037
» http://dx.doi.org/10.1556/2006.4.2015.037 - Ictech, B. (2019). Smartphones and face‐to‐face interaction: digital Cross‐Talk during encounters in everyday life. Symbolic Interaction, 42(1), 27-45. http://dx.doi.org/10.1002/symb.406
» http://dx.doi.org/10.1002/symb.406 - Khoury, J. M., Freitas, A. A. C., Roque, M. A. V., Albuquerque, M. R., Neves, M. D. C. L., & Garcia, F. D. (2017). Assessment of the accuracy of a new tool for the screening of smartphone addiction. Plos One, 12(5), e0176924. http://dx.doi.org/10.1371/journal.pone.0176924
» http://dx.doi.org/10.1371/journal.pone.0176924 - Kwon, M., Kim, D. J., Cho, H., & Yang, S. (2013a). The Smartphone Addiction Scale: development and validation of a short version for adolescents. Plos One, 8(12), e83558. http://dx.doi.org/10.1371/journal.pone.0083558
» http://dx.doi.org/10.1371/journal.pone.0083558 - Kwon, M., Lee, J. Y., Won, W. Y., Park, J. W., Min, J. A., Hahn, C., … Kim, D. -J. (2013b). Development and validation of a Smartphone Addiction Scale (SAS). Plos One, 8(2), e56936. http://dx.doi.org/10.1371/journal.pone.0056936
» http://dx.doi.org/10.1371/journal.pone.0056936 - Lopez-Fernandez, O. (2017). Short version of the Smartphone Addiction Scale adapted to Spanish and French: towards a cross-cultural research in problematic mobile phone use. Addictive Behaviors, 64, 275-280. http://dx.doi.org/10.1016/j.addbeh.2015.11.013
» http://dx.doi.org/10.1016/j.addbeh.2015.11.013 - Machado, W. L., Vissoci, J., & Epskamp, S. (2015). Análise de rede aplicada à psicometria e à avaliação psicológica. In C. S. Hutz, D. R. Bandeira, & C. M. Trentini (Eds.), Psicometria (pp.125-146). São Paulo: Casa do Psicólogo.
- Mescollotto, F. F., Castro, E. M., Pelai, E. B., Pertille, A., & Bigaton, D. R. (2019). Translation of the short version of the Smartphone Addiction Scale into Brazilian Portuguese: cross-cultural adaptation and testing of measurement properties. Brazilian Journal of Physical Therapy, 23(3), 250-256. http://dx.doi.org/10.1016/j.bjpt.2018.08.013
» http://dx.doi.org/10.1016/j.bjpt.2018.08.013 - Noyan, C. O., Darçın, A. E., Nurmedov, S., Yılmaz, O., & Dilbaz, N. (2015). Validity and reliability of the Turkish version of the Smartphone Addiction Scale-Short version among university students. Anatolian Journal of Psychiatry, 16, 73-81. http://dx.doi.org/10.5455/apd.176101
» http://dx.doi.org/10.5455/apd.176101 - Organization for Economic Co-operation and Development. (2017). PISA: Programme for International Student Assessment 2015 results Paris: Author. Retrieved from http://gpseducation.oecd.org/CountryProfile?primaryCountry=BRA&treshold=10&topic=PI
» http://gpseducation.oecd.org/CountryProfile?primaryCountry=BRA&treshold=10&topic=PI - Sfendla, A., Laita, M., Nejjar, B., Souirti, Z., Touhami, A. A. O., & Senhaji, M. (2018). Reliability of the Arabic Smartphone Addiction Scale and Smartphone Addiction Scale-Short version in two different Moroccan samples. Cyberpsychology, Behavior, and Social Networking, 21(5), 325-332. http://dx.doi.org/10.1089/cyber.2017.0411
» http://dx.doi.org/10.1089/cyber.2017.0411 - Streiner, D. L. (2003). Being inconsistent about consistency: when coefficient alpha does and doesn't matter. Journal of Personality Assessment, 80(3), 217-222. http://dx.doi.org/10.1207/S15327752JPA8003_01
» http://dx.doi.org/10.1207/S15327752JPA8003_01 - Xu, T. T., Wang, H. Z., Fonseca, W., Zimmerman, M. A., Rost, D. H., Gaskin, J., & Wang, J. L. (2019). The relationship between academic stress and adolescents’ problematic smartphone usage. Addiction Research & Theory, 27(2), 162-169. http://dx.doi.org/10.1080/16066359.2018.1488967
» http://dx.doi.org/10.1080/16066359.2018.1488967 - World Health Organization. (2019). International Classification of Diseases for Mortality and Morbility Statistics. (ICD-11) Geneva: Author. Retrieved from https://icd.who.int/browse11/l-m/en
» https://icd.who.int/browse11/l-m/en - World Wide Web Foundation. (2019). 2018 affordability report London: Author. Retrieved from https://a4ai.org/affordability-report/report/2018/
» https://a4ai.org/affordability-report/report/2018/
-
Support:
This study was partially financed by Pontifícia Universidade Católica de Campinas.
Publication Dates
-
Publication in this collection
17 Feb 2020 -
Date of issue
2020
History
-
Received
19 Aug 2019 -
Reviewed
29 Oct 2019 -
Accepted
04 Dec 2019

 Note: Each line represents the zero-order correlation between two variables, and the thickness signifies magnitude. The green color represents a positive correlation. Those nodes (variables) with stronger inter associations appear in the center of the network. The colors of the nodes represent the symptoms: Red node: Disruption; Yellow node: Loss of control; Green node: Disregard; Light blue: Withdrawal; Blue (indigo): Preoccupation; Violet: Tolerance.