Abstract
The growth of non-agricultural activity since the 1980s has reconfigured the economic and social dynamic in Brazil’s rural areas. Our paper intends to describe the impact of this growth on income distribution in rural Brazil. We made use of a method of decomposition of two indicators of income distribution applied to1992 and 1999 Brazilian National Household Sample Survey (PNAD) data: the variation coefficient and the Gini index. It was observed that non-agricultural activities have increased the concentration of rural income and that this phenomenon is more prominent in Region I (states of Brazil’s Northeast and the state of Tocantins) and Region IV (states of São Paulo and Mato Grosso do Sul and the Distrito Federal). It was found that the income concentrating effect of each non-agricultural activity branch (commerce, transformation industry, administration, service) differed by region. In Region I, income from the "Social/Public Administration and Other Activities branch " (a PNAD designation) presents a coefficient of relative concentration greater than a unit, which indicates that income from this activities branch acts to increase the concentration of non-agricultural income in this region. In Region IV, income from industrial activities and from Social/ Public Administration and Other Activities both present coefficients of relative concentration greater than a unit; therefore, both branches act to increase the concentration of income from non-agricultural activities in this region.
distribution of rural income; new rural; rural development; non-agricultural activities; income inequality decomposition
The effects of non-agricultural activities on income distribution in rural Brazil
Henrique D. Neder
Professor, Universidade Federal de Uberlândia
ABSTRACT
The growth of non-agricultural activity since the 1980s has reconfigured the economic and social dynamic in Brazils rural areas. Our paper intends to describe the impact of this growth on income distribution in rural Brazil. We made use of a method of decomposition of two indicators of income distribution applied to1992 and 1999 Brazilian National Household Sample Survey (PNAD) data: the variation coefficient and the Gini index. It was observed that non-agricultural activities have increased the concentration of rural income and that this phenomenon is more prominent in Region I (states of Brazils Northeast and the state of Tocantins) and Region IV (states of São Paulo and Mato Grosso do Sul and the Distrito Federal). It was found that the income concentrating effect of each non-agricultural activity branch (commerce, transformation industry, administration, service) differed by region. In Region I, income from the "Social/Public Administration and Other Activities branch " (a PNAD designation) presents a coefficient of relative concentration greater than a unit, which indicates that income from this activities branch acts to increase the concentration of non-agricultural income in this region. In Region IV, income from industrial activities and from Social/ Public Administration and Other Activities both present coefficients of relative concentration greater than a unit; therefore, both branches act to increase the concentration of income from non-agricultural activities in this region.
Key words: distribution of rural income, new rural, rural development, non-agricultural activities, income inequality decomposition.
1. Introduction
The effects of technological change in Brazilian agriculture in the 1980s reconfigured economic and social relationships in the countrys rural area. Non-agricultural employment slowly entered what had been an essentially agricultural space, often relegating traditional agriculture to a part-time activity.
As shown by Graziano da Silva (1997) and Campanhola and Graziano da Silva (2000), in the 1990s, the growth of Brazils rural economically active population (PEA) was superior to the growth of agricultural PEA. Between 1992 and 1998, Brazils agricultural PEA decreased an average of 2.4% annually while, counteracting a contraction of total rural PEA, rural non-agricultural PEA grew at an average annual rate of 3.6%. In regards to income concentration in the rural areas of Brazil during the 1980s and 1990s, Correa (2000) found that
"Among Brazilian areas, the Center-West region had the highest values of inequality indexes at the end of the nineties while the Northeast is shown as the area with smallest income inequality index values. The Real Plan period, 1995-98, registers growth of inequality in the State of São Paulo and the Center-West region, with some reduction in other regions and in the country as a whole. Also from 1992 to 1998 (rural) inequality is reduced in Brazil as a whole, as well as in the Southeast and the Northeast, though presenting unequivocal growth in São Paulo. The reduction in inequality that is observed in Brazil in the nineties reverses the trend toward inequality growth in the previous decade; and values of inequality indices in 1998 become similar to those at the beginning of the eighties."
The purpose of this paper is to analyze the effects of this new occupational configuration on income distribution in the Brazilian rural area. We make use of two measures of income concentration, the variation coefficient and the Gini Index, and an application of methodology to decompose these indicators values to verify which specific income sources exacerbate rural income concentration. We will also investigate the effect of income coming from the rural social security system (retirement and pension income) on the distribution of household income in rural Brazil. Delgados (2000) recent work found that the Brazilian social security system is becoming more inclusive, "[now] including informal work (regime of family economy) as part of the universal criterion for social security benefits, and through this aspect revolutionizing the conventional social security system, which had been based on formal salaried work." This change increased the systems coverage, making it more effective as a policy to combat hunger and poverty.
It is hoped that our work will contribute to public policies that focus on and stimulate activities that promote more balanced and equitable rural development.
2. Methodology
We will accomplish the decomposition of the income concentration measures (variation coefficient and the Gini index) following the procedure proposed by Shorrocks (1982) and Ercelawn (1984). The calculation is based on 1992 and 1999 PNAD microdata for individuals. We separated the people living in rural households and joined the income per household, obtaining, for each year, a data file per household. The income data were divided by the number of people in the household (including aggregate people) in order to obtain the per capita household income from each source of considered income. We considered a sample of 18,580 rural households for 1992 and 21,694 for 1999. These samples represent Brazils 7,266,365 rural households in 1992 and 7,997,178 in 1999.
Per capita household total income, y, is subdivided into four different income sources: agricultural income, non-agricultural income, transfer income (interpersonal, retirement pensions, other pensions, etc.), and income from interest, rents, and leases. These income sources will be designated y1, y2, y3, y4 respectively, so that
y = y1 + y2 + y3 + y4
The variance of the total income, s2, can be written as the sum of the variances of each income source, s2i, and the double of the covariance between different income sources, sij:
The contribution of each ith income source in the composition of the total variance consists of the sum of the ith variance of income and the part of the covariance allocated to the ith source. One of the decomposition criterion is to allocate to the ith source exactly half of all the covariance that involve the ith income source. We can decompose the variance of total income as follows:
in other words, the absolute contribution of each i-th source of income can be measured by its covariance with total income y1 1 The contribution of the Income1, for instance, for the total variance of the income s 2 will be equal to: . The relative contribution is the same and the inequality is measured by the variance or by the variation coefficient. We adopted the variation coefficient because this measure of inequality respects the axiom of independence of averages: its value doesn't change if a proportional change in all the incomes occurs.. The decomposition of the variation coefficient will be made through the following terms:
Where
wici is the inequality weight of the source i in the total inequality
mi is the source i average income
m is the total average income
ci is the coefficient of relative concentration of the ith source in the total inequality2 2 The coefficient of relative concentration is
ri is the correlation coefficient between the ith source and the total income
We considered that decomposition of the Gini index could be expressed as:
where
n is the number of observations
y is the series of total incomes
r is the correspondents' series "ranks" (corresponding ordinal variable) of y
For the ith income source we have:
where yi and ri refer to the series of incomes of the ith source and corresponding "ranks" respectively. The Gini index will be decomposed through the following relationships:
where R is a relationship of expressed correlation as:
where wigi is the weighted factor of inequality of the ith source in the total inequality and gi is the relative concentration coefficient of the ith source on the total inequality.
Based on decomposition equations (3) and (7) we observed that the ith source of income increases or reduces the inequality if ci (or gi) is larger or smaller than the unit3 3 To understand this interpretation of the income coefficient concentration for the case of the variation coefficient, it is worth remembering that this last one is the result of the correlation coefficient between the income i portion and the total income by the relationship between the variation coefficients of income i and total income. If the coefficient of income variation i is bigger than the coefficient of total income variation, the income i enlarges the income concentration. But, another factor that influences the "enlarging power" of the income concentration of the income i portion is the coefficient of correlation between income i and total income. . The inequality of the weighted factors of the ith source of income in total inequality indicate the relative participation of each source in total inequality.
Brazils rural area was divided into four regions according to the different characteristics of their agricultural development (Kageyama and Silveira (1997):
Region I: the nine Northeast states and the states of Tocantins and Mato Grosso;
Region II: the three South states;
Region III: the states of Minas Gerais, Espírito Santo, Rio de Janeiro, and Goiás;
Region IV: the states of São Paulo and Mato Grosso do Sul, and the Distrito Federal.
3. Results and Discussion
According to data presented in Table 1 and Graph 1, the highest average agricultural income (Income1) in 1992 is found in region IV, Cr$ 302,065.00, and the smallest average agricultural income is found in region I, Cr$ 100,831.00. Region II shows the largest coefficient of agricultural income variation, 336.39%; the smallest is found in region I, 237.32%. The regions with larger levels of agricultural development tend to show higher incomes and greater income heterogeneity. This income profile was substantially the same in 1999 (Table 2), and the regional agricultural income "ranking" remained the same.
We verified that the regions with higher income from non-agricultural productive activities (Income2, regions II and IV) had higher income from agricultural activities (Income1) in both 1992 and 1999.
The relative average incomes in 1992 and 1999 are presented in graphs 3 and 4. All the average incomes are calculated as base-100 indexes for Income1 (agriculture income) for Brazil in 1992 and 1999. In 1992, Income2 (non-agricultural activities) was 55.27% of Income1 (agriculture income). In 1999, the difference between these two income sources is much reduced: Brazilian Income2 reaches 97.45% of Income1. In 1992, average Income2 in region IV was 23.90% superior to average Brazilian Income1; in 1999 average Income2 in that region was 153.82% superior to average Brazilian Income1. This is the only region in which average Income2 becomes higher than average Income1 between 1992 and 1999, although, the difference in income from these two sources decreases between 1992 and 1999 in all other regions.
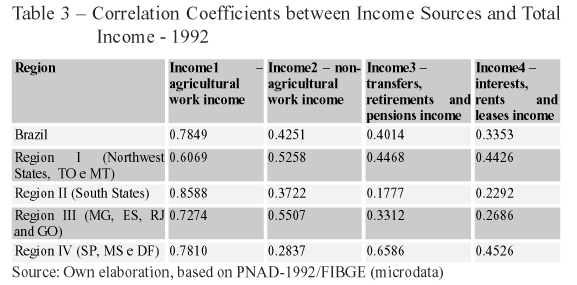
Tables 3 and 4 present the values of the correlation coefficients between incomes from each of four income sources and total income. We verified that the correlation between Income1 and total income is higher than the correlation between Income2 and total income in all four regions in 1992. However, this situation changes remarkably in 1999 when the correlation between Income2 and total income becomes higher than the correlation between Income1 and total income in regions I and IV and in Brazil as a whole. In 1999, income from non-agricultural activities becomes more important than income from agricultural activities as an influence on total income variation. This corresponds with Table 2s 1999 figures that show higher average income from non-agricultural activities than from agricultural activities in regions I and IV.
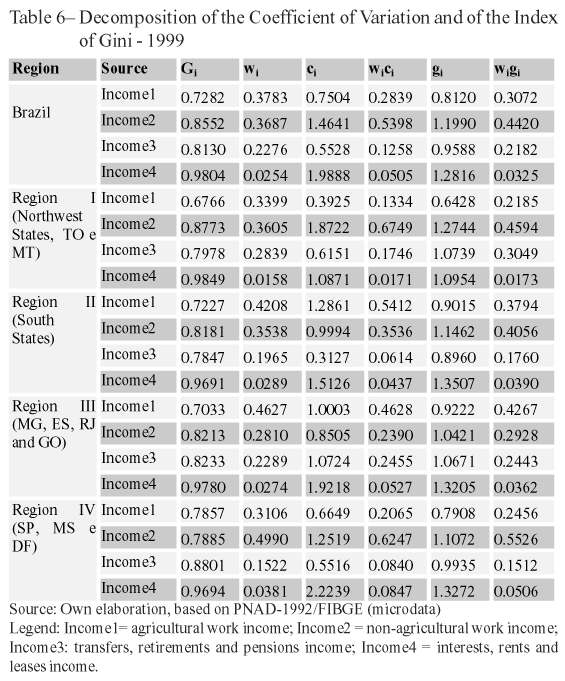
Tables 5 and 6 show the results from estimation of the decomposition factors of the variation coefficient and the Gini index for the income sources and regions in 1992 and 1999 respectively. In these tables we present the following indicators for each region and income source:
Gi the Gini index of income source i,
wi the relationship between average income of source i and total average income,
ci the coefficient of relative concentration corresponding to the variation coefficient,
wici the inequality weight factor of source i in total inequality corresponding to the variation coefficient,
gi the coefficient of relative concentration corresponding to the Gini index
wigi the factor of inequality weight of the source i in the total inequality corresponding to the index of Gini.
In 1992, Brazilian c1 was 1.2252 and c2 was 0.7264 (Table 5), which means that agricultural income was a component of income concentration enlargement and that non-agricultural income was a component of income distribution improvement in 1992. In 1999, this situation inverts: Brazilian c1 decreases to 0.7504 and c2, increases to 1.4641 (Table 6). The same movement is found in indicator gi (g1.(92) = 0.9038, g2.(92) = 1.1229, g1.(99) = 0.8120 and g2.(99) = 1.1990). If we analyze the evolution of weighted inequality (wici or wigi) we see that the participation of Income1 in total inequality decreases from 44.17% in 1992 to 30.72% in 1999, while the participation of Income2 in total inequality grows from 30.33% in 1992 to 44.20% in 1999.
It is observed that regions I and IV are responsible for this inversion in the figures for Brazil as ahole, due to their influence on total rural income concentration. Between 1992 and 1999, in region I, c2 increased from 1.20 to 1.87 and c1 decreased from .93 to .39, while in region IV, c2 increased from .316 to 1.25 and c1 decreased from .99 to .66. Over the same period in the two regions, the values of g2, w2c2, and w2g2 grew some and the values of g1, w1c1, and w1g1 diminished. This indicates that income from non-agricultural activities enlarged income concentration in these two regions in 1999.
The importance of transfers, retirement payments, and donations (Income3) as a component of household income deserves emphasis. Figures given in tables 5 and 6 indicate that this source of income tends to reduce income concentration in the studied rural regions. For the Brazilian rural area as a whole in 1992 (Table 5), c3 (relative coefficient of concentration) had value of 0.5850, g3 had value of 1.0007, w3c3 (weighted inequality) had a value of 0.1247 (for the variation coefficient), and w3g3 had a value of 0.2133 (for the Gini Index). In 1999 (Table 6), c3 and g3 have slightly diminished from their 1992 values, to 0.5528 and 0.9588 respectively. This fact corroborates Delgados (2000) work and reinforces the conclusion that the system of universal rural social security/welfare instituted by the 1998 Brazilian Constitution helps to reduce poverty and hunger in the countrys rural areas. Our study also verifies that the component of income corresponding to retirement, transfer, and pension payments acts to mitigate income concentration in the Brazilian rural area, an important empirical result.
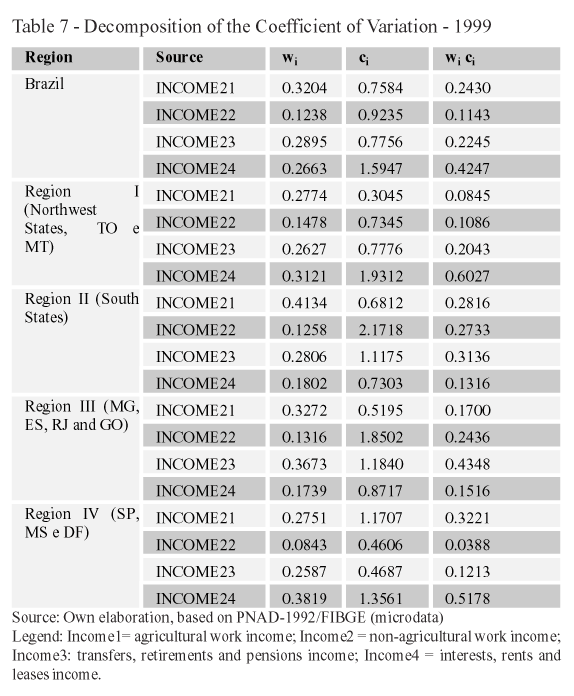
To better identify the income concentrating effect of specific non-agricultural activities, we subdivided this broad income category into several principal branches. The results of this sub-division for 1999 are given in Table 7. In this table, Income21 refers to per capita household income from the Transforming Industries, Construction Industry, and Other Industrial Activities; Income22 refers to the income from Commerce; Income23 consists of income from Services, Auxiliary Services of an Economic Activity, and Transport and Communications; and Income24 refers to income from Social, Public Administration and Other Activities (according to the classification adopted in PNAD).
For the Brazilian rural zone as a whole, the Social, Public Administration, and Other Activities branch of non-agricultural activities enlarged global non-agricultural activities income concentration in 1999, with c24 equal to 1.5947. The contribution of this group to the coefficient of global variation was 42.47% (w24c24). In region I (Northeast states and Tocantins), Social, Public Administration and Other Activities was again the non-agricultural activities branch that enlarged non-agricultural income concentration, with c24 = 1.9312 and w24c24 = 0.6027. In region II, the Commerce branch contributed to increase non-agricultural income concentration. In region III, both the Commerce branch and the Services branch contributed to increase the concentration of income from non-agricultural activities. In region IV, industrial activities (income21-including Civil Construction) were greatly responsible for increasing income concentration (c21 = 1.1707), distinguishing it from the other regions, but the Social, Public Administration and Other Activities branch contributed the most to the global value of the index (w24c24 = 0.5178).
4. Conclusions
Non-agricultural activities constitute an important source of employment generation in the rural area in opposition to the reduction of agricultural employment. It is observed there was an increase in average Brazilian rural income from non-agricultural activities in the 1990s. By the end of that decade, they had become more important than agricultural activities as a source of income in region I (Northeast states and Tocantins) and region IV (Mato Grosso do Sul, São Paulo, and Distrito Federal). For Brazil as a whole, average non-agricultural income was 55.27% of average agricultural income in 1992; by 1999 this relationship had risen to 97.45%. In region IV, this relationship rose to 253.82%, showing the high potential for income generation from non-agricultural activities.
However, income generated by non-agricultural activities has the peculiarity of enlarging the concentration of rural income, which is evidenced by the larger than unit coefficients of relative concentration (ci and gi) calculated in our study and made more evident in the cases of Brazilian regions IV and I. This finding indicates that there is not a direct relationship between the phenomenon of income concentration and the level of agricultural or rural development in the regions.
The income concentrating function of non-agricultural activities results from the influence of different branches of non-agricultural activity, with the influence of each branch varying by region. For the country as a whole, the Social, Public Administration, and Other Activities branch of non-agricultural activities (Income24) contributed 42.47% of the total concentration of Brazilian non-agricultural income in1999, as shown by the weighted inequality factor (wici) for Income24 in Table 7. In region II, the Commerce non-agricultural activity branch further enlarges income concentration, with a relative participation in total income inequality from non-agricultural activities of 27.33%. In region III, both Commerce and Services activity branches further enlarge income concentration. In region IV, the branch formed by Social, Public Administration and Other activities, and to a somewhat lesser extent, the industrial activities branch (Incom21) participate to enlarge income concentration from non-agricultural activities, 51.78% and 32.21% respectively. Many activities can have a high concentration coefficient (ci or gi), indicating that they increase income concentration but may make a relatively reduced contribution to income concentration (wici or wigi), such as the case of Income22 (Commerce) in Region III (Minas Gerais, Espírito Santo, Rio de Janeiro and Goiás).
Undoubtedly, non-agricultural activities contribute to augment rural household income, but these activities are perniciously revealed to have made an ineffective contribution to lessen the great distortion in income distribution among Brazils rural population. To alleviate this distortion, the impacts of the different branches of rural activity on family welfare need to be identified. This study has preliminarily identified some of these impacts, which may be very important in the construction of Brazilian rural development policies.
This work also verifies that retirement, transfer, and pension payments reduce income concentration, reaffirming previous findings regarding the effectiveness of the rural social security and welfare systems in the mitigation of income concentrating tendencies.
- ADAMS JR, R.H. & HE,J.J. 1995. Sources of income inequality and poverty in rural Pakistan, Research Report 102, International Food Policy Research Institute, Washington, D.C.,
- CORREA, A.M.C.J. 2000. Evolução do Rendimento Médio, Desigualdade e Pobreza entre as Pessoas Ocupadas na Agricultura Brasileira: Uma Análise Regional do Período 1981-98. Seminário Desafios da Pobreza Rural no Brasil, IPEA / NEAD / Banco Mundial, Rio de Janeiro.
- DELGADO, G. e CARDOSO JR., J. C. 2000. A Universalização de Direitos Sociais no Brasil: A Previdência Rural nos Anos 90, Brasília, IPEA.
- ERCELAWN, A. 1984. Income inequality in rural Pakistan: A study of sample villages. Pakistan Journal of Applied Economics 3 (Summer): 1-28.
- FIBGE Pesquisa Nacional por Amostra Domiciliar dados em CD ROM (diversos anos da década de 90).
- GRAZIANO DA SILVA, J. 1997. "O novo rural brasileiro" In: Revista Nova Economia, Belo Horizonte, 7 (1):43-81.
- KAGEYAMA,A. A.,SILVEIRA,J. M. J. 1997. Agricultura e questão regional. Revista de Economia e Sociologia Rural Brasília/DF: SOBER, v.35, n.2, p.9 33.
- SHORROCKS, A. F. 1982. Inequality decomposition by factor components. Econometrica 50 (January): 193-211.
Publication Dates
-
Publication in this collection
16 July 2003 -
Date of issue
June 2003


