Abstracts
A partial equilibrium model for the meat market is fit to Brazilian data by three stages least squares. The model is consistent with the data and may be used for simulation purposes. In this context we compare model simulations for the near future with the OECD/ Aglink outlook. To illustrate using the model for simulations in policy assessments, we investigate the effect of a relative increase in corn price on the poultry and pork markets, coeteris paribus.
Meat markets; elasticities; three stage least squares; simultaneous system of equations
Um modelo de equilíbrio parcial para o mercado brasileiro de carnes é ajustado por meio de mínimos quadrados em três estágios. O modelo mostra-se consistente com as observações e pode ser usado para simulações. Neste contexto, comparam-se simulações para o futuro próximo com as projeções da OECD/Aglink. Para ilustrar o emprego do modelo em simulações de políticas investiga-se o efeito de um aumento relativo no preço do milho nos mercados de carne suína e de frango, coeteris paribus.
Mercado de carnes; elasticidades; mínimos quadrados em três estágios; sistema de equações simultâneas
The meat market in Brazil: a partial equilibrium model1 1 We are grateful to CNPq for supporting this research.
Geraldo da Silva e SouzaI; Eliseu AlvesII; Rosaura GazzolaIII; Renner MarraIV
IPesquisadores da Embrapa. E-mail: geraldo.souza@embrapa.br
IIPesquisadores da Embrapa. E-mail: eliseu.alves@embrapa.br
IIIPesquisadores da Embrapa. E-mail: rosaura.gazzola@embrapa.br
IVPesquisadores da Embrapa. E-mail: renner.marra@embrapa.br
ABSTRACT
A partial equilibrium model for the meat market is fit to Brazilian data by three stages least squares. The model is consistent with the data and may be used for simulation purposes. In this context we compare model simulations for the near future with the OECD/ Aglink outlook. To illustrate using the model for simulations in policy assessments, we investigate the effect of a relative increase in corn price on the poultry and pork markets, coeteris paribus.
Key Words: Meat markets, elasticities, three stage least squares, simultaneous system of equations.
JEL: C 32
RESUMO
Um modelo de equilíbrio parcial para o mercado brasileiro de carnes é ajustado por meio de mínimos quadrados em três estágios. O modelo mostra-se consistente com as observações e pode ser usado para simulações. Neste contexto, comparam-se simulações para o futuro próximo com as projeções da OECD/Aglink. Para ilustrar o emprego do modelo em simulações de políticas investiga-se o efeito de um aumento relativo no preço do milho nos mercados de carne suína e de frango, coeteris paribus.
Palavras-Chave: Mercado de carnes, elasticidades, mínimos quadrados em três estágios, sistema de equações simultâneas.
1. Introduction
As pointed by Gazzola et al. (2006), researchers and institutions have been showing a growing interest in the usage of outlook models for agricultural commodities. Typical examples are provided by OECD (2006), Contini et al. (2006), Trostle (2006), USDA (2007) and FAPRI (2007). Among these models, one with great appeal is the partial equilibrium model Aglink developed by OECD. The advantage of having a partial equilibrium model relative to unstructured time series models is the possibility of using it to assess the effects of sector polices via simulation. Indeed this is the general motivation of computable equilibrium models.
The problem with the approach is that the models are rarely supported by the data. Elasticities are computed elsewhere and freely used to specify equations. The Aglink/2006 outlook for the meat market for example is examined in detail in Gazzola et al. (2006). These authors show in their article that elasticities estimated from regressions differ markedly from the ones used in the specification of the meat market models and there are frequent sign inversions indicating probable specification errors.
For the current analysis, a set of equations to explain the meat market (beef, poultry and pork) that is consistent with the observations available is proposed based on the OECD/Aglink data. Elasticities are estimated by three stage least squares directly from models suggested by economic theory. The response functions are linear in natural logs and therefore belong to the Cobb-Douglas family. The poultry market was the only market for which the demand function was difficult to identify. In this case we used a statistical correction to the Aglink specification to adjust the own price elasticity.
To illustrate simulations from the estimated model we consider a three step forward outlook and the effect of a 1 percent increase in corn price in the poultry and pork markets. All key macroeconomic variables are kept constant in this last exercise. The outlook, on the other hand, is based on time series projections of these variables via state space models (Dickey and Brocklebank, 2004) as suggested in Gazzola et al. (2006).
Our discussion in the article proceeds as follows. In Section 2, we update the descriptive discussion in Gazzola et al. (2006) on the meat market. In Section 3 we discuss the general approach followed to specify our partial equilibrium model and show the systems fitted for beef, poultry and pork. In Section 4 we show simulation exercises derived from the equations fitted in Section 3. Finally in Section 5 we summarize the main findings and present our conclusions from the statistical exercise.
2. Descriptive aspects of the meat market
The study of the world meat market is of extreme importance to Brazil since meat exports represent a sizable chunk of total Brazilian exports. The descriptive aspects of the meat market are shown in Gazzola et al. (2006). Here we update their description to include final 2005 and 2006 information. The agribusinesses in Brazil represented in 2006, 35.95% of the total Brazilian exports and 17% of this total are due to meat exports (MDIC, 2007).
These figures motivate the need for a continuous observation on the variables composing the meat market. That is also the fundamental economic reason why organizations like the Ministry of Agriculture and Embrapa are showing an increasing interest in the development of econometric models explaining the agents' behaviors in the meat market and in other commodities markets likewise important for the Brazilian agribusinesses.
A typical instance of the need of models to assess economic impacts is the recent issue raised by the US interest to increase its ethanol production. The general expectations are for increase in corn price. Since poultry and pork feed in Brazil are heavily based on corn, an increase in the international price of corn will affect the corn market in Brazil and indirectly the poultry and pork prices affecting demand, production and exports in these markets.
The quantitative importance of the meat aggregate, which is dominated by beef, pork and poultry, for the Brazilian economy, can be inferred from Table 1 where we show the evolution in the recent past of the total Brazilian exports, the exports generated by the agribusinesses as a whole and of the meat exports. The total of meat exports has been growing steadily, representing, in 2006, 6.29% of the total volume of the Brazilian exports and 17.48% of the total exports generated by the agribusinesses.
The Brazilian participation is also relevant in terms of world aggregates.
OECD (2007) data indicate that the world production of meat is concentrated basically in the United States, European Union, China, Brazil and OAS (Other Asian Countries - see OECD (2007) definitions).
Based on OECD data, those countries and aggregates represented 61% of beef production in the world, 84% of the pork production and 75% of the poultry production in the period 1995-2006.
In this same period Brazil was the third world producer of beef and fifth of poultry and pork and it has by far the largest geometric annual growth rates of poultry and pork production, overcoming the United States, European Union, China and the aggregate OAS. Brazil is second in beef growth being dominated only by China.
Using OECD (2007) data Brazilian production rates are 4.70% (±0.27%) for beef, 7.42% (±1.15%) for pork and 8.83% (±0.34%) for poultry.
In terms of world exports in 2006, Brazil is the largest beef exporter with 2.59 million tons (ABIEC, 2007; FAO, 2007) and of poultry meat with 2.71 million tons (ABEF, 2007; USDA, 2007).
In terms of pork meat exports Brazil is fourth trailing the European Union, United States and Canada (OECD, 2007; USDA, 2007).
During the period 1995-2006 (OECD, 2007) Brazil shows the highest rates of geometric annual growth for beef, pork and poultry exports. The estimated rates are 24.01% (±1.4%) for beef, 30.43% (± 3.14%) for pork and 20.89% (±1.39%) for poultry.
Finally, looking at meat consumption for the period 1995-2006, Brazil occupies the third position in beef, the fifth (OECD, 2007) for poultry and the eighth position in the consumption of pork meat (OECD, 2007).
3. Partial equilibrium models for beef, poultry and pork
The partial equilibrium models we consider for beef, poultry and pork all obey some variation of the following simple structure. The basic model, excluding identities, is a system with three equations given by
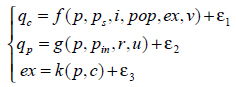
where qcis the demand function, qp can be considered as the supply function, ex denotes exports, p is own price, ps is a price vector of substitutes, i is per capita income, pop is population, v and u are covariates or lagged values of consumption or production, is p in a vector or index of input prices, r is the (Brazilian -Selic) interest rate, c is the exchange rate, and the εl are non observable errors. All variables measured in natural logs.
Relationships are assumed to be linear so that all response functions belong to the Cobb-Douglas family. Prices for beef, poultry and pork are computed dividing the OECD (2007) price (Atlantic price for beef and pork and USA for poultry) by the USA consumer price index and multiplying the result by the exchange rate.
Table 2 describes the main variables used in our models. The source information on annual data is available in the Embrapa-SGE (2007) outlook data base. We used the period 1995-2006 in our analysis.
3.1 The beef market
Table 3 shows three stage least squares estimates for the beef market. The system fitted is given by

The R-square coefficients for these equations are 78.8%, 81.0% and 77.1%, respectively. The inclusion of prices of substitutes (poultry and pork) did not improve the model as well as the use of an input price index. All signs have the expected direction.
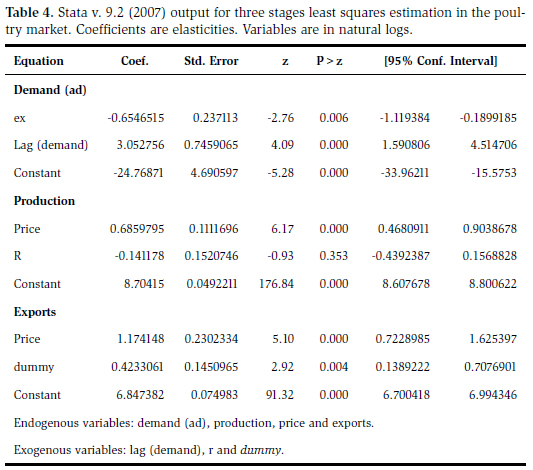
3.2 The poultry market
The several alternatives we considered for the poultry market did not lead to an acceptable functional form for the demand equation with proper signs of the coefficients. For this reason instead of fitting the demand function directly we used the residual from the OECD demand specification relative to the observed demand as the dependent variable. The procedure was used to compute the price elasticity. Corrections for the income and population elasticities in the Aglink formulation were not needed. The partial equilibrium model for the poultry market is

Here

The expression inside parenthesis is, but for a constant term, the OCDE/Aglink specification of the Brazilian poultry demand function. The variable dummy is an indicator and was introduced to take into account effects of the bird flu (avian influenza) since 2003.
Since all variables are measured in natural logs the demand price elasticity is given by

We notice that we did not find significant the input price index in the production curve neither the exchange rate in the export equation.
Table 4 shows three stage least squares for the poultry market. R squares for the system equations are 80.2%, 85.1% and 87.6%, respectively.
3.3 The pork market
The set of behavioral equations for the pork market is given by

For model specification in the pork market we did not find significant the inclusion of beef as a substitute. The variable dummy* is an indicator variable shifting the demand equation since the 2000. We noticed a significant level shift in the demand curve beginning in 2000. As with the poultry and the beef markets we did not find the input index significant. It seems that here, as with the other markets, that the interest rate is capturing the effect of input prices.
Table 5 shows the estimates for the pork market. Apparently we produced here the best fit of all models. R squares for the equations are 99.3%, 81.5%, and 90.3%, respectively for domestic demand, supply and exports, respectively.
4. A simulation exercise
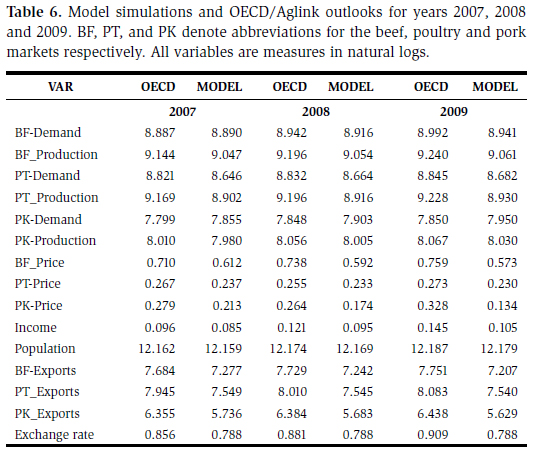
We now use the results of Section 4 to simulate the meat market model in two instances. Firstly we produce an outlook for demand, supply, exports and prices for three years ahead. The results are compared with the OECD/Aglink values. Since the models are different as well as the assumptions made on key macroeconomic variables we do not expect a close agreement of these figures. Secondly we inspect the effect of a 1% increase in corn price on the poultry and pork markets.
The assessment of such impact has been of concern lately due to a suspected substantial shift of corn production to ethanol production in the United States. The action will very likely increase corn price with a spill over effect on the corn, poultry and pork markets in Brazil. The analysis we set forth in this context is coeteris paribus since we keep constant per capita income, the interest rate, the exchange rate and the demographics.
The outlook for the meat market is shown in Table 6 in log form. Aglink/OECD forecasts are also shown. For the poultry market we found best to estimate the quantities consumed via the supply function. The supply function was estimated using three stage least squares replacing the production curve by the supply function in the analysis. The equation fitted, in log form, is
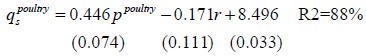
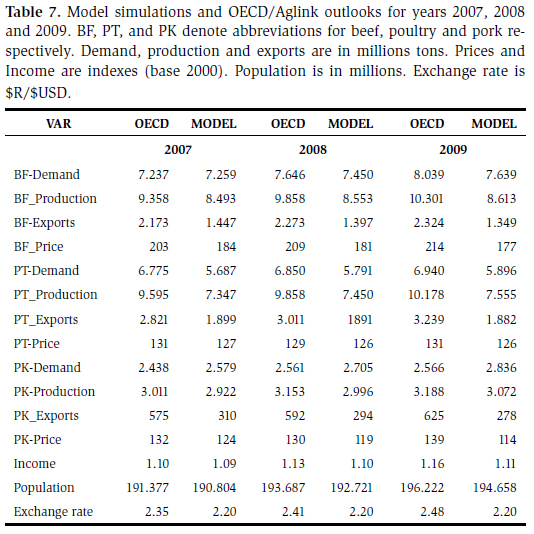
In Tables 6 and 7 we show forecasts, for years 2007, 2008 and 2009, as reported by OECD/Aglink and those obtained simulating the markets equations (Model). Table 7 show forecasts in their original units and Table 6 shows their natural logs. We see that, although the values are somewhat in the same order of magnitude, the Model outlook is consistently lower than the OECD/Aglink outlook. This is due to model differences and to the assumptions imbedded in the forecast of the exogenous variables in use. Typically we use state space forecasts of the economic aggregates which lead to more conservative (lower) estimates. We are using the value 2.2 for the exchange rate in 2009 and OECD 2.48. Another example is income. We assume a 2% increase in per capita income during the period 2007-2009 and OECD/Aglink 4.9%.

To assess the impact of corn prices in the pork and poultry markets we use a transfer function approach, regressing, via three stage least squares, the prices of pork and poultry on the price of corn. These equations were estimated adding the corresponding equations to the respective market equations. This procedure avoids spurious regressions (Johnston and Dinardo, 1994).
The equations estimated are

for poultry prices and

for pork prices.
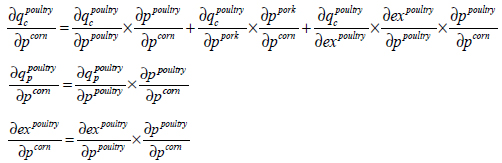
Using the chain rule one obtains, for the poultry market, the following partial derivatives for domestic demand, production and exports, respectively. These derivatives serve the purpose to estimate the impact of a relative increase in corn price on the poultry market. Similar expressions may be worked out for the pork market.
First we analyze the poultry market. Based on the estimation results of Table 4, the expected decrease in the domestic demand for poultry resulting from a 1% relative increase in corn price is estimated by

Using the system of equations which led to the transfer function parameter the estimate would be -1.14%. Therefore we could reasonably expect a decrease in the range -1.14% to -1.05%.
For production the expected increase is

Using the alternative system the figure is 0.728% and the range for increase in production is somewhere between 0.539% and 0.728%. For exports we get an increase of
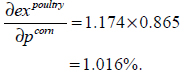
The appropriate increase of exports will likely be in the interval from 1.016% to 1.310%.
The same order of ideas applied to the pork market leads to the ranges (-0,088%, -0.074%), (0.358%, 0.431%), and (0.873%, 1.017%) for domestic demand, production and exports, respectively.
5. Summary and conclusions
This article presents descriptive statistics related to the world meat markets emphasizing the Brazilian participation. From this analysis we conclude that the Brazilian share in the meat market is growing steadily. Meat exports represent a significant percentage of the total exports in Brazil generated by the agricultural sector.
This profile justifies the effort made by Brazilian institutions to derive econometric models not only capable to produce reliable forecasts but also adequate to assess the effects of exogenous shocks and of specific policies affecting the market. We seemed to have achieved this objective for the meat market. Even with the small number of observations available we were able to define models in accordance with economic theory and supported by the data.
These results, for this kind of application, are original in Brazil.
To illustrate the use of the estimated system of equations we simulated the structure for the near future and compared the results with the OECD/Aglink predictions. Our simulations are consistently more conservative. Here we should stress the fact that long run forecasts are meaningless since it is almost impossible to predict the evolution of key macroeconomic variables like per capita income, inflation, interest rates and exchange rates far into the future. Both, time series and structural models will, inevitably, produce confidence intervals so large that they will not be of practical use. As far as OECD's Aglink general outlook is concerned, as shown in Gazzola et al. (2006), the Brazilian data do not support the corresponding computable partial equilibrium model.
Finally in regard to the study of shocks we considered the effect of a relative 1% price increase in corn price on the poultry and pork markets. On the poultry market the domestic demand would decrease by 1.053%, production would increase by 0.539% and exports would increase by 1.016%. On the pork market domestic demand would decrease by 0.088%, production would increase by 0.358% and exports would increase by 0.873%.
Besides the purpose of illustration, the estimation of the expected impact of an increase in corn price is of much interest to corn, poultry and pork producers, since corn is an important component of the production costs of poultry and pork.
6. References
- ABEF. Associação Brasileira dos Produtores e Exportadores de Frangos 2007. Available in: <http://www.abef.com.br/>. Access on: March 20, 2007.
» link - ABIEC. Associação Brasileira das Indústrias Exportadoras de Carne 2007. Available in: <http://www.abiec.com.br/tabela.asp?id_ periodo=2/>. Access on: March 20, 2007.
» link - BROCKLEBANK, J. C.; DICKEY, D. A. SAS system for forecasting time series 2nd ed. Cary: SAS Publishing, 2004. 420 p.
- CONTINI, E.; GASQUES, J. G.; LEONARDI, R. B. A.; BASTOS, E. T. Projeções do agronegócio no Brasil e no mundo. Revista de Política Agrícola, Brasília: CONAB, v. 14, n. 1, p. 45-56, jan./mar. 2006.
- FAPRI. World Agricultural Outlook Iowa State University. 2007. 76p.
- FAO. Food and Agriculture Organization of the United Nations. FAOSTAT 2007. Available in: <http://faostat.fao.org/>Access on: March 12, 2007.
- GAZZOLA, R.; COELHO, C. H. M.; SOUZA, G. S.; MARRA, R.; OLIVEIRA, A. J. Mercado de carnes: aspectos descritivos e experiências com o uso de modelos de equilíbrio parcial e de espaço de estados. Revista de Política Agrícola, Brasília: CONAB, v. 14, n. 1, p. 84-101, jan./mar. 2006.
- JOHNSTON, J.; DINARDO, J. Econometric methods 4th ed. New York: McGraw-Hill, 1997. 531 p.
- MDIC. Ministério do Desenvolvimento, Indústria e Comércio Exterior 2007. Available in: <http://aliceweb.mdic.gov.br/>. Access on: March 14, 2007.
» link - OECD-FAO. Organisation for Economic Co-Operation and Development-Food and Agriculture Organization of the United Nations. Agricultural Outlook 2006-2015 212 p. 2006.
- OECD. Organisation for Economic Co-operation and Development.Available in: <https://www.oecd.org/login/0,2955,en_17642234_17642806_1_1_1_1_1,00.html?appId=13>. Access on: March 20, 2007.
» link - STATA v. 9.2 StataCorp LP, College Station, TX, USA. 2007.
- TROSTLE, R. G. Agricultural trade: International Ag Baseline Projections. Revista de Política Agrícola, Brasília: CONAB, v. 14, n. 1, p. 102-116, jan./mar. 2006.
- USDA. United States Department of Agriculture. 2007. USDA Agricultural Projections to 2016. Office of the Chief Economist, World Agricultural Outlook Board, U.S. Department of Agriculture. Prepared by the Interagency Agricultural Projections Committee. Long-term Projections Report OCE-2007-1, 110 p.
Publication Dates
-
Publication in this collection
01 Apr 2009 -
Date of issue
Dec 2008