Abstract
Crystallinity is an important property of lignocellulosic biomass due to its significant effect on acid/enzymatic hydrolysis. Normally, physicochemical analysis, such as powder X-ray diffraction and nuclear magnetic resonance, is used to reveal the crystallinity content. However, these analytical methods are expensive and laborious. In this context, methods that rapidly predict the crystallinity are important, even if used only for screening calibration. Thus, we intend to show the potential of near-infrared spectroscopy (NIRS) and chemometrics to replace reference methods in crystallinity determination. The results show that NIRS can be used to determine crystallinity in banana residues by the use of partial least squares regression, providing good coefficients of determination (R2cal,pred > 0.82), low relative errors (< 14%) and good range error ratio (≥ 7.7). The interpretation of the regression coefficients, multivariate figures of merit and external validation results indicate a strong relationship between the NIR spectrum and crystallinity in banana samples.
Keywords:
lignocellulosic biomass; crystallinity; X-ray diffraction; near infrared spectroscopy; chemometrics
Introduction
Cellulose is a natural polymer consisting of a linear chain of β (1→4) linked glucose molecules. Each repeating unit contains hydroxyl groups able to form hydrogen bonds between cellulose chains governing the physical properties of cellulose.11 Klemm, D.; Heublein, B.; Fink, H-P.; Bohn, A.; Angew. Chem. Int. 2005, 22, 3358.,22 Moon, R. J.; Martini, A.; Nairn, J.; Simonsen, J.; Youngblood, J.; Chem. Soc. Rev. 2011, 40, 3941. The intrachain hydrogen bonding between hydroxyl groups and oxygens stabilizes the linkage and results in the linear configuration of the cellulose chain.22 Moon, R. J.; Martini, A.; Nairn, J.; Simonsen, J.; Youngblood, J.; Chem. Soc. Rev. 2011, 40, 3941. During cellulose formation, van der Waals and intermolecular hydrogen bonds between hydroxyl groups and oxygens of adjacent molecules promote the aggregation of cellulose chains to form microfibrils. These microfibrils contain two different regions. The crystalline region consists of highly ordered cellulose molecules, while the molecules in the amorphous region are less highly ordered.22 Moon, R. J.; Martini, A.; Nairn, J.; Simonsen, J.; Youngblood, J.; Chem. Soc. Rev. 2011, 40, 3941.,33 John, M. J.; Thomas, S.; Carbohydr. Polym. 2008, 71, 343. The major part of cellulose (approximately 2/3 of the total cellulose) is in the crystalline form.44 Chum, H. L.; Douglas, L. J.; Feinberg, D. A.; Schroeder, H. A.; Solar Energy Research Institute; Evaluation of Pretreatments of Biomass for Enzymatic Hydrolysis of Cellulose; NREL Publications: Golden, Colorado, 1985, pp. 77. Seven different crystalline forms of cellulose have been identified by X-ray diffraction (XRD), with distinct physical and chemical characteristics.55 O'Sullivan, A. C.; Cellulose 1997, 4, 173.
The extensive hydrogen bonding and compact structure of crystalline cellulose hinder the hydrolysis process, while the amorphous region tends to be easily hydrolyzable by acids/enzymes.66 Bungay, H. R.; Energy, the Biomass Options; John Wiley and Sons: New York, 1981. Normally, one partial hydrolysis occurs, which removes the amorphous regions from cellulose, increasing the proportion of the crystalline region that is resistant to further hydrolysis.77 Fan, L. T.; Lee, Y.; Beardmore, D. H.; Biotechnol. Bioenerg. 1980, 22, 177. Therefore, concentrated acids and/or a high amount of enzymes are used in acid and enzymatic hydrolysis, respectively, to reduce the crystallinity of cellulose as much as possible and fully convert it to the amorphous state.88 Yu, Y.; Lou, X.; Wu, H.; Energy Fuels 2008, 22, 46. Because the crystallinity of a lignocellulosic material is considered one of the main factors influencing the effectiveness of acid/enzymatic hydrolysis,99 Philipp, B.; Jacopian, V.; Loth, F.; Hirte, W.; Schulz, G.; Hydrolysis of Cellulose: Mechanisms of Enzymatic and Acid Catalysis, Advances in Chemistry Series, Brown Jr., R. D.; Jurasek, L., eds.; American Chemical Society: Washington, 1979, pp. 127.
10 Laureano-Perez, L.; Teymouri, F.; Alizadeh, H.; Dale, B. E.; Appl. Biochem. Biotechnol. 2005, 121, 1081.-1111 Yoshida, M.; Liu, Y.; Uchida, S.; Kawarada, K.; Ukagami, Y.; Ichinose, H.; Kaneko, S.; Fukuda, K.; Biosci. Biotechnol. Biochem. 2008, 2, 805. it is important to know the level of crystallinity before initiating subsequent steps to optimize the quantities of reagents required, reducing the costs and time of analysis.
XRD and solid-state 1313 Park, S.; Baker, J. O.; Himmel, M. E.; Parilla, P. A.; Johnson, D. K.; Biotechnol. Biofuels 2010, 3, 1.C nuclear magnetic resonance (NMR) are currently used to determine the crystallinity of a lignocellulosic biomass.1212 Segal, L.; Creely, J. J.; Martin, A. E.; Conrad, C. M.; Text. Res. J. 1959, 29, 786.,1313 Park, S.; Baker, J. O.; Himmel, M. E.; Parilla, P. A.; Johnson, D. K.; Biotechnol. Biofuels 2010, 3, 1. However, it is not always suitable for crystallinity estimation, especially for screening purposes. Moreover, the disadvantages related to XRD and NMR techniques, such as being complex, time consuming and expensive, limit their use. In this context, near-infrared spectroscopy (NIR) is a fast technique, non-destructive and of simple application, suitable to replace the traditional methods.1414 Rambo, M. K. D.; Amorim, E. P.; Ferreira, M. M. C.; Anal. Chim. Acta 2013, 775, 41. This technique based on vibration spectroscopy makes it possible to reveal physical properties, such as the crystallinity content,1515 Basch, A.; Wasserman, T.; Lewin, M.; J. Polym. Sci. 1974, 12, 1143.
16 Jiang, Z. H.; Zhong, Y.; Chi, L. S.; Chung, Y. H.; J. Wood Sci. 2007, 53, 449.
17 Qu, Z.; Wang, L.; Adv. Mat. Res. 2011, 183, 1215.-1818 Zidan, A. S.; Rahman, Z.; Sayeed, V.; Raw, A.; Yu, L.; Khan, M. A.; Int. J. Pharm. 2012, 423, 341. which is possible due to the fact that the cellulose crystallinity, which involves intermolecular hydrogen bond and crystalline networks, is clearly evident in the infrared spectra. As the C-O and O-H stretching and C-H deformation are vibrational modes predominating in the NIR region, it is expected that this region will be influenced by the crystallinity.1515 Basch, A.; Wasserman, T.; Lewin, M.; J. Polym. Sci. 1974, 12, 1143.
To evaluate a physical property using NIR spectra, multivariate methods such as partial least squares (PLS) can be used to build a regression model that makes the quantification possible. The process requires a calibration data set, for which the reference values for the property of interest and the measured NIR spectra are known for all samples. After the multivariate calibration model is constructed and validated, it can be directly applied to the NIR spectra to predict the property of interest of new samples.1515 Basch, A.; Wasserman, T.; Lewin, M.; J. Polym. Sci. 1974, 12, 1143.
16 Jiang, Z. H.; Zhong, Y.; Chi, L. S.; Chung, Y. H.; J. Wood Sci. 2007, 53, 449.
17 Qu, Z.; Wang, L.; Adv. Mat. Res. 2011, 183, 1215.-1818 Zidan, A. S.; Rahman, Z.; Sayeed, V.; Raw, A.; Yu, L.; Khan, M. A.; Int. J. Pharm. 2012, 423, 341.
Kelley et al.1919 Kelley, S. S.; Elder, T.; Groom, L. H.; Wood Fiber Sci. 2005, 37, 14. used NIR and PLS regression models for the determination of crystallinity content in loblolly pine wood and the results obtained were of poor quality, with R2cal and R2pred of 0.52 and 0.15, respectively for a model with 2 latent variables (LV). Qu et al.1717 Qu, Z.; Wang, L.; Adv. Mat. Res. 2011, 183, 1215.investigated the ability of NIR to predict the crystallinity of wood. For a PLS model with 8 LV, it was possible to achieve R2cal and R2pred of 0.93 and 0.72, respectively. Jiang et al.1616 Jiang, Z. H.; Zhong, Y.; Chi, L. S.; Chung, Y. H.; J. Wood Sci. 2007, 53, 449. also evaluated the wood crystallinity. These authors obtained excellent results (R2cal and R2pred values of 0.95 and 0.86, respectively) showing that the NIR data was well correlated with crystallinity determined by the X-ray diffraction. They obtained satisfactory results for the range error ratio (RER), relative standard deviation (RSD). However, the quality of the models from the works mentioned above were not assured by statistical parameters such as the figures of merit.
In this work, NIR spectra and multivariate methods have been applied to rapidly determine the crystallinity of cellulose in banana residues with satisfactory results. The quality of the models obtained is ensured by the determination of the figures of merit, RER and RSD values, external validation set, and interpretation of the regression coefficients.
Experimental
Samples
Sixty-nine samples of banana were obtained and submitted to the further analysis. They are distributed among stalk, stem, rhizome, rachis and leaves. The identification, fraction, origin, species and year of harvest of these samples are indicated in Table 1.
Approximately 500 g of each biomass was cut into small pieces, mixed, and dried at 105 ºC in an oven until constant weight. The samples were then ground in a Romer micro mill (Romer Labs, São Paulo, Brazil) equipped with a number 10 mesh size and then sieved with a number 40 mesh size.
After sieving, the samples were submitted to an extraction process (ethanol 95%, 100 ºC, 1500 psi) in a Dionex ASE 200 system (Thermo Fisher Scientific, Waltham, MA, USA) to assess whether the extractives have substantial influence on the cellulose crystallinity.
XRD analysis
The reference values of crystallinity were determined by XRD. The diffractograms were recorded using an X-ray diffractometer (XRD 7000 Shimadzu) with Cu Kα radiation, a voltage of 30 kV and a current of 20 mA. The scanning range was from 2θ = 5º to 50º at a scan speed of 0.071º s-1.
There are several methods in the literature based on using the diffractogram to calculate the crystalline content,2020 Xu, F.; Shib, Y. C.; Wang, D.; Carbohydr. Polym. 2013, 94, 904. and two of them were applied in this work. In the first one, which will be designated method A, the crystallinity index (CI) of a given sample was calculated by subtracting the minimum intensity of the peak 101 (amorphous band (Iam)) from the maximum intensity that represents the crystalline portions (Ic) of the peak 002 and then taking the ratio between the difference and the total intensity,1212 Segal, L.; Creely, J. J.; Martin, A. E.; Conrad, C. M.; Text. Res. J. 1959, 29, 786. according to equation 1. Figure 1a shows an example of the crystalline and amorphous peaks used in this equation.

Diffractogram of a banana sample (stem) illustrating the two most common methods for calculating the crystallinity index, CI: (a) by the intensity method and (b) by the area method.
The second approach, called method B, is a deconvolution method. Individual peaks were fitted by Gaussian functions, as shown in Figure 1b. For this purpose, the peak fitting program (PeakFit; www.systat.com) was used, and interactions continued until the convergence of ‡ ‡ ois the experimental value, and ve is the expected value. where v χ2, which corresponds to an R2 value greater than 0.94 for all deconvolutions. The sum of the area under the crystalline adjusted peaks (Ic), designated as 101, 101 and 002 in Figure 1b, and of the amorphous broad band (Iam) were used to calculate the CI1313 Park, S.; Baker, J. O.; Himmel, M. E.; Parilla, P. A.; Johnson, D. K.; Biotechnol. Biofuels 2010, 3, 1.,2121 Sottys, J.; Lisowski, Z.; Knapczyky, J.; Acta Pharm. Technol. 1984, 30, 174. according to equation 2.

NIR analysis
The NIR diffuse reflectance spectra were acquired using a FOSS XDS spectrometer (FOSS, Hillerød, Denmark) equipped with a Rapid Content Analyzer (RCA) module. Spectra from 1100 to 2500 nm were collected at a grating resolution specified as 0.5 nm. Three spectra were recorded for each sample, and the average spectrum was used for data analysis.
Data analysis
Diffractograms were explored by principal component analysis (PCA) on mean-centered raw data to reveal the hidden structure within the XRD data set. In this method, a small set of orthogonal principal components that maximizes the variance in the data set is defined. The dimensionality of the data set is reduced, providing a visual representation of the relationships between banana samples and variables.2222 Martens, H.; Naes, T.; Multivariate Calibration; John Wiley & Sons: New York, 1996.
The collected NIR spectra of the banana fractions were used to construct a regression model that relates the matrix (X) containing spectral data and the vector (y) representing the crystallinity content. PLS was used to obtain the calibration models. In this method,2222 Martens, H.; Naes, T.; Multivariate Calibration; John Wiley & Sons: New York, 1996. factors (latent variables) that relate X and y are obtained by maximizing the covariance between the X scores (t) and y, such that Xw = t and w = 
For quantification, the NIR spectra were pretreated by a Savitzky-Golay second derivative2323 Savitzky, A.; Golay, M. J. E.; Anal. Chem. 1964, 36, 1627. computed using a window of 31 points and a second order polynomial.
The original data set was randomly split into a calibration set (75% of the samples) and a prediction set (25% of samples). The number of LV in the calibration model was determined based on the occurrence of the minimal residual variance,2424 Wold, S.; Esbensen, K.; Geladi, P.; Chemom. Intell. Lab. Syst. 1987, 2, 37. or visually when the minimum did not exist, to avoid overfitting by cross validation.2525 Esbensen, K. H.; Geladi, P.; J. Chemom. 2010, 24, 168. An automatic uncertainty test (the Martens' uncertainty test) was applied to select the significant variables in the multi-component model.2626 Westad, F.; Martens, F.; J. Near Infrared Spectrosc. 2000, 8, 117.
Prediction evaluations were carried out employing certain parameters, such as the coefficient of determination in calibration (R2cal), in cross validation (R2cv) and external validation (R2pred); root mean square error of calibration (RMSEC); root mean square error of cross validation (RMSECV); root mean square error of prediction (RMSEP), range error ratio (RER),2727 Williams, P. C. In Near-Infrared Technology in the Agricultural and Food Industries, Williams, P. C.; Norris, K., eds.; American Association of Cereal Chemists: Minnesota, 1990, ch. 7.RSD,1414 Rambo, M. K. D.; Amorim, E. P.; Ferreira, M. M. C.; Anal. Chim. Acta 2013, 775, 41. number of LV and of outliers excluded.
The modeling is incomplete without interpretation of the regression coefficients. From the chemical point of view, a suitable interpretation of the regression coefficients in terms of a cause-effect relationship is highly desirable.2828 Kjeldahl, K.; Bro, R.; J. Chemom. 2010, 24, 558. Additionally, to ensure the performance of the models, figures of merit were evaluated.1414 Rambo, M. K. D.; Amorim, E. P.; Ferreira, M. M. C.; Anal. Chim. Acta 2013, 775, 41.
Multivariate data analyses (PCA and PLS) were performed using the Unscrambler 10.2 (Camo Software, Oslo, Norway), and the calculation of the figures of merit was conducted using the PLS-toolbox 6.7 (Eigenvector Research, Wenatchee, WA, USA) for Matlab 7.2 software (Math Works, South Natick, MA, USA).
Results and Discussion
NIR spectra from the banana residues are shown in Figure 2a, with the greatest variation occurring in the regions of 1400-1600 and 1900-2400 nm. The main bands are located at 1428-1430, 1920, 2100, 2270 and 2329 nm. The band at 1428-1430 nm is assigned to amorphous regions in cellulose (first overtone of O-H stretching), while the band at 1920 nm is attributed to the O-H stretch/O-H bend of polysaccharides, which overlaps with the water band.2929 Shenk, J. S.; Workman, J. J.; Westerhaus, M. O. In Handbook of Near-Infrared Analysis, 3rd ed.; Burns, D. A.; Ciurczak, E. W., eds.; CRC Press: London, 2007, ch. 17. The broad band at 2100 nm can be assigned to OH stretching + CH deformation in cellulose. Both bands at 2270 and 2329 nm are from polysaccharides.1818 Zidan, A. S.; Rahman, Z.; Sayeed, V.; Raw, A.; Yu, L.; Khan, M. A.; Int. J. Pharm. 2012, 423, 341.,2929 Shenk, J. S.; Workman, J. J.; Westerhaus, M. O. In Handbook of Near-Infrared Analysis, 3rd ed.; Burns, D. A.; Ciurczak, E. W., eds.; CRC Press: London, 2007, ch. 17.,3030 Tsuchikawa, S.; Yonenobu, H.; Siesler, H. W.; Analyst 2005, 130, 379. The first one is related to CH2 stretching + CH2 deformation from crystalline fractions of cellulose, and the second is related to the CH stretching + CH deformation combination from semi/crystalline regions.
NIR spectra for all banana samples. (a) Raw spectra and (b) second derivative spectra by Savitz-Golay (31 points, second order polynomial).
Figure 2b shows the NIR spectra after being pretreated with the second derivative (window size of 31 points and second degree polynomial) to remove the baseline offset and to elucidate the peaks corresponding to the crystalline and amorphous structures.
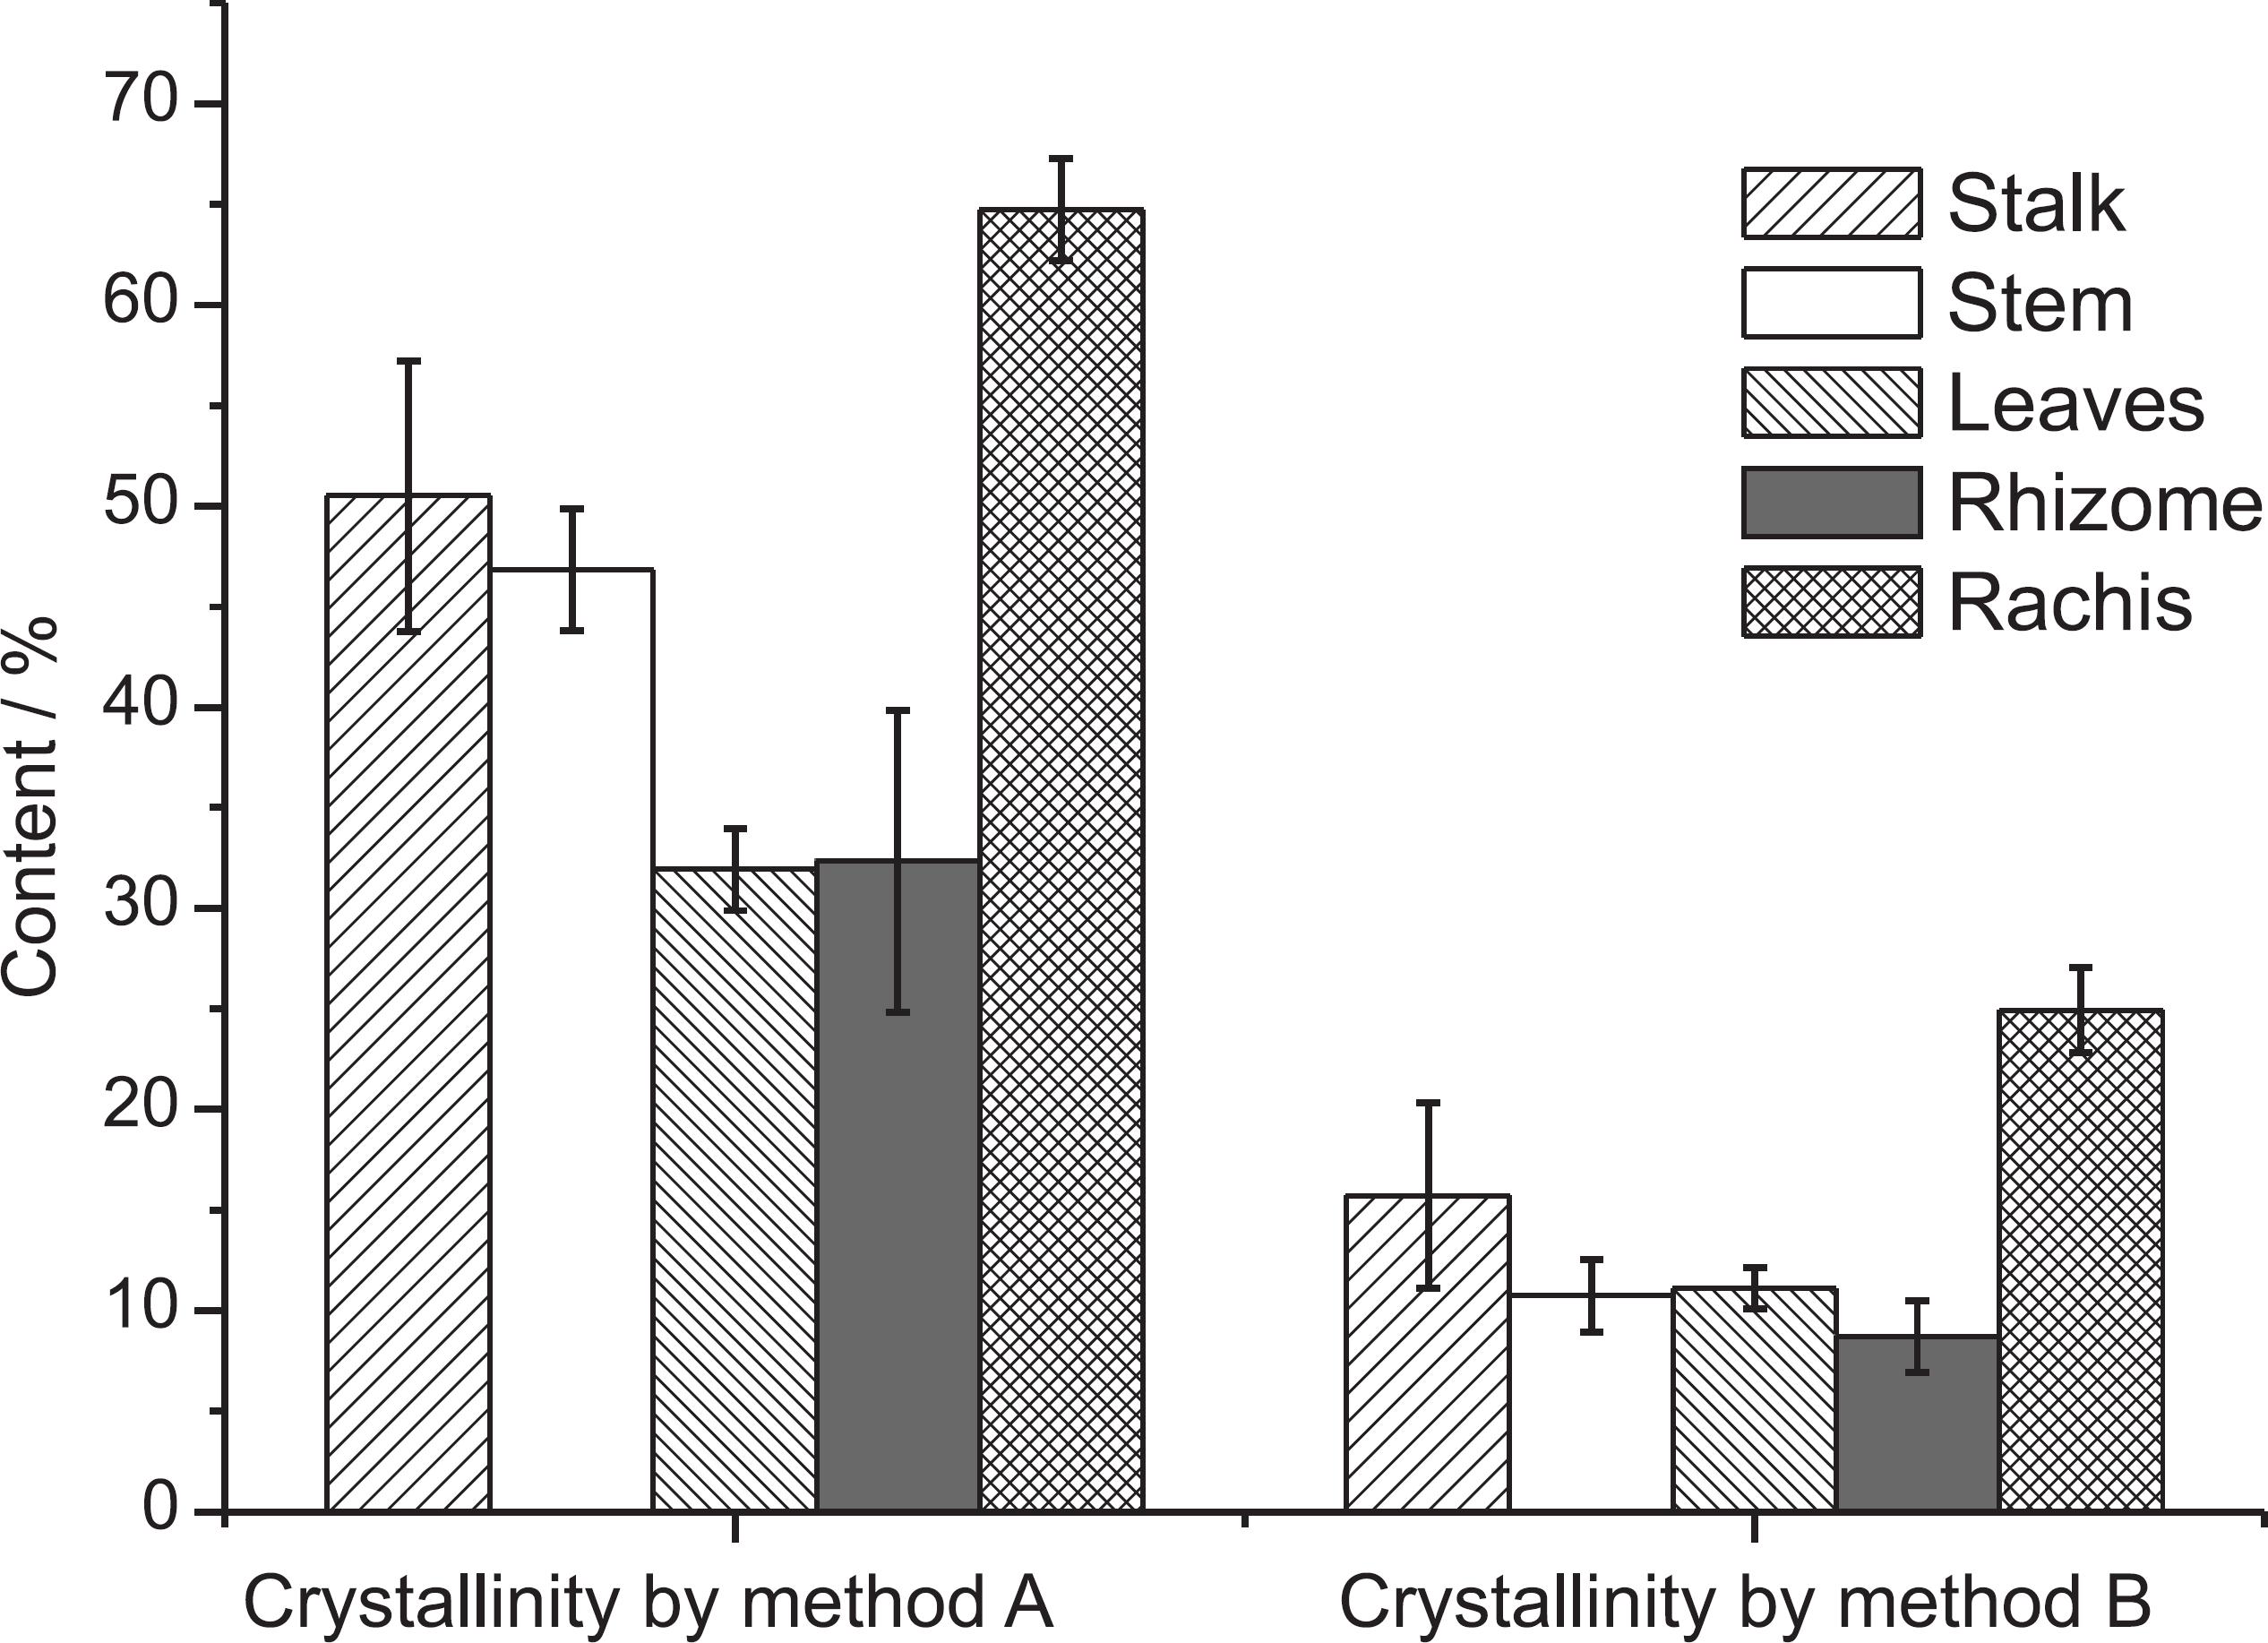
The mean and standard deviation plots of the CI obtained by the two methods discussed in the previous section for each fraction in the 69 banana samples are shown in Figure 3.
Mean and standard deviation of crystallinity content determined for all botanical fractions by two different methods: (a) intensity and (b) peak deconvolution.
The highest ranges in CI were observed for banana stem, calculated by both method A (37.81-56.60) and method B (6.65-23.56), followed by rhizome calculated by method A (27.40-40.99). The lowest ranges were observed for leaves (10.09-12.42) and rhizome, both obtained by method B (6.68-10.10). The stalk ranged from 41.14 to 52.70 and from 7.61 to 14.27 for methods A and B, respectively, while the rachis presented a range of 61.88-66.74 and 22.62-26.79 for methods A and B, respectively. Finally, the CI values for leaves calculated by method A varied from 29.39 to 34.16.
Crystallinity in banana residues was reported for the first time by Guimarães et al.,3131 Guimarães, J. L.; Frollini, E.; Silva, C. G.; Wypychc, F.; Satyanarayanac, K. G.; Ind. Crop Prod. 2009, 30, 407. but only for the pseudostem fraction. The values of CI in this work obtained by method A (intensity of peaks) are higher (ca. 10%) than the values reported.3131 Guimarães, J. L.; Frollini, E.; Silva, C. G.; Wypychc, F.; Satyanarayanac, K. G.; Ind. Crop Prod. 2009, 30, 407. This small difference could be due to distinct species, cultivars, soils and years of sampling.
The values of CI calculated by method A are always higher than the values obtained using method B (Figure 3), most likely due the underestimation of the amorphous peak intensity because the valley is used to estimate the amorphous contribution (see Figure 1a) in the method that uses the intensities.1313 Park, S.; Baker, J. O.; Himmel, M. E.; Parilla, P. A.; Johnson, D. K.; Biotechnol. Biofuels 2010, 3, 1.,3232 Thygesen, A.; Oddershede, J.; Lilholt, H.; Thomsen, A.; Stahl, K.; Cellulose 2005, 12, 563.
Principal component analysis
The analysis of the PCA scores based on the mean-centered diffractograms (Figure 4a) shows one significant overlap with some tendency towards separation between banana fractions. The 3 rachis samples are clearly separated from the other fractions in PC1.
(a) PC1 vs. PC2 scores plot of mean-centered banana diffractograms. (b) Loadings plot from PCA analysis based on meancentered diffractograms.
The first two PC explained 82% and 6% of the total variance, respectively. Some trend or discrimination could be elucidated between the groups leaves/rhizome from stalk/stem due their similarity in the CI content. Three samples from rachis showed greater dissimilarity, most likely due to the high crystallinity content, providing a different spectral profile. The PC1 and PC2 are characterized, respectively, by positive and negative loadings (Figure 4b) at 22º < 2θ < 23º and 15º < 2θ < 17º, which are typical of crystalline structures.1818 Zidan, A. S.; Rahman, Z.; Sayeed, V.; Raw, A.; Yu, L.; Khan, M. A.; Int. J. Pharm. 2012, 423, 341.
PC1 differentiates the banana fractions (stem and rachis) with positive scores associated with crystalline parts. Based on the PC2 loadings, the negative bands attributed to crystalline parts differentiate the banana fractions (stem, stalk and rachis) with crystalline characteristics from the leaves and rhizome, which have more amorphous characteristics.
Parameters for model evaluation and validation of PLS models
PLS regression models were performed on the meancentered NIR spectra after 2D (31 points and 2nd degree polynomial) pretreatment and feature selection using Martens'uncertainty test. Table 2 summarizes the results from the regression models to predict the crystallinity percentage by the two different methods (A and B).
Six LV were employed in both models. This high number of LV could be explained by the fact that different crystalline forms55 O'Sullivan, A. C.; Cellulose 1997, 4, 173. absorb in different regions of the spectrum (as seen in the regression coefficients), so that a single factor is not capable of explaining all the variability, which justifies using more factors to model this physical property.
A linear fit was obtained between the reference and predicted crystallinity with R2cal,val of 0.89 and 0.82, respectively, for method A, and R2cal,val of 0.86 and 0.85 for method B (see Figure 5).
(a) Plot of reference vs. predicted values from calibration and external validation sets for cellulose crystallinity determined by method A. (b) Plot of reference vs. predicted values from calibration and external validation sets for cellulose crystallinity determined by method B.
The values of RMSE for calibration, cross-validation and prediction were larger for method A because the crystallinity reference values were much higher for this method, and so the relative error is a better parameter to compare the results from the two methods. The relative errors were significantly different, being 6.5% for method A and twice as high (13.9%) for the crystallinity determined by area (method B). Both RER values were above 4, indicating that, according to the American Association of Cereal Chemists (AACC),3333 American Association of Cereal Chemists (AACC); Approved Methods of the American Association of Cereal Chemists, Near-Infrared Methods-Guidelines for Model Development and Maintenance, Method 39-00, AACC Press: St. Paul, 1999. both models are qualified for screening calibration, and method A is appropriate for quality control, with an RER value equal to 11.
The results found for method A are in accordance with results from the literature1717 Qu, Z.; Wang, L.; Adv. Mat. Res. 2011, 183, 1215. for a model with approximately the same number of LV (7) and similar R2cal (0.87) and R2val(0.83). Kelley, Elder, and Groom,1919 Kelley, S. S.; Elder, T.; Groom, L. H.; Wood Fiber Sci. 2005, 37, 14. when evaluating the crystallinity of wood, obtained poor correlation between crystallinity and NIR spectra (R2cal,val < 0.50). Jiang et al.1616 Jiang, Z. H.; Zhong, Y.; Chi, L. S.; Chung, Y. H.; J. Wood Sci. 2007, 53, 449. also evaluated the crystallinity of wood samples and obtained excellent results using the full spectrum (VisNIR) with R2cal,val of 0.95 and 0.86 for a 5 LV model. Their percentage error (6%) was the same reported in Table 2, but better RER values were obtained in this work (11 versus 6). It should be noted that including the visible spectral region did not improve our crystallinity model.
Regarding method B, the literature also reports satisfactory results. The crystallinity of tacrolimus solid dispersions evaluated by NIR,1818 Zidan, A. S.; Rahman, Z.; Sayeed, V.; Raw, A.; Yu, L.; Khan, M. A.; Int. J. Pharm. 2012, 423, 341. when the area contributions from the crystalline and amorphous phases of the diffractograms were considered, produced good results (R2cal,val of 0.99 and 0.93, respectively).
The intensity method (method A) gives an empirical measurement that allows rapid comparison of crystallinity samples. This method is useful for comparing the relative differences among samples and should not be used as a method for estimating the real crystallinity. The major problem with this method is that usually the minimum position between the 002 and the 101 peaks (Figure 1a) is not aligned with the maximum of the broad amorphous cellulose band which is likely higher, and so the Iam value for the intensity method could be significantly underestimated, resulting in an overestimation of the CI,1313 Park, S.; Baker, J. O.; Himmel, M. E.; Parilla, P. A.; Johnson, D. K.; Biotechnol. Biofuels 2010, 3, 1. which justifies the higher crystallinity values calculated by method A when compared to method B.
Although the intensity method (method A) does not provide the best estimate of cellulose crystallinity, this method presented the best regression model and is also the reference method most commonly used in the literature for crystallinity determination in biomass by NIR spectroscopy.1616 Jiang, Z. H.; Zhong, Y.; Chi, L. S.; Chung, Y. H.; J. Wood Sci. 2007, 53, 449.,3434 Zhang, J.; Wang, Y.; Zhang, L.; Zhang, R.; Liu, G.; Cheng, G.; Bioresour. Technol. 2014, 151, 402.
The main source of error in method B is most likely the super-estimation of the amorphous contribution given by the broad band in Figure 1b. A quick way to solve the problem would be to subtract the amorphous contribution from the diffractogram using an amorphous pattern.1313 Park, S.; Baker, J. O.; Himmel, M. E.; Parilla, P. A.; Johnson, D. K.; Biotechnol. Biofuels 2010, 3, 1.,1818 Zidan, A. S.; Rahman, Z.; Sayeed, V.; Raw, A.; Yu, L.; Khan, M. A.; Int. J. Pharm. 2012, 423, 341.,3535 Howard, S. A.; Preston, K. D.; Profile Fitting of Powder Diffraction patterns. In: Bish, D. L., Post J. E., editors. Reviews in mineralogy 20: Modern powder diffraction. Washington, DC: Miner Soc Am. 1989, p 217. Besides, none of these Gaussian functions could model the scattering pattern perfectly throughout the entire angle range.3636 Rietveld, H.; Acta Crystallogr. 1967, 22, 151. So this method tends to give higher amorphous values and lower CI.
Xu et al.1919 Kelley, S. S.; Elder, T.; Groom, L. H.; Wood Fiber Sci. 2005, 37, 14. suggested that, when studying crystallinity in biomasses, attention should be paid to cellulose rather than whole biomass, and the Rietveld's method3636 Rietveld, H.; Acta Crystallogr. 1967, 22, 151.,3737 Rietveld, H.; J. Appl. Crystallogr. 1969, 2, 65. for CI calculation should be preferred over the intensity methods.
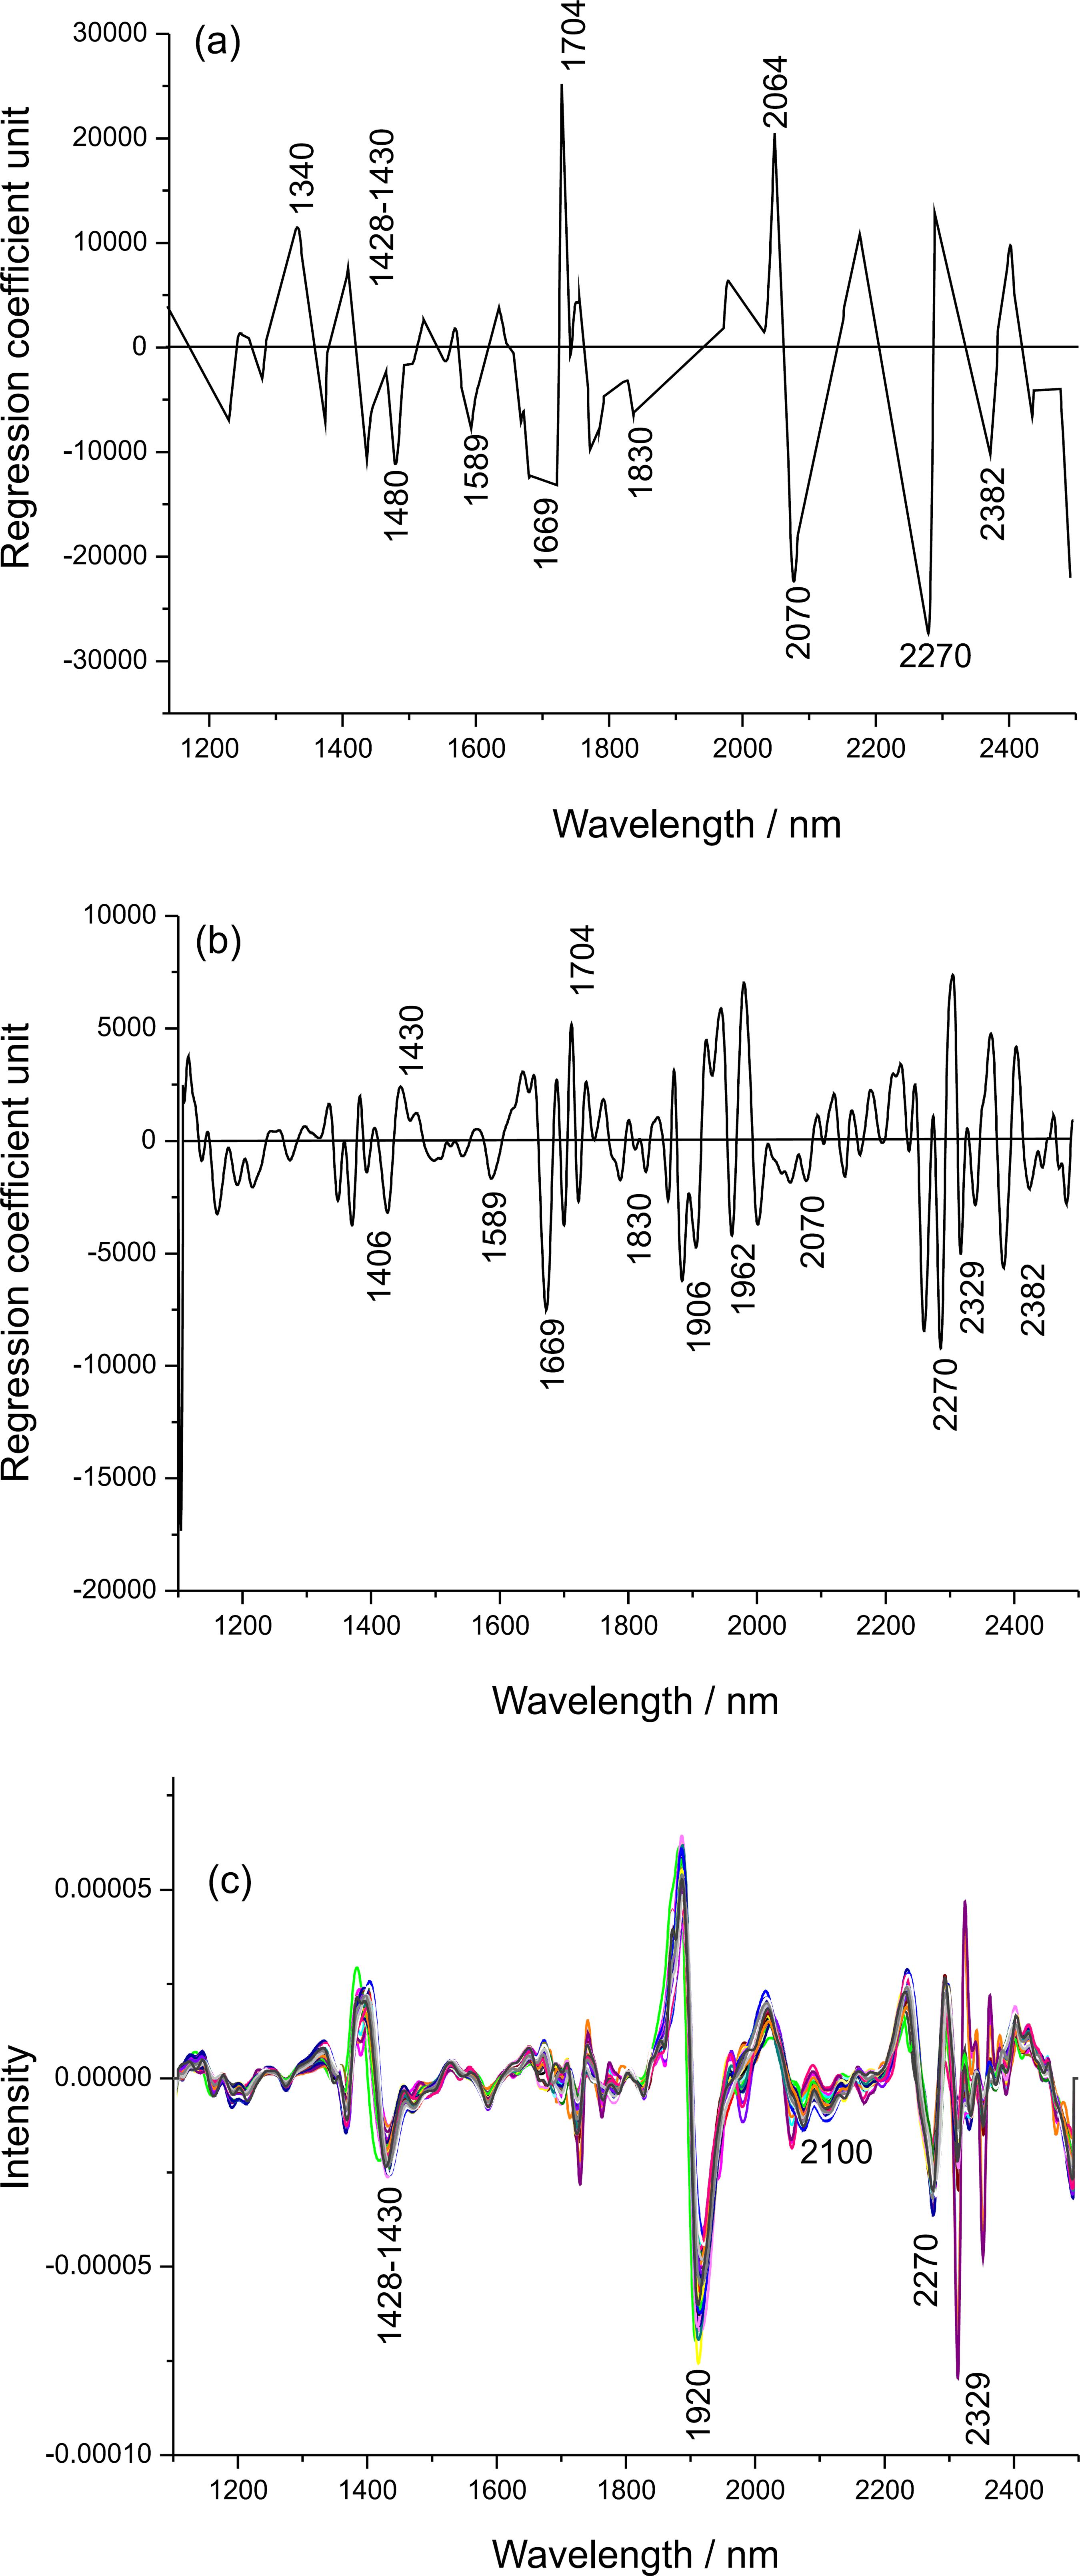
To complete the modeling, regression coefficients from PLS models on pretreated data for method A (Figure 6a) and method B (Figure 6b) were interpreted together with the derivative spectra (Figure 6c).
Regression coefficients from PLS models for the cellulose crystallinity (a) determined by method A; (b) determined by method B and (c) spectra pretreated by the second derivative.
They exhibit typical bands of crystalline cellulose at 1480, 1589, 1830, 1906, 1962 and 2070 nm (all associated with the O-H stretch, 1st overtone). A negative relationship was found in the regions of 1340, 1428/1430, and 1704 and at 2064 nm (O-H combination), with bands typical of amorphous cellulose.1818 Zidan, A. S.; Rahman, Z.; Sayeed, V.; Raw, A.; Yu, L.; Khan, M. A.; Int. J. Pharm. 2012, 423, 341.,3030 Tsuchikawa, S.; Yonenobu, H.; Siesler, H. W.; Analyst 2005, 130, 379.,3838 Tsuchikawa, S.; Siesler, H. W.; Appl. Spectrosc. 2003a, 57, 667. Typical polysaccharide bands (1669 and 2270 nm) were also found for the two regression coefficients. For both models, negative coefficients correspond to a direct relationship because these regression coefficients were obtained from the second derivative spectra. The main prominent bands of crystalline cellulose reported in the literature are at 1480, 1589 and 2070 nm.3030 Tsuchikawa, S.; Yonenobu, H.; Siesler, H. W.; Analyst 2005, 130, 379.,3838 Tsuchikawa, S.; Siesler, H. W.; Appl. Spectrosc. 2003a, 57, 667.,3939 Tsuchikawa, S.; Siesler, H. W.; Appl. Spectrosc. 2003b, 57, 675. All of them presented higher regression coefficients in the PLS model, which indicates that method A is better able to capture the relevant information for determining the crystallinity than method B. The same is observed for the amorphous bands, with larger regression coefficients for model A than model B (1340, 1428/1430, 1704 and at 2064 nm).
All the figures of merit for multivariate calibration, such as sensitivity (SEN), analytical sensitivity (γ), selectivity (SEL), signal-to-noise ratio, limit of detection (LOD) and limit of quantification (LOQ) were calculated,1414 Rambo, M. K. D.; Amorim, E. P.; Ferreira, M. M. C.; Anal. Chim. Acta 2013, 775, 41. and the results obtained are acceptable (Table 3).
Results from figures of merit for the PLS models. (%–1) for SEN and γ; (%) for γ–1, LOD and LOQ
The RMSEP and RMSEC values were less than 4%, and the deviation values between the reference and predicted values were less than 10%. A low quantity of outliers were removed (< 3%). The SEL of these methods indicates that 4% and 7% of the information modeled in methods A and B, respectively, is due to the analyte.
The SEN values are directly affected by the pretreatment used. The derivative spectrum has small intensities requiring large regression coefficients for the conversion to analyte concentration, leading to small sensitivity values.4040 Faber, N. K. M.; Anal. Chem. 1999, 71, 557. Therefore, the low sensitivity values (10–5 and 10–4) obtained in this work are not surprising, due to the derivative pretreatment.
The γ or the inverse of the analytical sensitivity (γ-1) expresses the minimum concentration difference, which is discernible by a method considering the random experimental noise,1414 Rambo, M. K. D.; Amorim, E. P.; Ferreira, M. M. C.; Anal. Chim. Acta 2013, 775, 41. and presented values smaller than 0.0011%.
The LODs obtained (0.0034 and 0.0012% of crystallinity) are very low compared to the minimum experimental value (20%). The LOQs of 0.0113 and 0.0039% were also lower than the minimum value observed (20%), thus confirming the applicability of both models.
The linearity can be confirmed by the plots in Figure 5, which show that the points are reasonably well distributed around the diagonal line, ensuring that both methods A and B follow linear trends.
Conclusions
The results demonstrated that NIR spectra together with multivariate analysis can be used to determine the crystallinity content in banana residues, independent of the method used to measure the crystallinity. For both models, satisfactory results were obtained, providing R2cal,pred ≥ 0.82 and reasonable results for RMSEC, RMSEP, RER, RSD and multivariate figures of merit. Additionally, the regression coefficients were interpretable from the chemical perspective.
Method B, as presented here, could provide a more accurate measure of the crystallinity of lignocellulosic biomass and thus better predictions if the contributions from the amorphous pattern are considered. The most popular method for estimating CI, method A, produces significantly higher values than the other method. However, it is simple to use and is thus recommended as a time-saving empirical measure of relative crystallinity.1212 Segal, L.; Creely, J. J.; Martin, A. E.; Conrad, C. M.; Text. Res. J. 1959, 29, 786.
It was proved that NIR associated to multivariate analysis can be used for screening calibration and quality control to estimate crystallinity content in biomass. Thus, the key conclusion of this study is that NIR is an nondestructive, rapidly and very important method to reduce time and costs of crystallinity content prediction.
-
FAPESP has sponsored the publication of this article.
-
‡
ois the experimental value, and ve is the expected value.
 where v
Acknowledgments
The authors thank the Sugarcane Research Center (CTC) and the Brazilian Agricultural Research Corporation (EMBRAPA) for kindly providing the samples and facilities to carry out this study. The DIBANET research leading to these results has received funding from the European Union Seventh Framework Programme [FP7/2007-2013] under grant agreement No. [227248].
References
-
1Klemm, D.; Heublein, B.; Fink, H-P.; Bohn, A.; Angew. Chem. Int. 2005, 22, 3358.
-
2Moon, R. J.; Martini, A.; Nairn, J.; Simonsen, J.; Youngblood, J.; Chem. Soc. Rev. 2011, 40, 3941.
-
3John, M. J.; Thomas, S.; Carbohydr. Polym. 2008, 71, 343.
-
4Chum, H. L.; Douglas, L. J.; Feinberg, D. A.; Schroeder, H. A.; Solar Energy Research Institute; Evaluation of Pretreatments of Biomass for Enzymatic Hydrolysis of Cellulose; NREL Publications: Golden, Colorado, 1985, pp. 77.
-
5O'Sullivan, A. C.; Cellulose 1997, 4, 173.
-
6Bungay, H. R.; Energy, the Biomass Options; John Wiley and Sons: New York, 1981.
-
7Fan, L. T.; Lee, Y.; Beardmore, D. H.; Biotechnol. Bioenerg. 1980, 22, 177.
-
8Yu, Y.; Lou, X.; Wu, H.; Energy Fuels 2008, 22, 46.
-
9Philipp, B.; Jacopian, V.; Loth, F.; Hirte, W.; Schulz, G.; Hydrolysis of Cellulose: Mechanisms of Enzymatic and Acid Catalysis, Advances in Chemistry Series, Brown Jr., R. D.; Jurasek, L., eds.; American Chemical Society: Washington, 1979, pp. 127.
-
10Laureano-Perez, L.; Teymouri, F.; Alizadeh, H.; Dale, B. E.; Appl. Biochem. Biotechnol. 2005, 121, 1081.
-
11Yoshida, M.; Liu, Y.; Uchida, S.; Kawarada, K.; Ukagami, Y.; Ichinose, H.; Kaneko, S.; Fukuda, K.; Biosci. Biotechnol. Biochem 2008, 2, 805.
-
12Segal, L.; Creely, J. J.; Martin, A. E.; Conrad, C. M.; Text. Res. J. 1959, 29, 786.
-
13Park, S.; Baker, J. O.; Himmel, M. E.; Parilla, P. A.; Johnson, D. K.; Biotechnol. Biofuels 2010, 3, 1.
-
14Rambo, M. K. D.; Amorim, E. P.; Ferreira, M. M. C.; Anal. Chim. Acta 2013, 775, 41.
-
15Basch, A.; Wasserman, T.; Lewin, M.; J. Polym. Sci. 1974, 12, 1143.
-
16Jiang, Z. H.; Zhong, Y.; Chi, L. S.; Chung, Y. H.; J. Wood Sci 2007, 53, 449.
-
17Qu, Z.; Wang, L.; Adv. Mat. Res. 2011, 183, 1215.
-
18Zidan, A. S.; Rahman, Z.; Sayeed, V.; Raw, A.; Yu, L.; Khan, M. A.; Int. J. Pharm. 2012, 423, 341.
-
19Kelley, S. S.; Elder, T.; Groom, L. H.; Wood Fiber Sci. 2005, 37, 14.
-
20Xu, F.; Shib, Y. C.; Wang, D.; Carbohydr. Polym. 2013, 94, 904.
-
21Sottys, J.; Lisowski, Z.; Knapczyky, J.; Acta Pharm. Technol. 1984, 30, 174.
-
22Martens, H.; Naes, T.; Multivariate Calibration; John Wiley & Sons: New York, 1996.
-
23Savitzky, A.; Golay, M. J. E.; Anal. Chem. 1964, 36, 1627.
-
24Wold, S.; Esbensen, K.; Geladi, P.; Chemom. Intell. Lab. Syst. 1987, 2, 37.
-
25Esbensen, K. H.; Geladi, P.; J. Chemom. 2010, 24, 168.
-
26Westad, F.; Martens, F.; J. Near Infrared Spectrosc. 2000, 8, 117.
-
27Williams, P. C. In Near-Infrared Technology in the Agricultural and Food Industries, Williams, P. C.; Norris, K., eds.; American Association of Cereal Chemists: Minnesota, 1990, ch. 7.
-
28Kjeldahl, K.; Bro, R.; J. Chemom. 2010, 24, 558.
-
29Shenk, J. S.; Workman, J. J.; Westerhaus, M. O. In Handbook of Near-Infrared Analysis, 3rd ed.; Burns, D. A.; Ciurczak, E. W., eds.; CRC Press: London, 2007, ch. 17.
-
30Tsuchikawa, S.; Yonenobu, H.; Siesler, H. W.; Analyst 2005, 130, 379.
-
31Guimarães, J. L.; Frollini, E.; Silva, C. G.; Wypychc, F.; Satyanarayanac, K. G.; Ind. Crop Prod. 2009, 30, 407.
-
32Thygesen, A.; Oddershede, J.; Lilholt, H.; Thomsen, A.; Stahl, K.; Cellulose 2005, 12, 563.
-
33American Association of Cereal Chemists (AACC); Approved Methods of the American Association of Cereal Chemists, Near-Infrared Methods-Guidelines for Model Development and Maintenance, Method 39-00, AACC Press: St. Paul, 1999.
-
34Zhang, J.; Wang, Y.; Zhang, L.; Zhang, R.; Liu, G.; Cheng, G.; Bioresour. Technol. 2014, 151, 402.
-
35Howard, S. A.; Preston, K. D.; Profile Fitting of Powder Diffraction patterns In: Bish, D. L., Post J. E., editors. Reviews in mineralogy 20: Modern powder diffraction. Washington, DC: Miner Soc Am. 1989, p 217.
-
36Rietveld, H.; Acta Crystallogr. 1967, 22, 151.
-
37Rietveld, H.; J. Appl. Crystallogr. 1969, 2, 65.
-
38Tsuchikawa, S.; Siesler, H. W.; Appl. Spectrosc. 2003a, 57, 667.
-
39Tsuchikawa, S.; Siesler, H. W.; Appl. Spectrosc. 2003b, 57, 675.
-
40Faber, N. K. M.; Anal. Chem. 1999, 71, 557.
Publication Dates
-
Publication in this collection
July 2015
History
-
Received
05 Jan 2015 -
Accepted
12 May 2015