
Abstract
This paper proposes an active search method aimed at finding objects with optimal or near-optimal y-property values, on the basis of x-variables obtained by indirect, less costly methods. The proposed method progresses in a sequential manner, starting from a small subset of objects with known y-values. At each iteration, the K-nearest neighbour regression technique is employed to obtain estimates ŷ for the objects with unknown y-values. The object with best ŷ value is then subjected to a direct analysis procedure for evaluation of the y-property. Examples are presented with simulated data, as well as actual quantitative structure-activity relationship (QSAR) and near-infrared (NIR) spectrometry datasets. The QSAR and NIR case studies involve the search for maximal antidepressant activity in a set of arylpiperazine compounds and maximal pulp yield in a set of eucalyptus wood samples, respectively. In all these cases, the active search yielded results closer to the maximal y-value compared to the classical Kennard-Stone algorithm for object selection.
Keywords:
optimization; quantitative structure-activity relationship; antidepressant compounds; near-infrared spectrometry; eucalyptus pulp yield
Introduction
In many analytical applications, the problem consists of finding an object with optimal or near-optimal value for a y-property of interest, within a given pool of objects. For instance, one may be interested in choosing the most appropriate drug from a certain family of compounds to obtain a desired therapeutic effect. Another example may involve the selection of plant specimens with suitable phenotypical features for breeding programs. However, the direct determination of y in all the available objects may not be a viable option, in view of the required resources, workload and/or time. As an alternative, estimates of y may be obtained in an indirect manner by using x-variables resulting from theoretical calculations or instrumental measurements. For this purpose, chemometric models need to be constructed on the basis of a subset of calibration objects with known y-values. The accuracy of the model predictions tends to be improved as more calibration objects are employed. However, the use of too many calibration objects escapes the purpose of using indirect methods, which consists of reducing the experimental workload associated to the direct determination of y. Ideally, the search for the optimal or near-optimal objects should be carried out with as few determinations of the property of interest as possible, in order to keep the workload to a minimum.
The present paper proposes an active search method to find objects with optimal or near-optimal y-values on the basis of x-variables obtained by indirect, less costly methods. The search algorithm progresses in a sequential manner, starting from a small subset of objects with known y-values. At each iteration, a multivariate weighted-averaging technique (K-nearest neighbour regression or KNNR)11 Guvenir, H. A.; Uysal, I.; Knowl.-Based Syst. 2000, 13, 207.,22 Pirogov, A. V.; Platonov, M. M.; Pletnev, I. V.; Obrezkov, O. N.; Shpigun, O. A.; Anal. Chim. Acta 1998, 369, 47. is employed to obtain estimated ŷ values for the objects with unknown y-values. The object with best ŷ value (smallest in minimization problems or largest in maximization problems) is then selected as a likely candidate for optimality. This candidate object is then subjected to the direct analysis procedure for evaluation of the y-property.
The term active is used herein because the search method interacts with the analyst by indicating the objects that should be subjected to the direct analysis procedure. This concept bears similarity with active learning techniques, which have been studied within the scope of classification33 Zomer, S.; Sánchez, M. N.; Brereton, R. G.; Pavón, J. L. P.; J. Chemom. 2004, 18, 294. and multivariate calibration tasks.44 Ukil, A.; Bernasconi, J.; IEEE Trans. Syst., Man, Cybern. C, Appl. Rev. 2012, 42, 1763.,55 Douak, F.; Melgani, F.; Alajlan, N.; Pasolli, E.; Bazi, Y.; Benoudjit, N.; J. Chemom. 2012, 26, 374. However, such active learning techniques are aimed at the construction of classification or regression models, whereas the present work is concerned with an optimization problem, which does not necessarily involves the construction of an explicit model.
The problem of finding the optimal or near-optimal argument x for a function y = f(x) by using a small number of function evaluations has drawn much interest in the optimization literature.66 Jones, D. R.; Schonlau, M.; Welch, W. J.; J. Global Optim.
1998, 13, 455.
7 Liu, B.; Zhang, Q.; Gielen, G. G. E.; IEEE Trans. Evol. Comput.
2012, 18, 180.
8 Zhou, Z.; Ong, Y. S.; Lim, M. H.; Lee, B. S.; Soft Comput.
2007, 11, 957.-99 Eskandari, H.; Geiger, C. D.; J. Heuristics
2008, 14, 203. However, these works typically assume that the function f(x) can be evaluated for any vector x with admissible component values. In contrast, the present work concerns problems of chemometrics interest in which the possible choices for x are restricted to a finite pool of objects available for selection.
The proposed active search method is illustrated in a simulated example and two case studies with real data. The first case study concerns a quantitative structure-activity relationships (QSAR) investigation involving a set of antidepressant compounds (arylpiperazine) with inhibition constants (Ki) measured elsewhere.1010 Martínez-Esparza, J.; Oficialdegui, A. M.; Pérez-Silanes, S.; Heras, B.; Orús, L.; Palop, J. A.; Lasheras, B.; Roca, J.; Mourelle, M.; Bosch, A.; Castillo, J. C.; Tordera, R.; Rio, J.; Monge, A.; J. Med. Chem. 2001, 44, 418. In this type of problem, the x-values correspond to molecular descriptors of the compounds under consideration, which are derived through theoretical calculations by using a suitable software. In contrast, the y-property is obtained by experimental procedures such as in vitro or in vivo studies.1111 Tropsha, A.; Mol. Inform. 2010, 29, 476.
The second case study involves a set of eucalyptus wood samples, with reflectance spectra acquired in the near-infrared (NIR) range.1212 Pasquini, C.; Carneiro, C. J. G.; Bomfim, P. M.; Papel 2007, 68, 71. In this case, the property of interest is the pulp yield, which should be maximized for use in the pulp and paper industry. It is worth noting that the NIR spectra (x-variables) are acquired by using wood chips that can be easily extracted from the eucalyptus tree. On the other hand, the determination of the pulp yield (y-property) requires the use of a much larger wood sample.
Experimental
Preliminaries and notation
Vectors are denoted by lowercase boldface letters and scalars by italic characters. The Euclidean norm of a vector x is denoted by ||x||. An empty set is represented by the symbol ∅. The union of two sets A and B is denoted by A ∪ B. The difference between two sets A and B is denoted by A \ B, i.e., the elements of A \ B are those that belong to A and do not belong to B. The notation is employed to indicate the argument i that maximizes g(i). A hat symbol (^) is used to indicate an estimated value. The x-vectors associated to the objects under consideration are denoted by x1, x2, ..., xN. It is assumed that different objects are associated to different x-vectors, i.e., xi ≠ xj for i ≠ j.
The proposed active search method is initialized by selecting n0 objects on the basis of the x-vectors alone, i.e., without using any information concerning the corresponding y-values. This initialization is carried out by using the Kennard-Stone (KS) algorithm, which is a classical method for selecting objects in a near-uniform manner on the basis of the Euclidean distances between each pair of x-vectors.1313 Kennard, R. W.; Stone, L. A.; Technometrics 1969, 11, 137. In the presentation given below, details of the KS algorithm are initially given, followed by a description of the proposed method.
Kennard-Stone algorithm
In the KS algorithm, the first two selected objects are those that are separated by the largest distance in the x-space. Each subsequent object is chosen according to a maximum-minimum procedure in order to avoid the selection of objects that are close together. A formal description of this algorithm is presented below, in the form of a sequence of steps. It is assumed that n0 > 2 objects are to be selected from a pool of N objects.
Step 1: initialization of the index sets
Let ISEL and ISEL denote the index sets of the selected objects and the objects still available for selection, respectively. Initially, no object has been selected and thus ISEL and ∅ ISEL {1, 2, ..., N}.
Step 2: distance calculations
Calculate the Euclidean distance d(i,j) = ||xi - xj|| between each pair of vectors xi, xj, for i, j = 1, 2, ..., N, with i ≠ j.
Step 3: selection of the two initial objects
Let k1, k2 be the indexes of the two objects that are separated by the largest distance, i.e.:
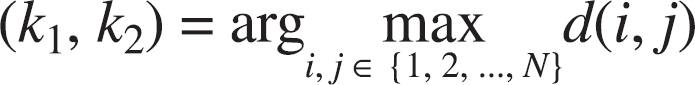
Update the index sets by moving k1, k2 from ISEL to ISEL, i.e.:
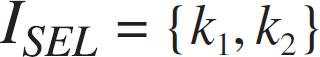
Let n = 2 (number of objects already selected).
Step 4: selection of the next object
Let kn+1 be the index of the object with the largest distance with respect to the nearest object already selected, i.e.:
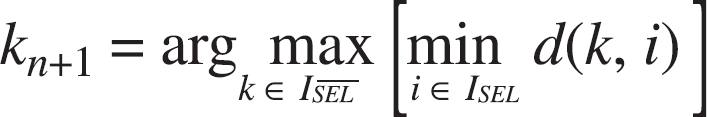
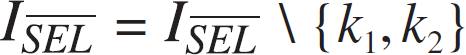
Update the index sets by moving kn+1 from ISEL to ISEL, i.e.:

Step 5
Let n = n + 1. If n < n0 return to Step 4.
Step 6: end
The index set of the n0 selected objects is ISEL.
Proposed active search method
In what follows, it is assumed that the problem involves the search for the maximal value of y. Minimization problems can be handled in a similar manner by changing the sign of the y-values, i.e., by replacing y for −y.
The proposed method involves a sequential algorithm, which selects a new object at each iteration. It is assumed that the y-values have been experimentally determined for the objects already selected. The KNNR technique11 Guvenir, H. A.; Uysal, I.; Knowl.-Based Syst. 2000, 13, 207.,22 Pirogov, A. V.; Platonov, M. M.; Pletnev, I. V.; Obrezkov, O. N.; Shpigun, O. A.; Anal. Chim. Acta 1998, 369, 47. is then employed to estimate y-values for the objects which have not been selected yet. The object with the largest estimated y-value is then selected. The algorithm can be described as follows, assuming that n0 initial objects were selected by using the KS algorithm and a total of nmax ≤ N objects are to be selected at the end of the active search.
Step 1: initialization
Let ISEL = {k1, k2, ..., kn0} and ISEL = {1, 2, ..., N} \ ISEL be the index sets resulting from the initial selection of n0 objects according to the KS algorithm. Moreover, let {yk, k ∈ ISEL} be the y-values corresponding to the initial set of selected objects. Choose the number K of nearest neighbours to be employed in the KNNR technique, with K ≤ n0. Let n = n0.
Step 2: KNNR calculations
Calculate an estimate of y for each object still available for selection, as follows:
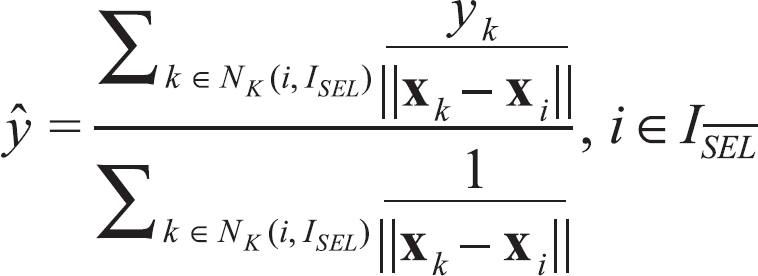
where NK (i, ISEL) is the index set of the K nearest neighbours of xi (in the sense of smallest Euclidean distance) among the objects already selected.
Step 3: selection of the next object
Let kn+1 be the index of the object with the largest estimated value of y, i.e.:
Update the index sets by moving kn+1 from ISEL to ISEL, i.e.:
Step 4
Obtain the actual y-property for the selected object and store the resulting value in ykn+1.
Step 5
Let n = n + 1. If n < nmax return to Step 3.
Step 6: end
The index set of the nmax selected objects is ISEL.
It is worth noting that the equation 7 for the estimation of y-values is solely based on Euclidean distances in the x-space, which can be calculated even if the number of variables is larger than the number of objects already analyzed. This is an advantage over multiple linear regression modelling, which typically requires the use of variable selection techniques when the number of calibration objects is small.1414 Galvão, R. K. H.; Araújo, M. C. U. In Comprehensive Chemometrics. Chemical and Biochemical Data Analysis; Brown, S. D.; Tauler, R.; Walczak, B., eds.; Elsevier: Oxford, 2009, ch. 3.05. Moreover, there is no need to choose a parameter related to model complexity, such as the number of factors in partial-least-squares modelling.1515 Haaland, D. M.; Thomas, E. V.; Anal. Chem. 1988, 60, 1193.
The only parameters that need to be chosen in the proposed algorithm are the number n0 of initial objects that will be selected by the KS procedure, the total number nmax of objects to be selected and the number K of nearest neighbours. In the tests carried out in the present work, with both simulated and actual data, a good compromise was obtained by setting n0 = 10. Using fewer initial objects was not appropriate, since there was not enough information for the active search procedure. On the other hand, using more initial objects escaped the purpose of the proposed method, which is aimed at using as few objects as possible. In practice, the choice of nmax will depend on the time and resources available for the analysis of the objects. In fact, by analyzing a larger number of objects, the chance of achieving the optimal value of the y-property increases.
Different values for K will be employed in the case studies, in order to investigate the effect of this parameter in the active search outcome. The results will be compared with a simpler version of the KNNR technique, in which all the objects already selected are employed in the estimation of y. In this case, equation 7 is employed with K = n at each iteration of the algorithm. Such an alternative has the advantage of dispensing with the need to choose a fixed number of nearest neighbours K.
Furthermore, a comparison will be carried out between the active search and the KS algorithm in order to show that better results tend to be obtained with the proposed method. It is worth noting that the KS algorithm is not specifically aimed at optimization, since it favours the exploration of the x-space in a global manner. However, the comparison presented herein is of value to illustrate and justify the search mechanism of the proposed method, which places emphasis on regions associated to larger y values.
Simulated example
The simulated example involved two variables x1, x2 related to a y-property according to the following expression:
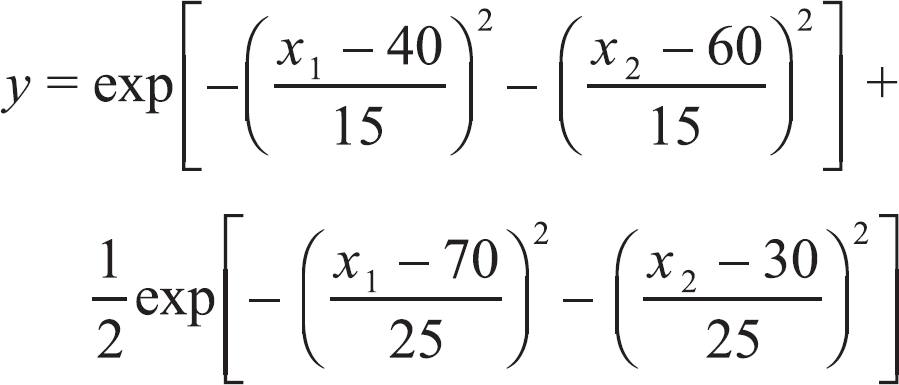
which has global and local maximum points, as can be seen in Figure 1. A total of 150 objects were generated by taking random pairs (x1, x2) with values in the range [0, 100]. The problem consists of finding the object that is closest to the global maximum of y.
QSAR data set
Table 1 presents the structure and biological property values of the 81 arylpiperazine compounds employed in this investigation. The biological property corresponds to experimental values of 5-HT1A receptor affinity stated in terms of the inhibition constant Ki, as reported in.1010 Martínez-Esparza, J.; Oficialdegui, A. M.; Pérez-Silanes, S.; Heras, B.; Orús, L.; Palop, J. A.; Lasheras, B.; Roca, J.; Mourelle, M.; Bosch, A.; Castillo, J. C.; Tordera, R.; Rio, J.; Monge, A.; J. Med. Chem. 2001, 44, 418. In the present study, this property is expressed as pKi = -log Ki, with values ranging from 5.3 to 8.3.
Molecular structures and pKi values of the 81 arylpiperazine compounds employed in this investigation
A geometry optimization of all compounds was, then, performed by using the semiempirical method AM1.1616 Dewar, M. J. S.; Zoebisch, E. G.; Healy, E. F.; Stewart, J. J. P.; J. Am. Chem. Soc. 1985, 107, 3902. From these structures, 14 electronic descriptors were calculated at the AM1 level, as shown in Table 2. All these descriptors were assumed to represent electronic properties of the compounds. The descriptor values were autoscaled for use in the present study. The descriptors HLGAP, η and χ not were used in the subsequent calculations, since they bear redundant information with respect to energy of the highest occupied molecular orbital (EHOMO) and energy of lowest unoccupied molecular orbital (ELUMO).
A principal component analysis (PCA) using the default settings of the Unscrambler software (Camo Software AS., Oslo, Norway) was employed in order to identify compounds outside the applicability domain. As can be seen in Figure 2a, the compounds 20 and 41 (see Table 1) present leverage and/or residual variance values greater than the corresponding thresholds and were thus removed from the dataset.
Leverage vs. residual variance plots for (a) quantitative structure-activity relationship (QSAR); and (b) eucalyptus wood data sets. The dashed lines correspond to thresholds obtained by using the default settings of the software package.
In order to evaluate the proposed active search method, the 79 remaining compounds were employed to generate 150 different subsets by using a subsampling procedure. Each subset was created by randomly selecting 54 compounds. The proposed active search method was then applied to each of these subsets in order to find the compound with the largest pKi value in each subset.
Eucalyptus wood data set
This data set comprised 100 samples of wood chips from small eucalyptus tree logs, collected in different plantations. The samples were initially ground in a knife chipper and finally in a UDY mill (UDY Corporation, Fort Collins, CO, USA) to a granulometry smaller than 0.50 mm. Prior to the spectral measurements, the samples remained for three hours in contact with the lab atmosphere with temperature and humidity controlled at 24 ± 1 ºC and 54 ± 2%, respectively.
NIR diffuse reflectance spectra were obtained in the range of 1100 to 2500 nm, by using a Foss NIRSystems 5000 spectrophotometer (Silver Spring, MD, USA) fitted with a standard circular cell. Each spectrum was obtained as an average of 50 scans. The resulting spectra for the 100 samples are presented in Figure 3a. To circumvent the problem of systematic baseline variations, first-derivative spectra were employed by using a Savitzky-Golay filter with a second order polynomial and an 11-point window.1717 Beebe, K. R.; Pell, R. J.; Seasholtz, B.; Chemometrics: a Practical Guide, Wiley: New York, 1998. Figure 3b presents the derivative spectra, which were used in the active search case study.
(a) Original; and (b) derivative near-infrared (NIR) diffuse reflectance spectra of the 100 eucalyptus wood samples employed in the study.
Pulp yield was determined by subjecting discs of wood from the eucalyptus trees (collected at a standard height) to kraft cooking. These samples were chopped and mixed with different alkali charges to achieve pulp kappa number 15. The results ranged from 48.7 to 55.8% (w/w).
As in the QSAR data set, the applicability domain was also evaluated by using PCA. As a result, the samples 10 and 51 were removed because their leverage values were found to be larger than the corresponding threshold (Figure 2b). A subsampling procedure was also employed to generate different subsets of objects from the remaining 98 wood samples. In this case, 150 subsets with 57 samples each were generated. The proposed active search method was then applied to each of these subsets in order to find the wood sample with the largest pulp yield in each subset.
Software
The electronic descriptors in the QSAR case study were calculated in the Gaussian 03 package software.1818 Frisch, M. J.; Trucks, G. W.; Schlegel, H. B.; Scuseria, G. E.; Robb, M. A.; Cheeseman, J. R.; Montgomery Jr., J. A.; Vreven, T.; Kudin, K. N.; Burant, J. C.; Millam, J. M.; Iyengar, S. S.; Tomasi, J.; Barone, V.; Mennucci, B.; Cossi, M.; Scalmani, G.; Rega, N.; Petersson, G. A.; Nakatsuji, H.; Hada, M.; Ehara, M.; Toyota, K.; Fukuda, R.; Hasegawa, J.; Ishida, M.; Nakajima, T.; Honda, Y.; Kitao, O.; Nakai, H.; Klene, M.; Li, X.; Knox, J. E.; Hratchian, H. P.; Cross, J. B.; Bakken, V.; Adamo, C.; Jaramillo, J.; Gomperts, R.; Stratmann, R. E.; Yazyev, O.; Austin, A. J.; Cammi, R.; Pomelli, C.; Ochterski, J. W.; Ayala, P. Y.; Morokuma, K.; Voth, G. A.; Salvador, P.; Dannenberg, J. J.; Zakrzewski, V. G.; Dapprich, S.; Daniels, A. D.; Strain, M. C.; Farkas, O.; Malick, D. K.; Rabuck, A. D.; Raghavachari, K.; Foresman, J. B.; Ortiz, J. V.; Cui, Q.; Baboul, A. G.; Clifford, S.; Cioslowski, J.; Stefanov, B. B.; Liu, G.; Liashenko, A.; Piskorz, P.; Komaromi, I.; Martin, R. L.; Fox, D. J.; Keith, T.; Al-Laham, M. A.; Peng, C. Y.; Nanayakkara, A.; Challacombe, M.; Gill, P. M. W.; Johnson, B.; Chen, W.; Wong, M. W.; Gonzalez, C.; Pople, J. A.; Gaussian 03 Inc., Revision C.02, USA, 2004. All the other calculations were carried out using the Matlab R2012b software.1919 MATLAB and Statistics Toolbox Release 2012b; The MathWorks, Inc., USA, 2012.
Results and Discussion
Simulated example
Figure 4 presents the results obtained in the simulated example with 150 objects described by (x1, x2) pairs generated in a random manner. For better visualization, the corresponding y-values were normalized in the [0, 1] range, with 0 and 1 corresponding to the minimal and maximal values in the simulated data set, respectively. The results were obtained by using K = 1, 5 and 10 nearest neighbours in equation 7, as well as all the objects already selected, i.e., with K = n. As shown in Figure 4, the active search method arrived at the object with the maximal y-value after evaluating n = 98 objects (K = 1), n = 16 objects (K = 5) and n = 17 objects (with either K = 10 or all objects, since the same curve was obtained in both cases), including the first 10 objects selected by the KS algorithm. The poor result obtained with K = 1 can be ascribed to an inadequate estimation of the y-values: the estimate is simply set to y-value of the closest neighbour of the object under consideration. The results for K = 5, 10 and all objects were very similar. Therefore, using all objects can be considered a suitable option in this case, since it does not require the choice of a particular value for K.
Active search results in the simulated example (the same curve was obtained for K = 10 and all objects).
Figure 5 compares the active search results (using all selected objects in the y-estimation procedure) with those obtained by using the KS algorithm alone. As can be seen in Figure 5a, the maximal y-value is only achieved by KS after the evaluation of n = 42 objects. An interpretation of these results can be provided on the basis of the remaining graphs in Figure 5. The 150 objects involved in this example are indicated in Figure 5b over a contour plot of the function associated to the y-values. The initial 10 objects selected by KS are plotted with markers connected by straight lines. As can be seen, this initial selection favoured an exploration of the x-space, with objects spread over the entire x1-x2 plane. Figure 5c illustrates the first improvement provided by the active search after the KS initialization. As can be seen, after selecting 2 additional objects, an object with a larger y-value was found. This improvement corresponds to the first step in Figure 5a. In contrast, the KS algorithm continued to favour the selection of objects that are not close to each other, as shown in Figure 5d, which prevented the selection of objects close to the best one already found. The object with the largest y-value was found by the active search method after the evaluation of n = 17 objects, as shown in Figure 5e. For comparison, Figure 5f shows that KS still did not exploit the region associated to the larger y-values.
Active search (all objects) and Kennard-Stone (KS) results in the simulated example. (a) Largest value of y (normalized) obtained after analyzing n objects; (b) contour plot of y-values with indication of the overall dataset (asterisk markers) and the 10 initial objects selected by the KS algorithm (markers connected by straight lines). The markers are connected by straight lines following the order in which they were selected. The blue square marker indicates the last selected object. (c), (d), (e), (f) Objects selected by the KS and active search algorithms with n = 12 and n = 17.
Actual data sets
Figures 6a and 6b present the active search results obtained with the QSAR and eucalyptus wood data sets, respectively. In each case, the plots represent the average values for the 150 subsets generated by the subsampling procedure, as described in the Experimental section. As in the simulated case study, the y-values were normalized in the [0, 1] range and the results were obtained by using K = 1, 5, 10, as well as all the objects already selected, i.e., K = n. Again, the use of K = 1 yielded the slowest convergence to the maximal y-value, which indicates that larger values of K are required for an appropriate estimation of y within the proposed active search algorithm. The results for K = 5, 10 and all objects were similar, with a slight advantage of using all objects in the QSAR data set (Figure 6a). It is worth recalling that using all objects is a convenient option for the analyst, since the choice of particular value of K is not required.
Active search results for the (a) quantitative structure-activity relationship (QSAR) and (b) near-infrared (NIR) data sets.
Finally, Figure 7 compares the active search results (all objects) with those obtained by using KS alone. As can be seen, the active search method provided a faster convergence to the maximal y-value in both data sets, as compared to the KS algorithm.
Active search (all objects) and Kennard-Stone (KS) results for (a) quantitative structure-activity relationship (QSAR); and (b) nearinfrared (NIR) data sets.
Conclusions
This paper proposed an active search method, which can be used to find objects with optimal or near-optimal y-property values with reduced experimental workload. The proposed method is based on the K-nearest neighbour regression technique, which does not involve assumptions on the linearity of the x-y relationship and is not adversely affected by multicollinearity problems among the x-variables. The number K of nearest neighbours employed in the estimation of the y-property is a design parameter that needs to be chosen by the analyst. However, the tests carried out in the present work suggest that this choice is not a critical factor for the application of the proposed method. Indeed, good results were also obtained by using a simpler version of the KNNR technique, in which all the objects already selected are employed in the estimation of y.
Examples were presented with simulated data, as well as actual QSAR and NIR spectrometry datasets. In all these cases, the active search yielded results closer to the maximal y-value compared to the classical KS algorithm for object selection. These results indicate that the proposed method is indeed of value to reduce the number of y-property determinations in the search for the optimal object.
Future improvements of the proposed method could be concerned with the calculation of confidence intervals for the estimated values ŷ. Such confidence intervals may be of value to establish a stopping criterion for the active search.
-
FAPESP has sponsored the publication of this article.
Acknowledgments
The authors acknowledge the support of CNPq (research fellowships) and Mectron Engenharia, Indústria e Comércio. The authors are also grateful to Prof Celio Pasquini (Chemistry Institute, UNICAMP, Brazil) for providing the eucalyptus wood data set employed in this work.
References
-
1Guvenir, H. A.; Uysal, I.; Knowl.-Based Syst. 2000, 13, 207.
-
2Pirogov, A. V.; Platonov, M. M.; Pletnev, I. V.; Obrezkov, O. N.; Shpigun, O. A.; Anal. Chim. Acta 1998, 369, 47.
-
3Zomer, S.; Sánchez, M. N.; Brereton, R. G.; Pavón, J. L. P.; J. Chemom. 2004, 18, 294.
-
4Ukil, A.; Bernasconi, J.; IEEE Trans. Syst., Man, Cybern. C, Appl. Rev. 2012, 42, 1763.
-
5Douak, F.; Melgani, F.; Alajlan, N.; Pasolli, E.; Bazi, Y.; Benoudjit, N.; J. Chemom. 2012, 26, 374.
-
6Jones, D. R.; Schonlau, M.; Welch, W. J.; J. Global Optim. 1998, 13, 455.
-
7Liu, B.; Zhang, Q.; Gielen, G. G. E.; IEEE Trans. Evol. Comput. 2012, 18, 180.
-
8Zhou, Z.; Ong, Y. S.; Lim, M. H.; Lee, B. S.; Soft Comput. 2007, 11, 957.
-
9Eskandari, H.; Geiger, C. D.; J. Heuristics 2008, 14, 203.
-
10Martínez-Esparza, J.; Oficialdegui, A. M.; Pérez-Silanes, S.; Heras, B.; Orús, L.; Palop, J. A.; Lasheras, B.; Roca, J.; Mourelle, M.; Bosch, A.; Castillo, J. C.; Tordera, R.; Rio, J.; Monge, A.; J. Med. Chem. 2001, 44, 418.
-
11Tropsha, A.; Mol. Inform. 2010, 29, 476.
-
12Pasquini, C.; Carneiro, C. J. G.; Bomfim, P. M.; Papel 2007, 68, 71.
-
13Kennard, R. W.; Stone, L. A.; Technometrics 1969, 11, 137.
-
14Galvão, R. K. H.; Araújo, M. C. U. In Comprehensive Chemometrics. Chemical and Biochemical Data Analysis; Brown, S. D.; Tauler, R.; Walczak, B., eds.; Elsevier: Oxford, 2009, ch. 3.05.
-
15Haaland, D. M.; Thomas, E. V.; Anal. Chem. 1988, 60, 1193.
-
16Dewar, M. J. S.; Zoebisch, E. G.; Healy, E. F.; Stewart, J. J. P.; J. Am. Chem. Soc. 1985, 107, 3902.
-
17Beebe, K. R.; Pell, R. J.; Seasholtz, B.; Chemometrics: a Practical Guide, Wiley: New York, 1998.
-
18Frisch, M. J.; Trucks, G. W.; Schlegel, H. B.; Scuseria, G. E.; Robb, M. A.; Cheeseman, J. R.; Montgomery Jr., J. A.; Vreven, T.; Kudin, K. N.; Burant, J. C.; Millam, J. M.; Iyengar, S. S.; Tomasi, J.; Barone, V.; Mennucci, B.; Cossi, M.; Scalmani, G.; Rega, N.; Petersson, G. A.; Nakatsuji, H.; Hada, M.; Ehara, M.; Toyota, K.; Fukuda, R.; Hasegawa, J.; Ishida, M.; Nakajima, T.; Honda, Y.; Kitao, O.; Nakai, H.; Klene, M.; Li, X.; Knox, J. E.; Hratchian, H. P.; Cross, J. B.; Bakken, V.; Adamo, C.; Jaramillo, J.; Gomperts, R.; Stratmann, R. E.; Yazyev, O.; Austin, A. J.; Cammi, R.; Pomelli, C.; Ochterski, J. W.; Ayala, P. Y.; Morokuma, K.; Voth, G. A.; Salvador, P.; Dannenberg, J. J.; Zakrzewski, V. G.; Dapprich, S.; Daniels, A. D.; Strain, M. C.; Farkas, O.; Malick, D. K.; Rabuck, A. D.; Raghavachari, K.; Foresman, J. B.; Ortiz, J. V.; Cui, Q.; Baboul, A. G.; Clifford, S.; Cioslowski, J.; Stefanov, B. B.; Liu, G.; Liashenko, A.; Piskorz, P.; Komaromi, I.; Martin, R. L.; Fox, D. J.; Keith, T.; Al-Laham, M. A.; Peng, C. Y.; Nanayakkara, A.; Challacombe, M.; Gill, P. M. W.; Johnson, B.; Chen, W.; Wong, M. W.; Gonzalez, C.; Pople, J. A.; Gaussian 03 Inc., Revision C.02, USA, 2004.
-
19MATLAB and Statistics Toolbox Release 2012b; The MathWorks, Inc., USA, 2012.
Publication Dates
-
Publication in this collection
July 2016
History
-
Received
02 Dec 2015


