Abstract
The sensitive and selective chemosensor for copper(II) ions (Cu2+) was successfully optimized using the 1,5-diphenylthiocarbazone (DPT) compound. The result showed that dimethyl sulfoxide (DMSO) in a 9:1 (DMSO:water) ratio at a pH of 3 was the optimum medium for DPT to act as chemosensor of Cu2+ recognition. The DPT chemosensor did not encounter any interference from other metal ions, including Fe3+, Ag+, Cr3+, Pb2+, Mg2+, Cd2+, Zn2+, K+, Ni2+ and Co2+. The presence of Cu2+ led to an absorption peak at 658 nm, where the color changed from cantaloupe to gray-green color indicating the interaction by the formation of the DPT-Cu complex in 2:1 stoichiometry. The theoretical s-profile calculation using conductor-like screening model for real solvents (COSMO-RS) showed the compatibility of DPT with the DMSO solvent through hydrogen bonding. In the density functional theory (DFT) calculations, the formation energy of DPT and DPT-Cu were -1113.79645660 and -2435.71832681 a.u. , respectively. Under optimal conditions, a detection limit of 6.08 µM for the DPT chemosensor for Cu2+ recognition can compete with the flame atomic absorption spectroscopy (FAAS) value of 6.21 µM. Finally, DPT was able to provide less expensive, more portable and convenient chemosensor for Cu2+ recognition in environmental water samples.
Keywords:
chemosensor; colorimetric; COSMO-RS; DFT; test strip
Introduction
Copper is a vital micronutrient for life and plays an important role in numerous essential reactions. Foods relatively high in copper content include mushrooms, dried fruits, legumes, whole-cereal grain products, peanut butter, nuts, organ meats (liver) and shellfish (crustaceans, oysters). Copper is essential for maintaining the strength of skin, blood vessels, epithelial and connective tissue throughout the body. Copper also plays an important role in the production of hemoglobin, myelin, melanin and it keeps thyroid gland functioning normally.11 Osredkar, J.; Sustar, N.; J. Clin. Toxicol. 2011, S3, 001. Copper deficiency may lead to anemia and bone marrow suppression, followed by a neurologic syndrome called myelopathy.22 Hedera, P.; Fink, J. K.; Bockenstedt, P. L.; Brewer, G. J.; Arch. Neurol. 2003, 60, 1303. Copper can also act as a pro-oxidant that promotes free radicals, which may cause oxidative damage to lipids, proteins and DNA, resulting in the development of neurodegenerative disorders such as Alzheimer’s disease.33 Gaetke, L. M.; Chow, C. K.; Toxicology 2003, 189, 147. Detection of this metal ion is important because many industrial and agriculture activities release it into the environment. Copper can accumulate in soil and water, causing exposure to the food chain and aquatic life.44 Nor, Y. M.; Environ. Res. 1987, 43, 274. In typical environmental samples, it is difficult to detect metal ions due to the low concentration. Currently, the study of highly selective chemosensors for metal ion detection has attracted considerable attention.
Chemosensors are an alternative approach for the detection of metal ions within environmental and biomedical fields. Many existing methods for heavy metals detection, such as flame atomic absorption spectroscopy (FAAS) and inductive coupled plasma mass spectrometry (ICP-MS) are expensive, time-consuming and can only be used by skilled operator. Certain instruments cannot be used in the field for the rapid detection of unknown analytes because of the requirement of large or heavy instruments that require access to power outlets, solvents and chemicals. Alternatively, chemosensors utilize molecules that can bind selectively and reversibly with an anion or a cation.55 Orojloo, M.; Amani, S.; Talanta 2018, 186, 584. Chemosensors offer several advantages, including the feasibility of naked-eye and on-site detection through color change in the presence of analytes. In addition, colorimetric chemosensors are an excellent alternative due to the low cost, as well as convenient and easy monitoring of the target ions.66 Jang, H. J.; Ahn, H. M.; Kim, M. S.; Kim, C.; Tetrahedron 2017, 73, 6624. The colorimetric chemosensor exploits the principles of ligand interactions with metal ion, leading to a change recognizable by the naked-eyes, which is very useful for this application.77 Wasukan, N.; Srisung, S.; Kuno, M.; Kulthong, K.; Maniratanachote, R.; Spectrochim. Acta, Part A 2015, 149, 830. The compound that was used in the chemosensor developed in this study was 1,5-diphenylthiocarbazone (DPT) (PubChem CID:657262), as shown in Figure 1. The sensitivity and selectivity of DPT to act as a chemosensor was optimized experimentally using UV-Vis spectroscopy.
3D structure of 1,5-diphenylthiocarbazone (DPT) (the nomination of the atoms in the image is inverted in relation to the text, but refers to the same atom).
The theoretical development approach used conductor-like screening model for real solvents (COSMO-RS) and density functional theory (DFT) calculations to thoroughly analyze the interaction and the chemical properties of DPT as a chemosensor for the Cu2+ recognition. COSMO-RS is a quantum chemical calculation-based simulation tool, which has been proven to precisely predict the chemical potential of a solute in aqueous and organic mixtures. DFT calculations are used to explain the molecular mechanism of the selective capture of metal ions by organic compounds and derivatives, as well as to determine the binding energy of ligand with metal ions.
Results and Discussion
Sensitivity optimization
Effect of solvents
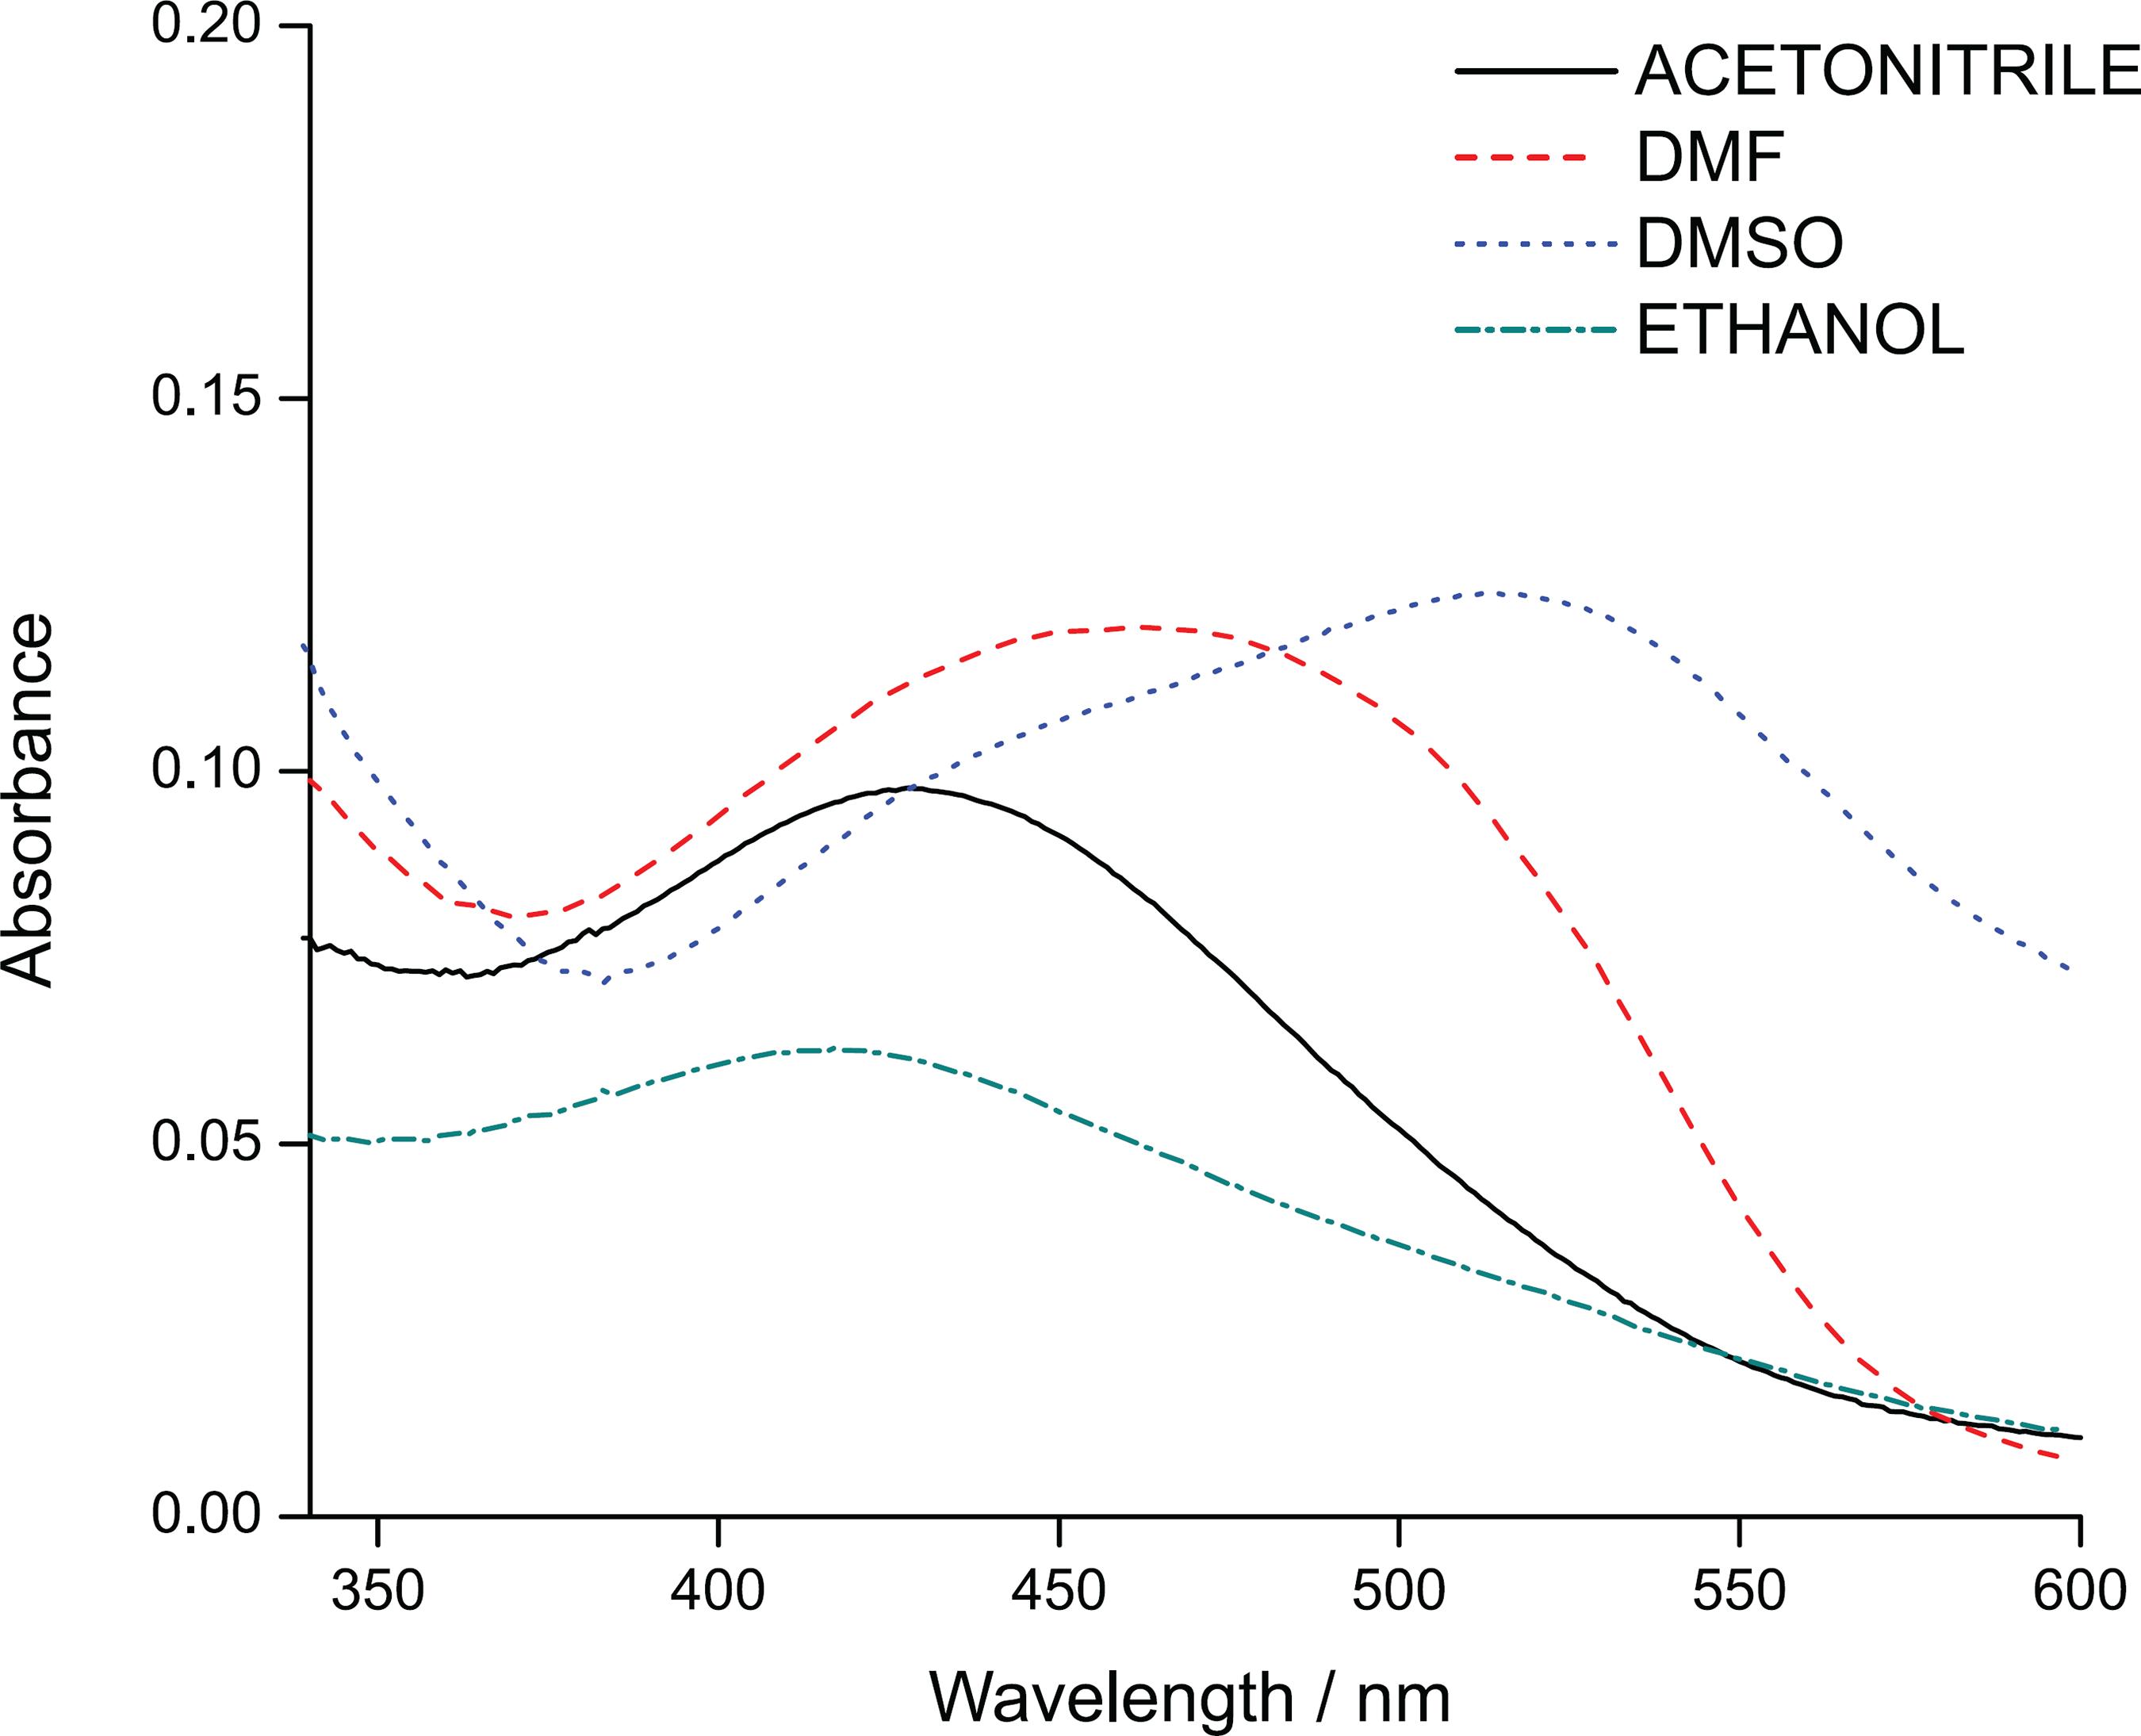
Figure 2 shows the absorption spectra of DPT in different solvents in order to identify the most suitable solvent for interaction with DPT. The changes in the position of the peaks displayed by each solvent indicate the interaction of DPT with the solvent. Ethanol and acetonitrile displayed a band in a similar wavelength positioned at 420 nm. Since ethanol and acetonitrile were the most polar solvents, both were expected to be the most blue-shifted because hydrogen bonds form more readily at the ground state, thus increasing the energies of electronic transitions in the molecules.88 Pavia, D. L.; Lampman, G. M.; Kriz, G. S.; Vyvyan, J. R.; Introduction to Spectroscopy, 4th ed.; Brooks/Cole: Belmont, 2010. The interaction with dimethylformamide (DMF) and dimethyl sulfoxide (DMSO) showed peak at 470 and 520 nm, respectively. These solvents were categorized as less polar solvents, thus resulting in higher wavelengths than for the polar solvents. DMSO was selected as the most suitable solvent based on the higher red-shifted absorption spectrum. This was due to the effect of the excited state dipole moment changes or changes in the hydrogen bonding strength of polar solvents.55 Orojloo, M.; Amani, S.; Talanta 2018, 186, 584. Further explanation can be found in the “Theoretical studies” sub-section, regarding the interactions between each solvent and DPT using the COSMO-RS calculation.
Effect of the co-solvent
Figure 3 shows the absorption spectra of DPT in DMSO and water mixtures with different solvent ratios versus the wavelength recorded for each reaction. Water was added as a co-solvent to increase the dielectric constant of the premier solvent, which resulted in increasing the sensitivity of the chemosensor. Based on the graph, there were two peaks observed at wavelengths of 450-490 and 620 nm, respectively. As the water volume fraction increased, the absorbance gradually decreased for both peaks.99 Wen, X.; Fan, Z.; Sens. Actuators, B 2017, 247, 655. The peak at 620 nm displayed a hypochromic effect, indicated by a decrease in the intensity of absorbance. The different DMSO:water ratios provided different reactions during interaction with DPT. Referring to Figure 3, the 9:1 ratio was selected as the optimum and will be used throughout this study, due to exhibiting the highest hyperchromic effect, thus increasing the sensitivity of the chemosensor.1010 Li, Y.; Shi, W.; Ma, J.; Wang, X.; Kong, X.; Zhang, Y.; Feng, L.; Hui, Y.; Xie, Z.; J. Photochem. Photobiol., A 2017, 338, 1.
Effect of pH
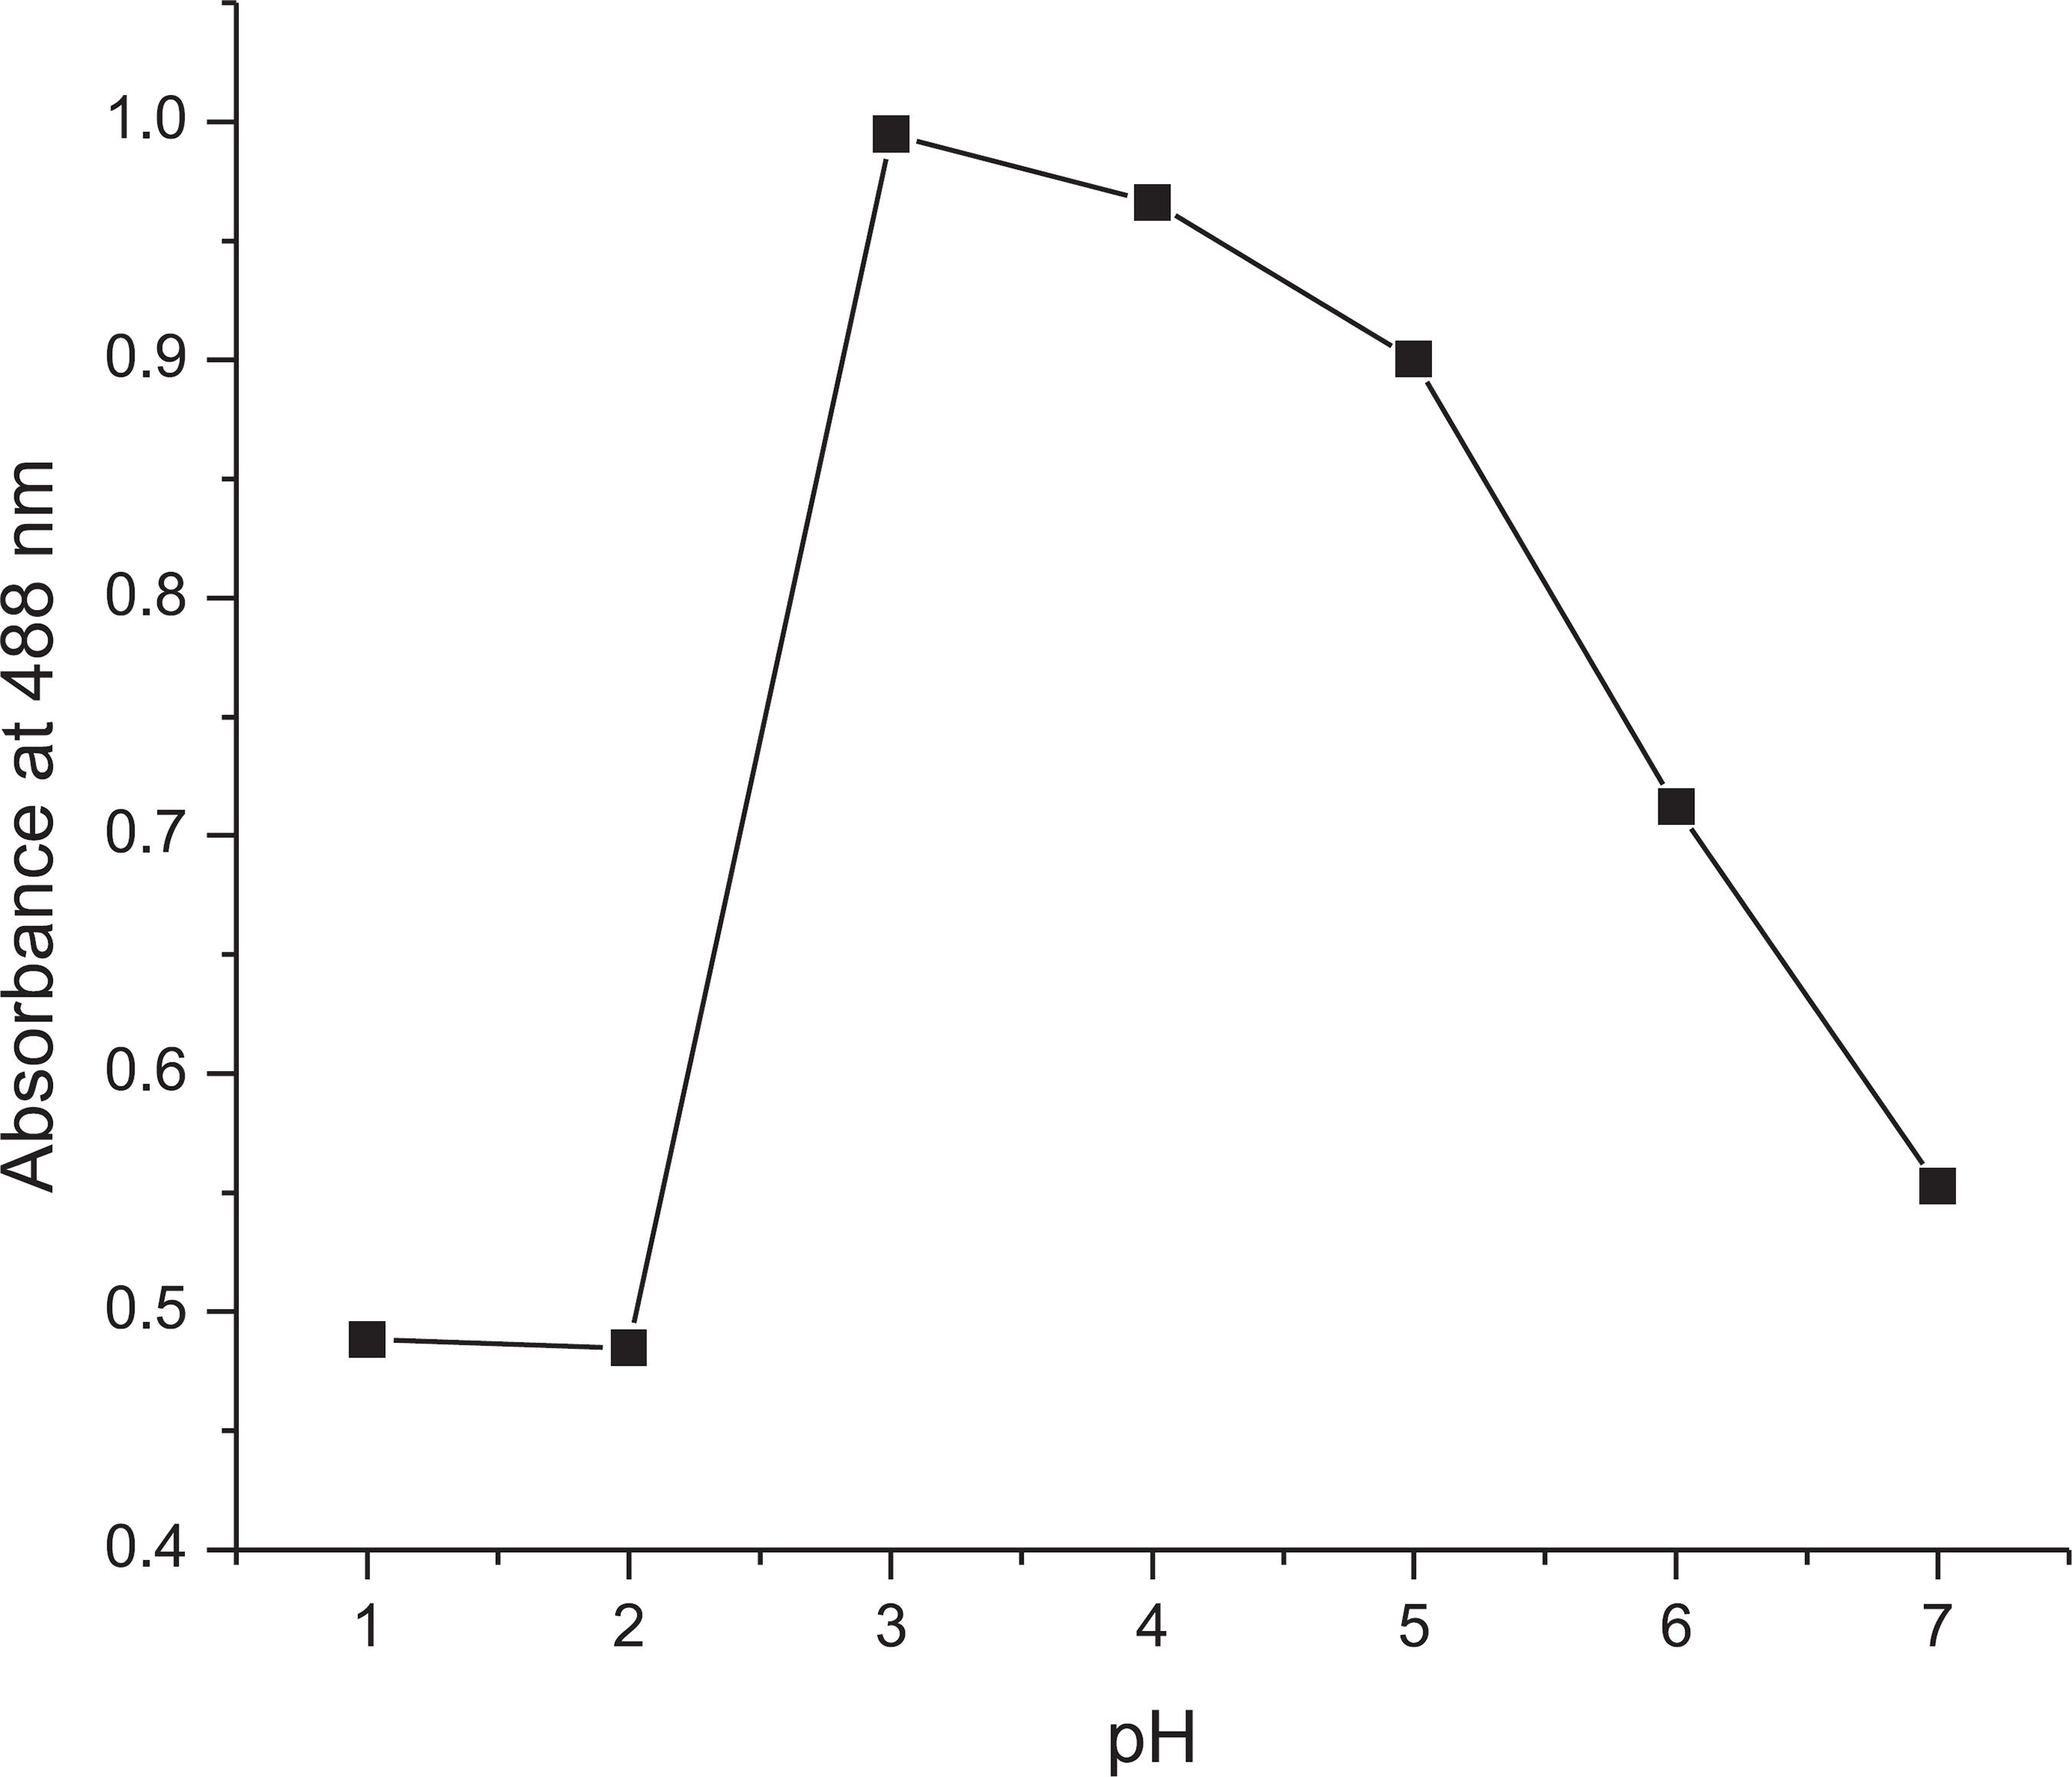
Optimum pH was required to study the effect of different medium and conditions on the DPT sensor. The effect of the pH on the color intensity of the absorption spectra was studied. The pH values were prepared by combining specific amounts of citric acid and disodium phosphate solution using a pH meter. pH values from 1.0 to 7.0 were studied to optimize the chemosensor system, as shown in Figure 4. Based on the graph, the absorbance was observed to be constant and relatively unaffected at pH values of 1.0 and 2.0. The absorbance then increased to a maximum at a pH of 3.0 but decreased gradually from 4.0 to 7.0. A pH of 3.0 was chosen for further analysis because at this pH the color of the DPT-Cu complex showed stable absorption intensity, which indicated that Cu2+ could be clearly detected by the naked eye or UV-Vis measurement. This result showed that DPT and Cu2+ will favorably interact in an acidic medium, where DPT behaves as a monobasic acid in the complex formation.1111 Bendix, G. H.; Grabenstetter, D.; Ind. Eng. Chem. 1943, 15, 649.,1212 Irving, B. H.; Cooke, S. J. H.; Woodger, S. C.; Williams, R. J. P.; J. Chem. Soc. 1949, 395, 1847.
Selectivity optimization
Naked eye observation
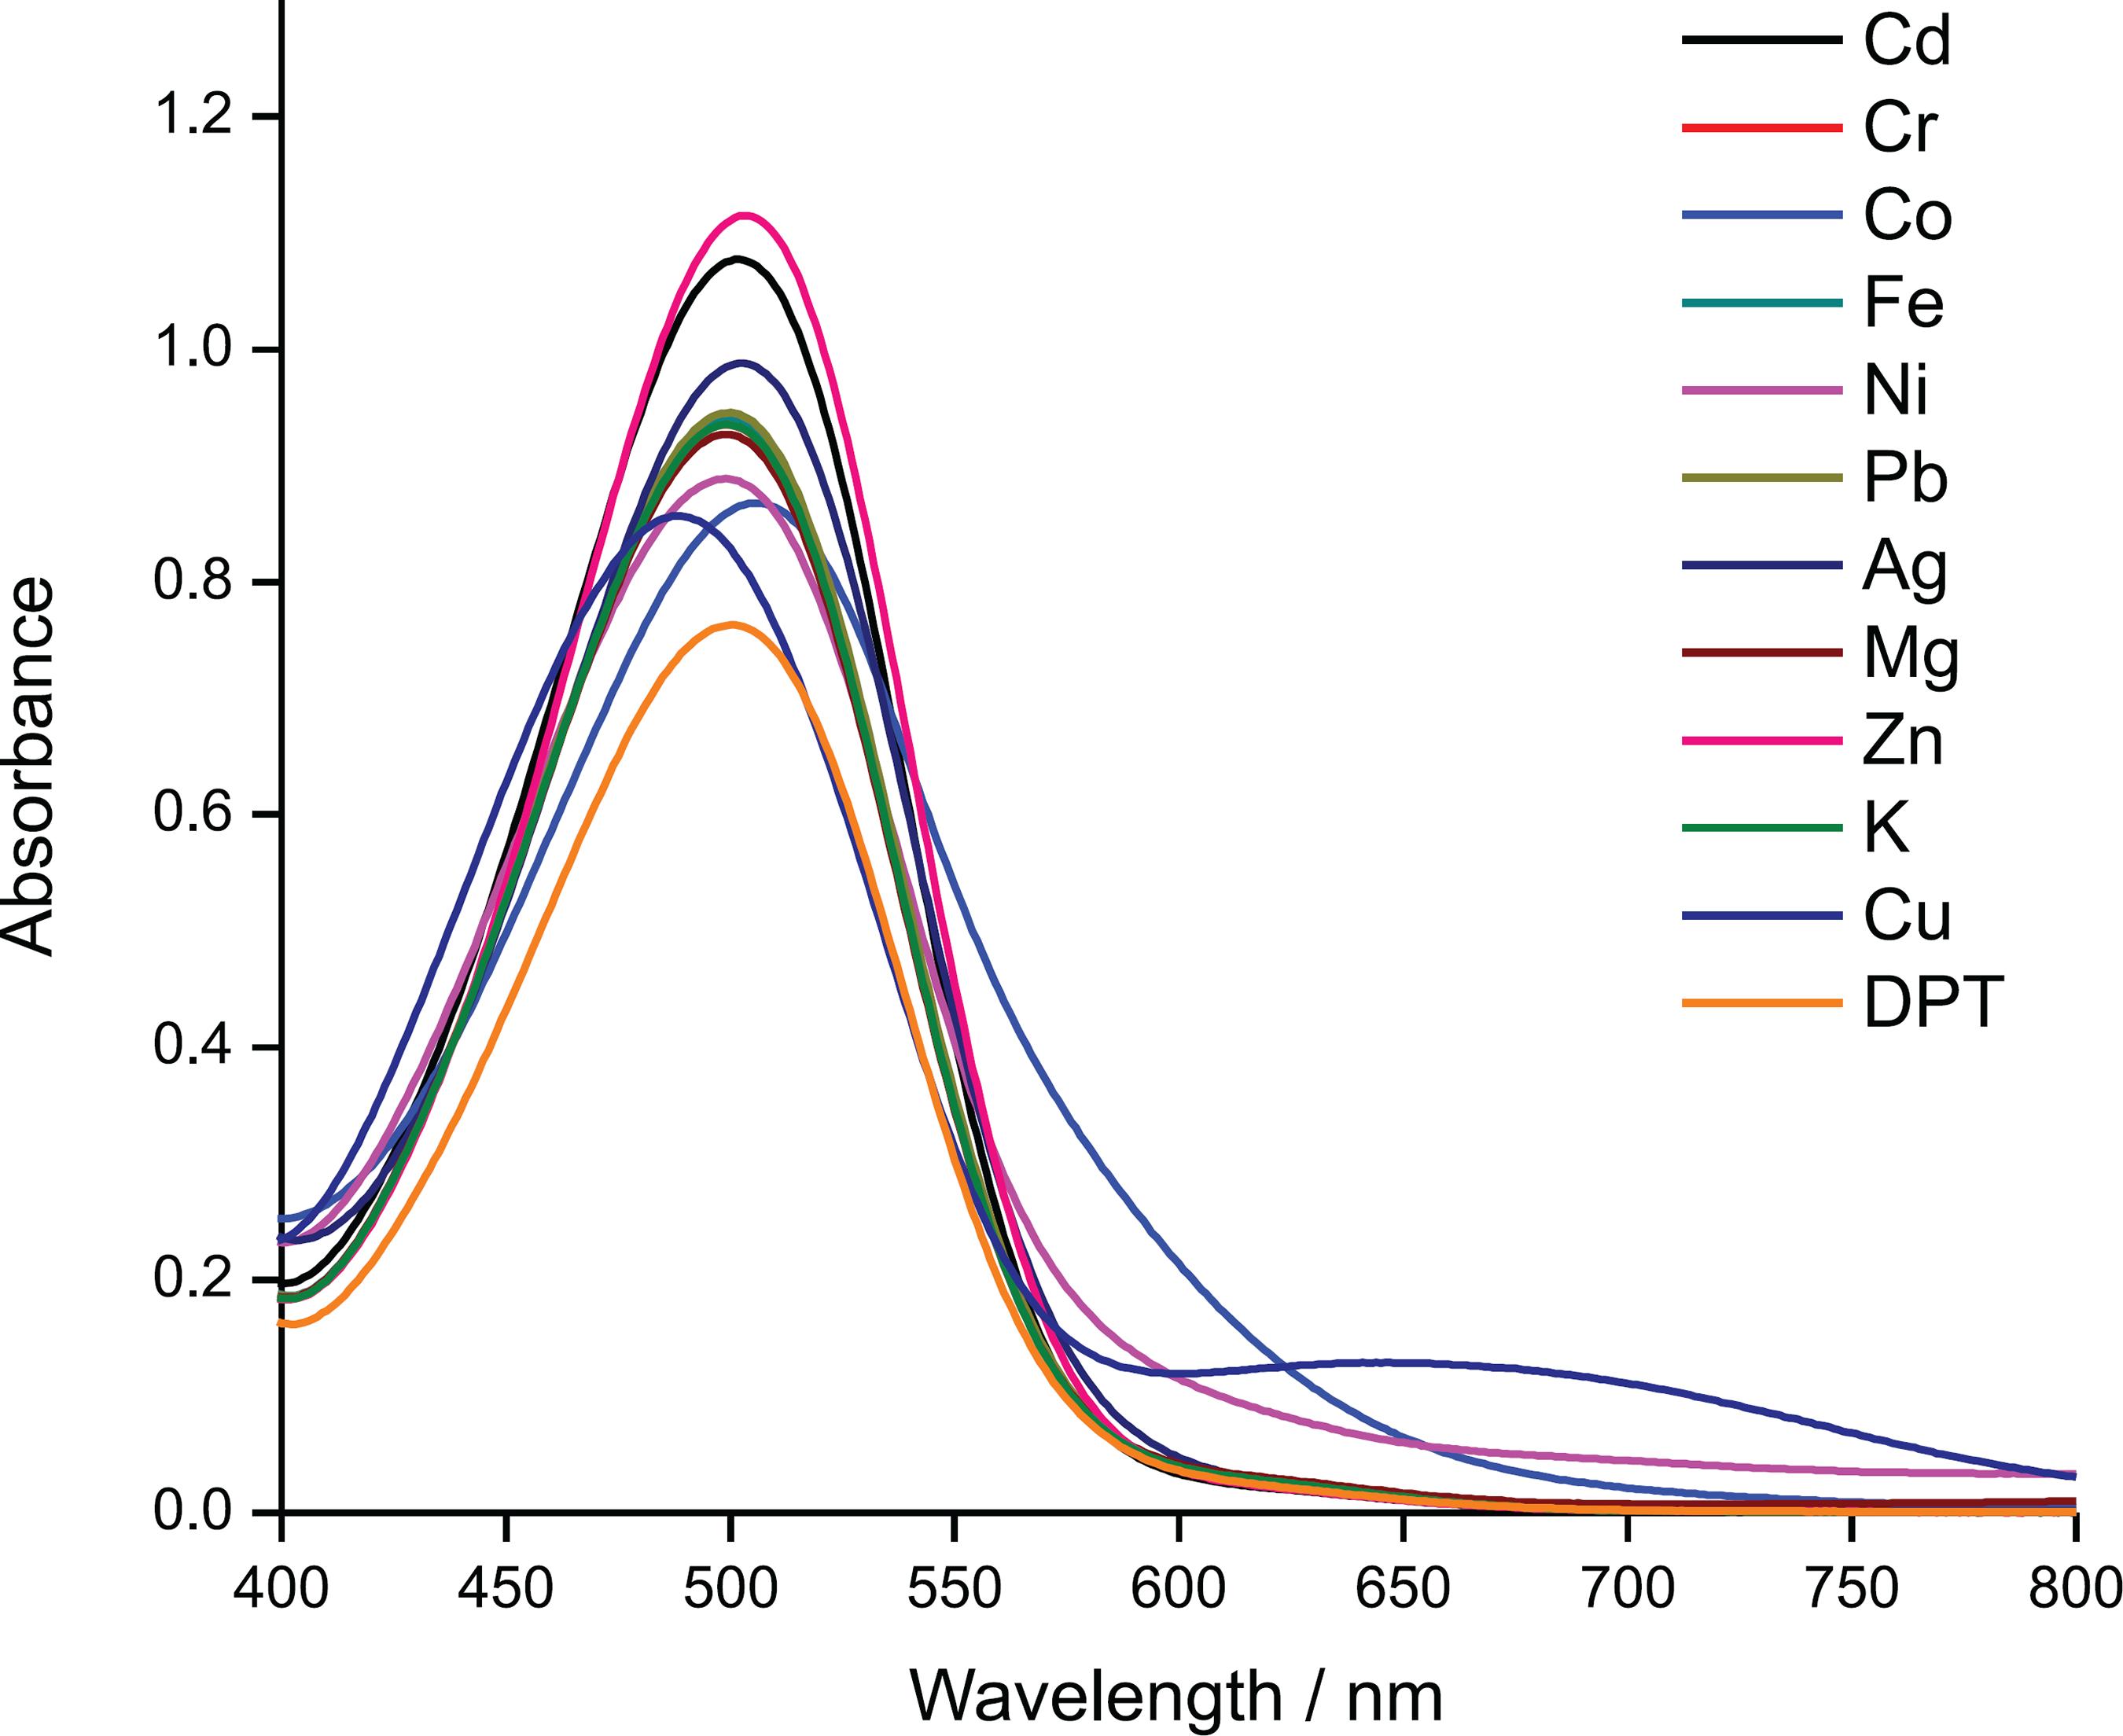
The selectivity of DPT in an optimized condition was conducted by testing 11 types of metal ions: Fe3+, Ag+, Cr3+, Pb2+, Cu2+, Mg2+, Cd2+, Zn2+, K+, Ni2+ and Co2+. The color of the DPT-Cu complex can be distinguished from the DPT-other-metal-ions by naked eye in Figure 5. This is an effective method for detecting Cu2+ ions from other metal ions by displaying an old moss green color while other metal ions showed no significant color change. The naked eye observation was supported by UV-Vis spectroscopy characterization in Figure 6, which confirmed that only DPT-Cu formed a new band at 658 nm. This indicated the formation of a new species (complex formation) with a molar extinction coefficient (ε) of 4 × 1033 Gaetke, L. M.; Chow, C. K.; Toxicology 2003, 189, 147. L moL-1 cm-1. The hypsochromic shift occurred from 500 to 488 nm. This blue shift was due to strong sulfur and nitrogen donor atoms binding to the Cu2+ ion. It also identified the shift to a shorter wavelength caused by the n-π* transition of sulfur chromophore.1010 Li, Y.; Shi, W.; Ma, J.; Wang, X.; Kong, X.; Zhang, Y.; Feng, L.; Hui, Y.; Xie, Z.; J. Photochem. Photobiol., A 2017, 338, 1.
The observed color of DPT (50 μM) after the addition of metal cations under optimized conditions.
Interference analysis
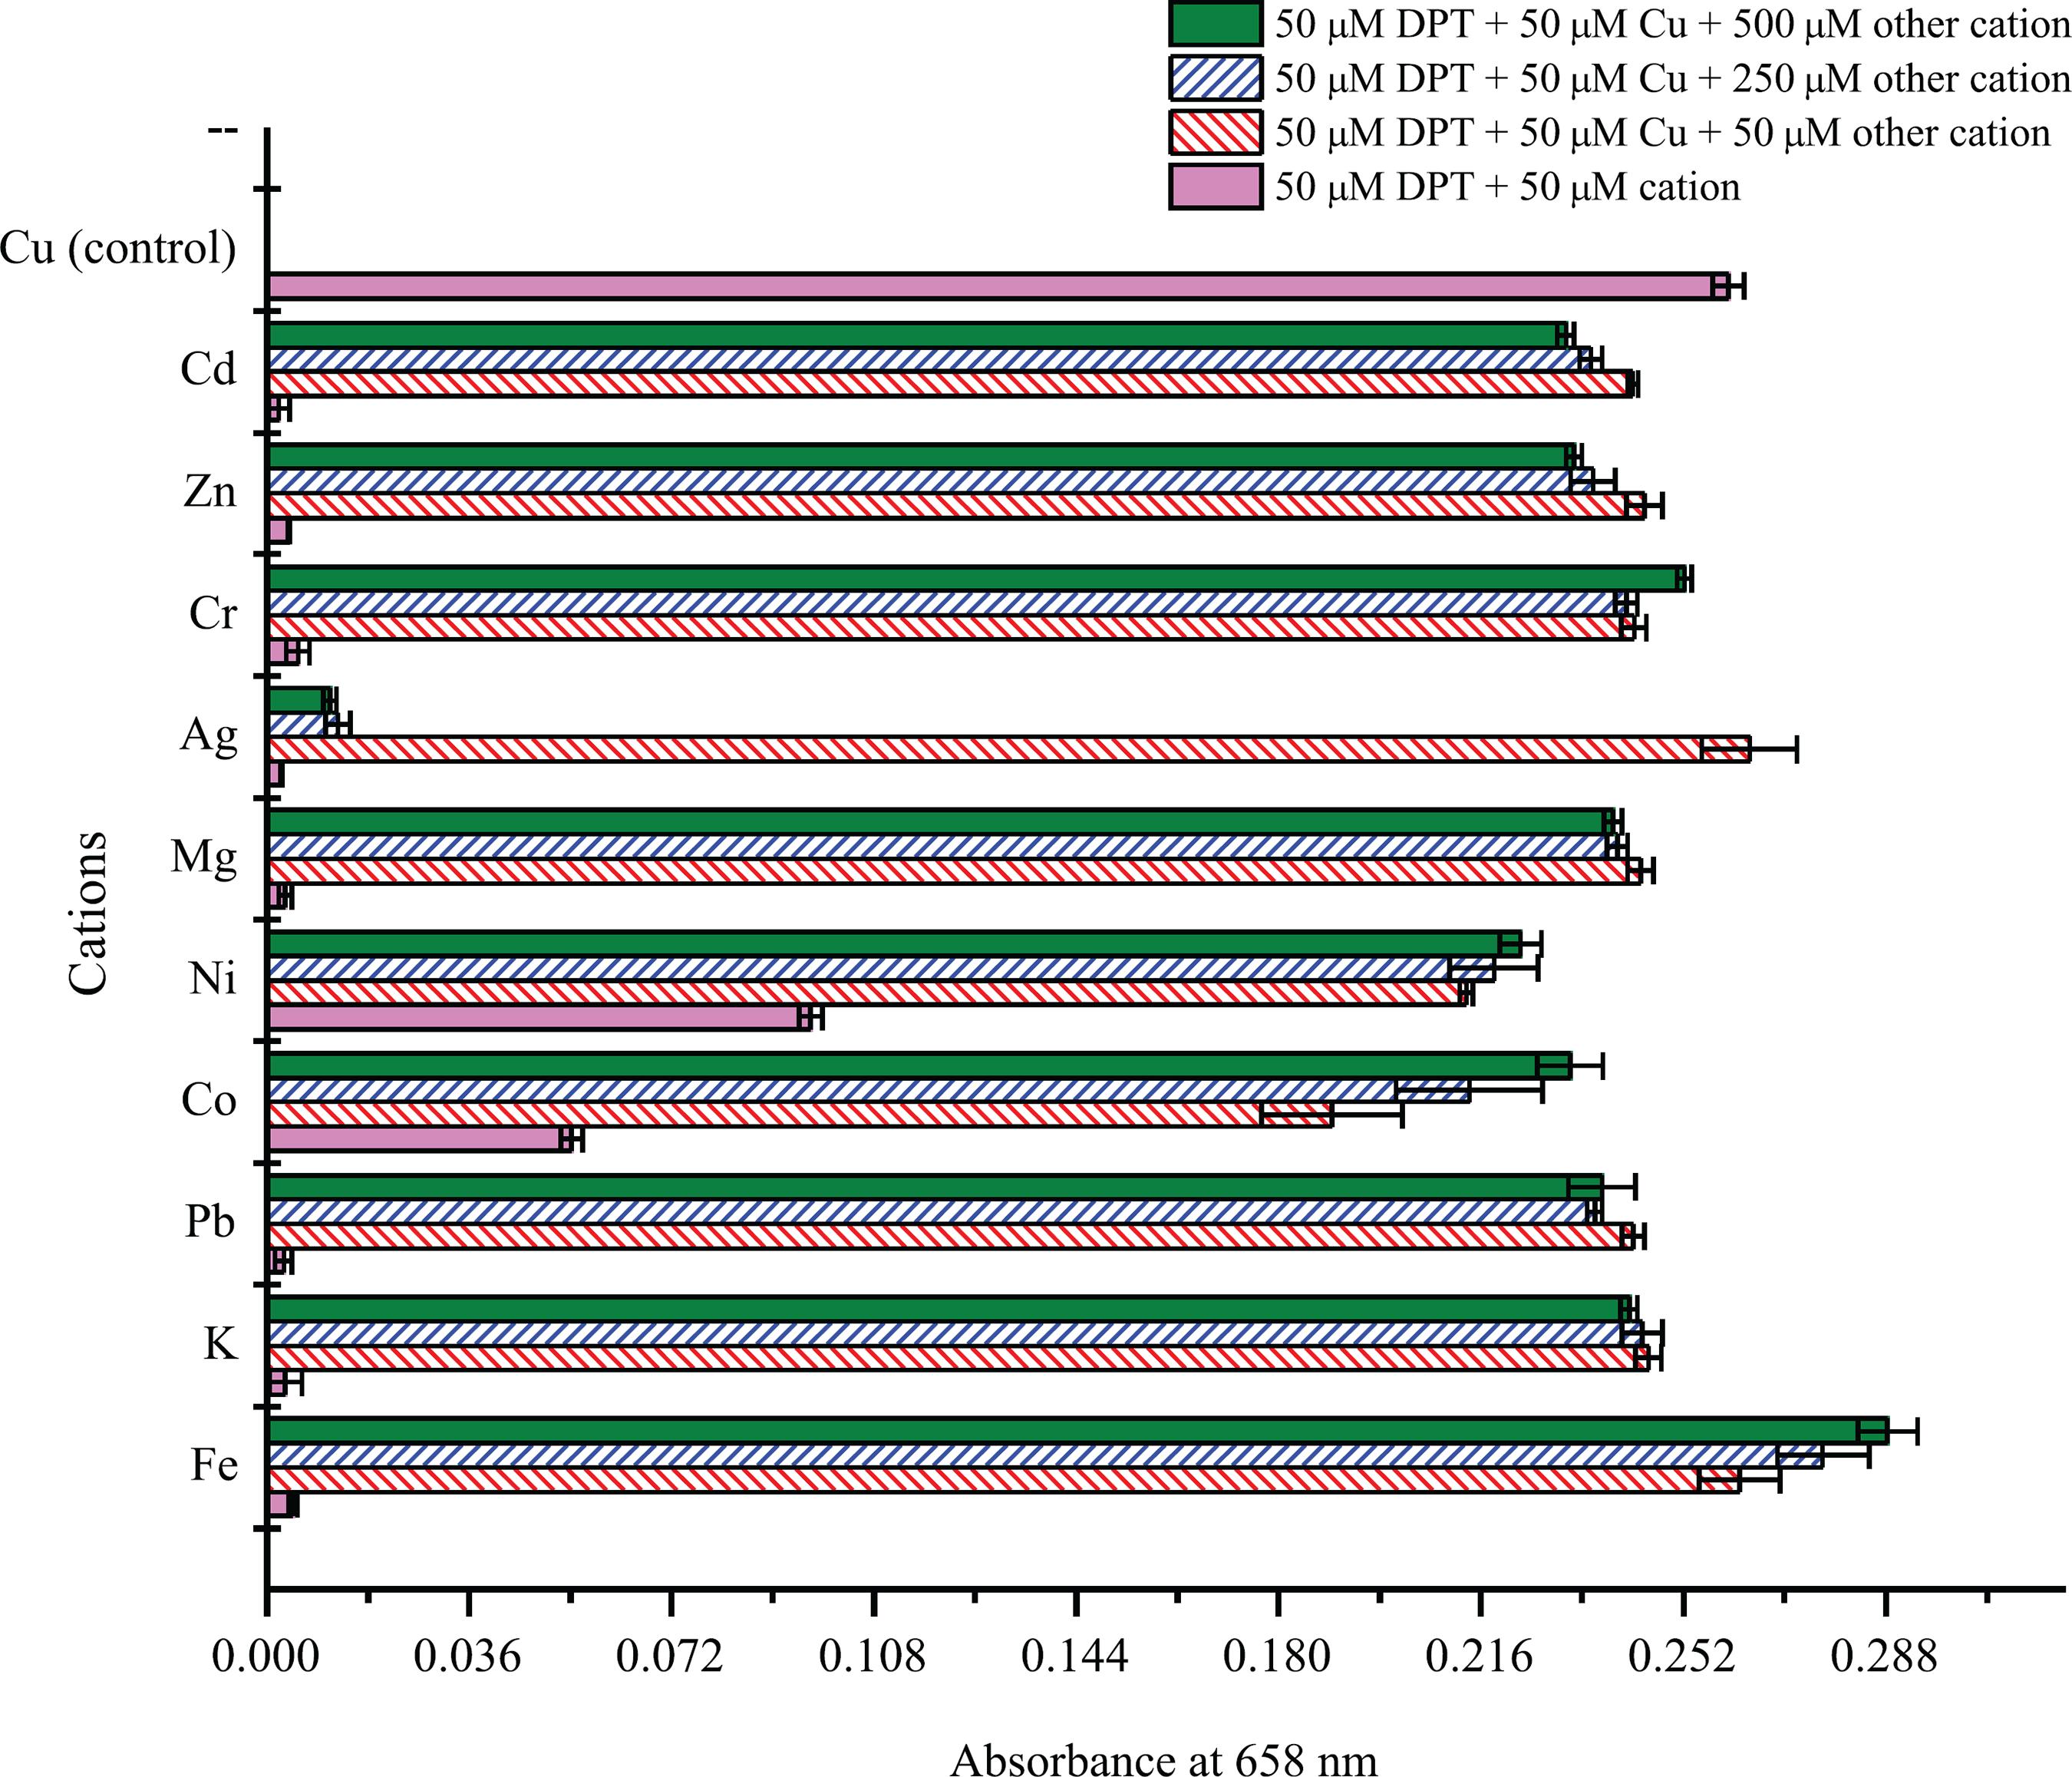
Interference analysis was performed to study the selective affinity of DPT toward Cu2+ and to determine the influence of other metal ions on the complex of DPT with Cu2+. The presence of other metal ions (K+, Cr3+, Zn2+, Cd2+, Mg2+, Ni2+ and Pb2+) in different equivalents (1, 5 and 10) had showed no significant effect (p ≤ 0.05) on the DPT-Cu complex except for Ag+, Fe3+, and Co2+ ions. As shown in Figure 7, the addition of different equivalents of other cations in the presence of Cu2+ also demonstrated higher absorbance than with DPT-cations alone. The result indicated that DPT could be used as a selective optical probe for detecting Cu2+ in presence of other competing metal ions.
Limit of detection
A titration experiment was conducted using different concentration of Cu2+ in DPT under optimized conditions to study the effect of the concentration and to further analyze the binding affinity of the sensor with Cu2+. The titration experiment also determined the limit of detection of DPT for Cu2+ recognition. Figure 8 shows that upon the addition of different concentrations of Cu2+ to the DPT solution, a significant peak was observed at 658 nm with two clear isosbestic points at 390 and 570 nm. The distinct isosbestic points suggest that there was a total conversion of DPT into the DPT-Cu complex. It can be seen that the absorbance from 500 to 480 nm gradually decreased upon increasing the concentration of Cu2+. In contrast, as the concentration of Cu2+ increased, the absorbance at 658 nm increased, indicating the complex formation also increased.
The limit of detection is the lowest analyte concentration likely to be reliably distinguished from the blank and at which detection is feasible.1313 Armbruster, D. A.; Pry, T.; Clin. Biochem. Rev. 2008, 29, S49. Replicates of the blank containing no analyte were tested and the limit of detection was calculated using the formula:
where δ is the standard deviation of the blank solution and K is the slope of the calibration curve.1414 Sarkar, D.; Pramanik, A. K.; Mondal, T. K.; Spectrochim. Acta, Part A 2016, 153, 397.
From the graph in Figure 9, the coefficient of determination (R2) value was 0.9812, showing a good linear relationship between the absorbance and the concentration in the range of 1-100 µM of Cu2+. From the calibration curve, the slope was 2.066 × 10³ and the standard deviation value was 4.188 × 10⁻³. The detection limit for Cu2+ using DPT was calculated to be 6.08 × 10⁻⁶ or 6.08 µM, which confirms that DPT can recognize Cu2+ with high sensitivity. The detection limit of the DPT probe and FAAS were compared and the calculation showed that the probe could compete with FAAS. The detection limits for DPT probe and FAAS were 6.08 µM or 1.47 ppm and 6.21 µM or 1.50 ppm,1515 PerkinElmer; Atomic Spectroscopy: A Guide to Selecting the Appropriate Technique and System; PerkinElmer: Waltham, 2008. Available at https://www.perkinelmer.com/Content/relatedmaterials/brochures/bro_worldleaderaaicpmsicpms.pdf, accessed in April 2019.
https://www.perkinelmer.com/Content/rela...
respectively.
Job plot measurement
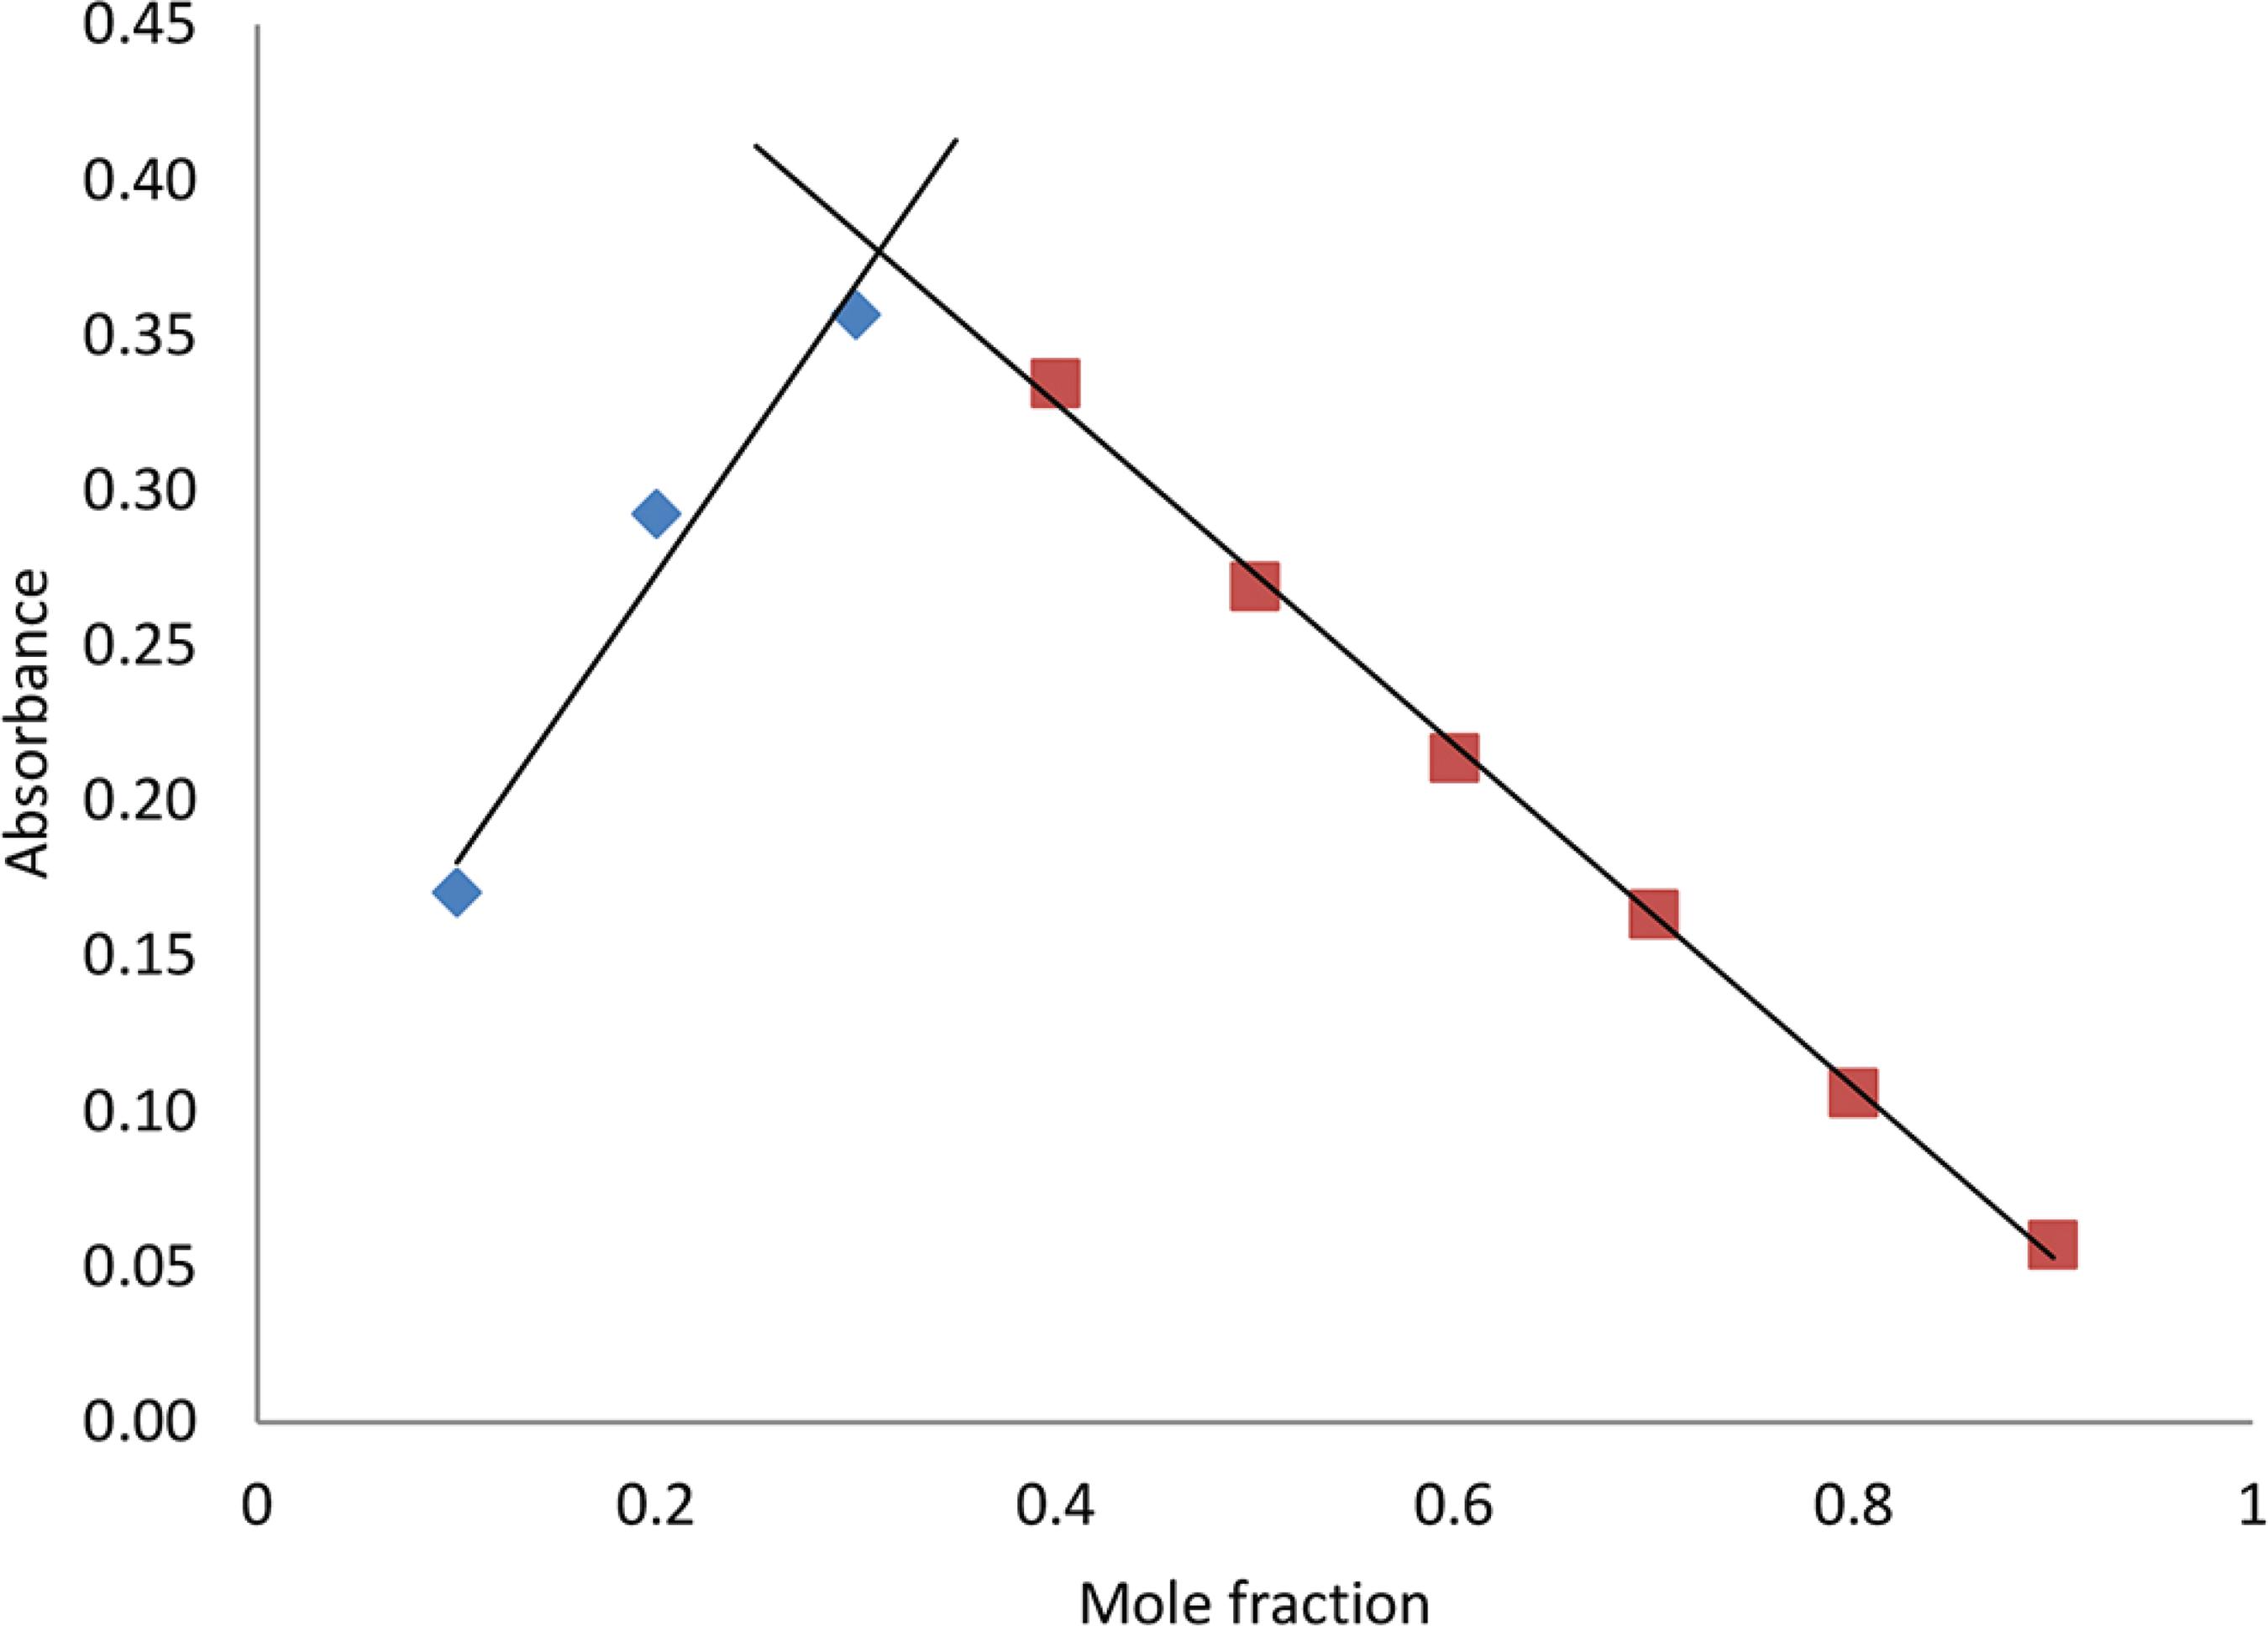
Stoichiometry of the DPT-Cu complex was determined by Job plot measurement. The Job plot was constructed by plotting absorbance versus mole fraction of Cu2+ at 658 nm, as in Figure 10. The binding stoichiometry between DPT and Cu2+ was represented by the mole fraction of the complex at maximum absorption. The maximum absorption intensity was observed at the 0.3 molar fraction. This indicated a 2:1 stoichiometry, which is the [L]/[Cu2+] fraction between the DPT chemosensor and Cu.1616 Likussar, W.; Boltz, D. F.; Anal. Chem. 1971, 43, 1265.
Colorimetric probe evaluation
The naked-eye detection analysis was conducted using test strips. Based on Figure 11, the color of test strips under optimized conditions changed from cantaloupe (DPT only) to gray-green color on the cellulose paper, indicating the presence of Cu2+ ions in the lake water sample. It also showed that the Cu2+ ions were successfully bound with DPT and produced a significant color change. A further analysis using UV-Vis was conducted to evaluate the ability of DPT in acting as a chemosensor towards Cu2+ ions.
UV-Vis analysis
The absorption response of Cu2+ ions (50 µM) with and without DPT (50 µM) in the lake water was conducted. As shown in Figure 12, a new band in the range of 600 to 800 nm was formed, showing that DPT can be used to detect Cu2+ in the lake water sample. The response from the absorption spectra was in good agreement to the results in Figure 11, indicating the feasibility of DPT for detecting Cu2+ in real environmental samples.
Validation of the model
The ability of DPT to act as a chemosensor also was validated using ICP-MS. The result showed that the concentration of Cu2+ ions in the lake water using UV-Vis analysis in presence of DPT as a chemosensor and ICP-MS were 51.750 ± 0.023 and 51.152 ± 0.008 µM, respectively. Tukey’s test was done to validate both methods. It shows that, the new method development using UV-Vis in presence of DPT has no significant difference (p ≤ 0.05) between the ICP-MS, which means the chemosensor by using DPT can be used as an alternative probe for detecting Cu2+ ions in environmental water samples.
Theoretical studies
σ-Profile analysis using COSMO-RS
In order to study the behavior of molecules in a solvent and the effect of functional grouping on electronic properties, a s-profile of the molecule was constructed as in Figure 13. The σ-profile is defined as the probability distribution of surface charge density for a given molecule.1717 Roy, S.; Jaidann, M.; Ringuette, S.; Lussier, L. S.; Abou-Rachid, H.; Procedia Comput. Sci.
2010, 1, 1203. The σ-profile is related to the interaction of hydrogen bonds that determine the ability of hydrogen to act as a donor or acceptor. The main interaction that was favored by the DPT compound was polar interaction or hydrogen bonding. The molecules are considered polar when the screening charge density exceeds ± 0.008 e Å-2. All s-profiles of solvents had both polar and nonpolar sites on molecules. All solvents had a peak beyond +0.008 e Å-2, which represented the presence of a hydrogen bond. Most solvents were located in the high polarity region (s > 0.008 e Å-2) and were considered to be hydrogen bond acceptors. The DPT compound and ethanol were observed at values below 0.008 e Å-2, which act as hydrogen bond donors. DPT also showed a peak in the H-bond acceptor regions, which indicates it could also act as a hydrogen bond acceptor. Other density distributions were observed around zero (-0.008 < s < 0.0085 e Å-2) and corresponded to non-polar groups of molecules. It was determined that all the solvents had the possibility to form hydrogen bonds with DPT compounds, because the DPT compound is a hydrogen bond donor. DMSO was selected as the most suitable solvent due to a similar s-profile to DPT, as indicated by the compatibility of these two compounds. DMSO showed the highest absolute value of s-profile and screening charge density, which leads to a stronger compound as a hydrogen bond acceptor.1818 Man, M. S.; Abdullah, M. A. M.; Abdullah, S. B.; Yaacob, Z.; Indian J. Sci. Technol.
2017, 10, DOI 10.17485/ijst/2017/v10i6/111218.
https://doi.org/10.17485/ijst/2017/v10i6...
The peak at the positive side of the DMSO s-profile represented the increase in the hydrogen bond acceptor capability due to its oxygen atoms.1919 Rashid, Z.; Wilfred, C. D.; Gnanasundaram, N.; Arunagiri, A.; Murugesan, T.; J. Mol. Liq.
2018, 255, 492. The negative side of the profile showed that DPT was dominated by blue regions, which are hydrogen bond donors.1818 Man, M. S.; Abdullah, M. A. M.; Abdullah, S. B.; Yaacob, Z.; Indian J. Sci. Technol.
2017, 10, DOI 10.17485/ijst/2017/v10i6/111218.
https://doi.org/10.17485/ijst/2017/v10i6...
This s-profile shows the molecular polarization or interactions between the species.2020 Jaapar, S. Z. S.; Morad, N. A.; Iwai, Y.; J. Phys.: Conf. Ser.
2013, 423, DOI 10.1088/1742-6596/423/1/012066.
https://doi.org/10.1088/1742-6596/423/1/...
The COSMO-RS calculation was also supported by the absorption spectrum in Figure 2, showing that DPT in DMSO solvent was red-shifted due to DPT and acted as a hydrogen donor while DMSO acted as a hydrogen acceptor in the studied medium.
Molecular electrostatic potential (MEP)
The correlation coefficient of the optimized geometry showed good agreement between calculated and experimental results, as shown in the Supplementary Information(Figure S1). The MEP of DPT was then calculated to visualize the electron distribution in the compound, as shown in Figure 14. MEP visualization is widely used as a reactivity map displaying the electrophilic and nucleophilic attack regions and to identify the potential regions available for the interaction to occur.2121 Normaya, E.; Ahmad, M. N.; Farina, Y.; Bulat, K. H. K.; J. Braz. Chem. Soc. 2018, 29, 2197. As shown in the figure, the regions of the S1, N5 and N4 showed yellow region indicating the highest potential region for interaction with DPT-metal ion. There were also yellow regions around the phenyl rings due to the localization of electrons above and below the plane of the ring, making phenyl particularly stable.
Fukui function
The Fukui function is a method in quantum chemistry to determine which atom is susceptible to nucleophilic or electrophilic attack (fk+, fk-, fk0). The calculation is based on the following equations:2222 Parr, R. G.; Yang, W.; Density-Functional Theory of Atoms and Molecules, 1st ed.; Oxford University Press: New York, 1989.
where N, N – 1 and N + 1 are the total electrons present in the neutral, cationic and anionic states of the molecule, respectively. From the equations above, only the fk- was used to identify the atoms susceptible to electrophilic attack. The results are shown in Table 1.
The maximum value of the local descriptor susceptible to electrophilic attack was found to be S1 and N4 with values of 0.249 and 0.050, respectively (highlighted in bold). This is where the interaction is expected to occur, since S1 and N4 consist of high electron densities as compared to the other atoms in DPT. This allowed for the atoms to become nucleophilic and undergo a complex formation with the metal ion Cu2+.
HOMO-LUMO interactions
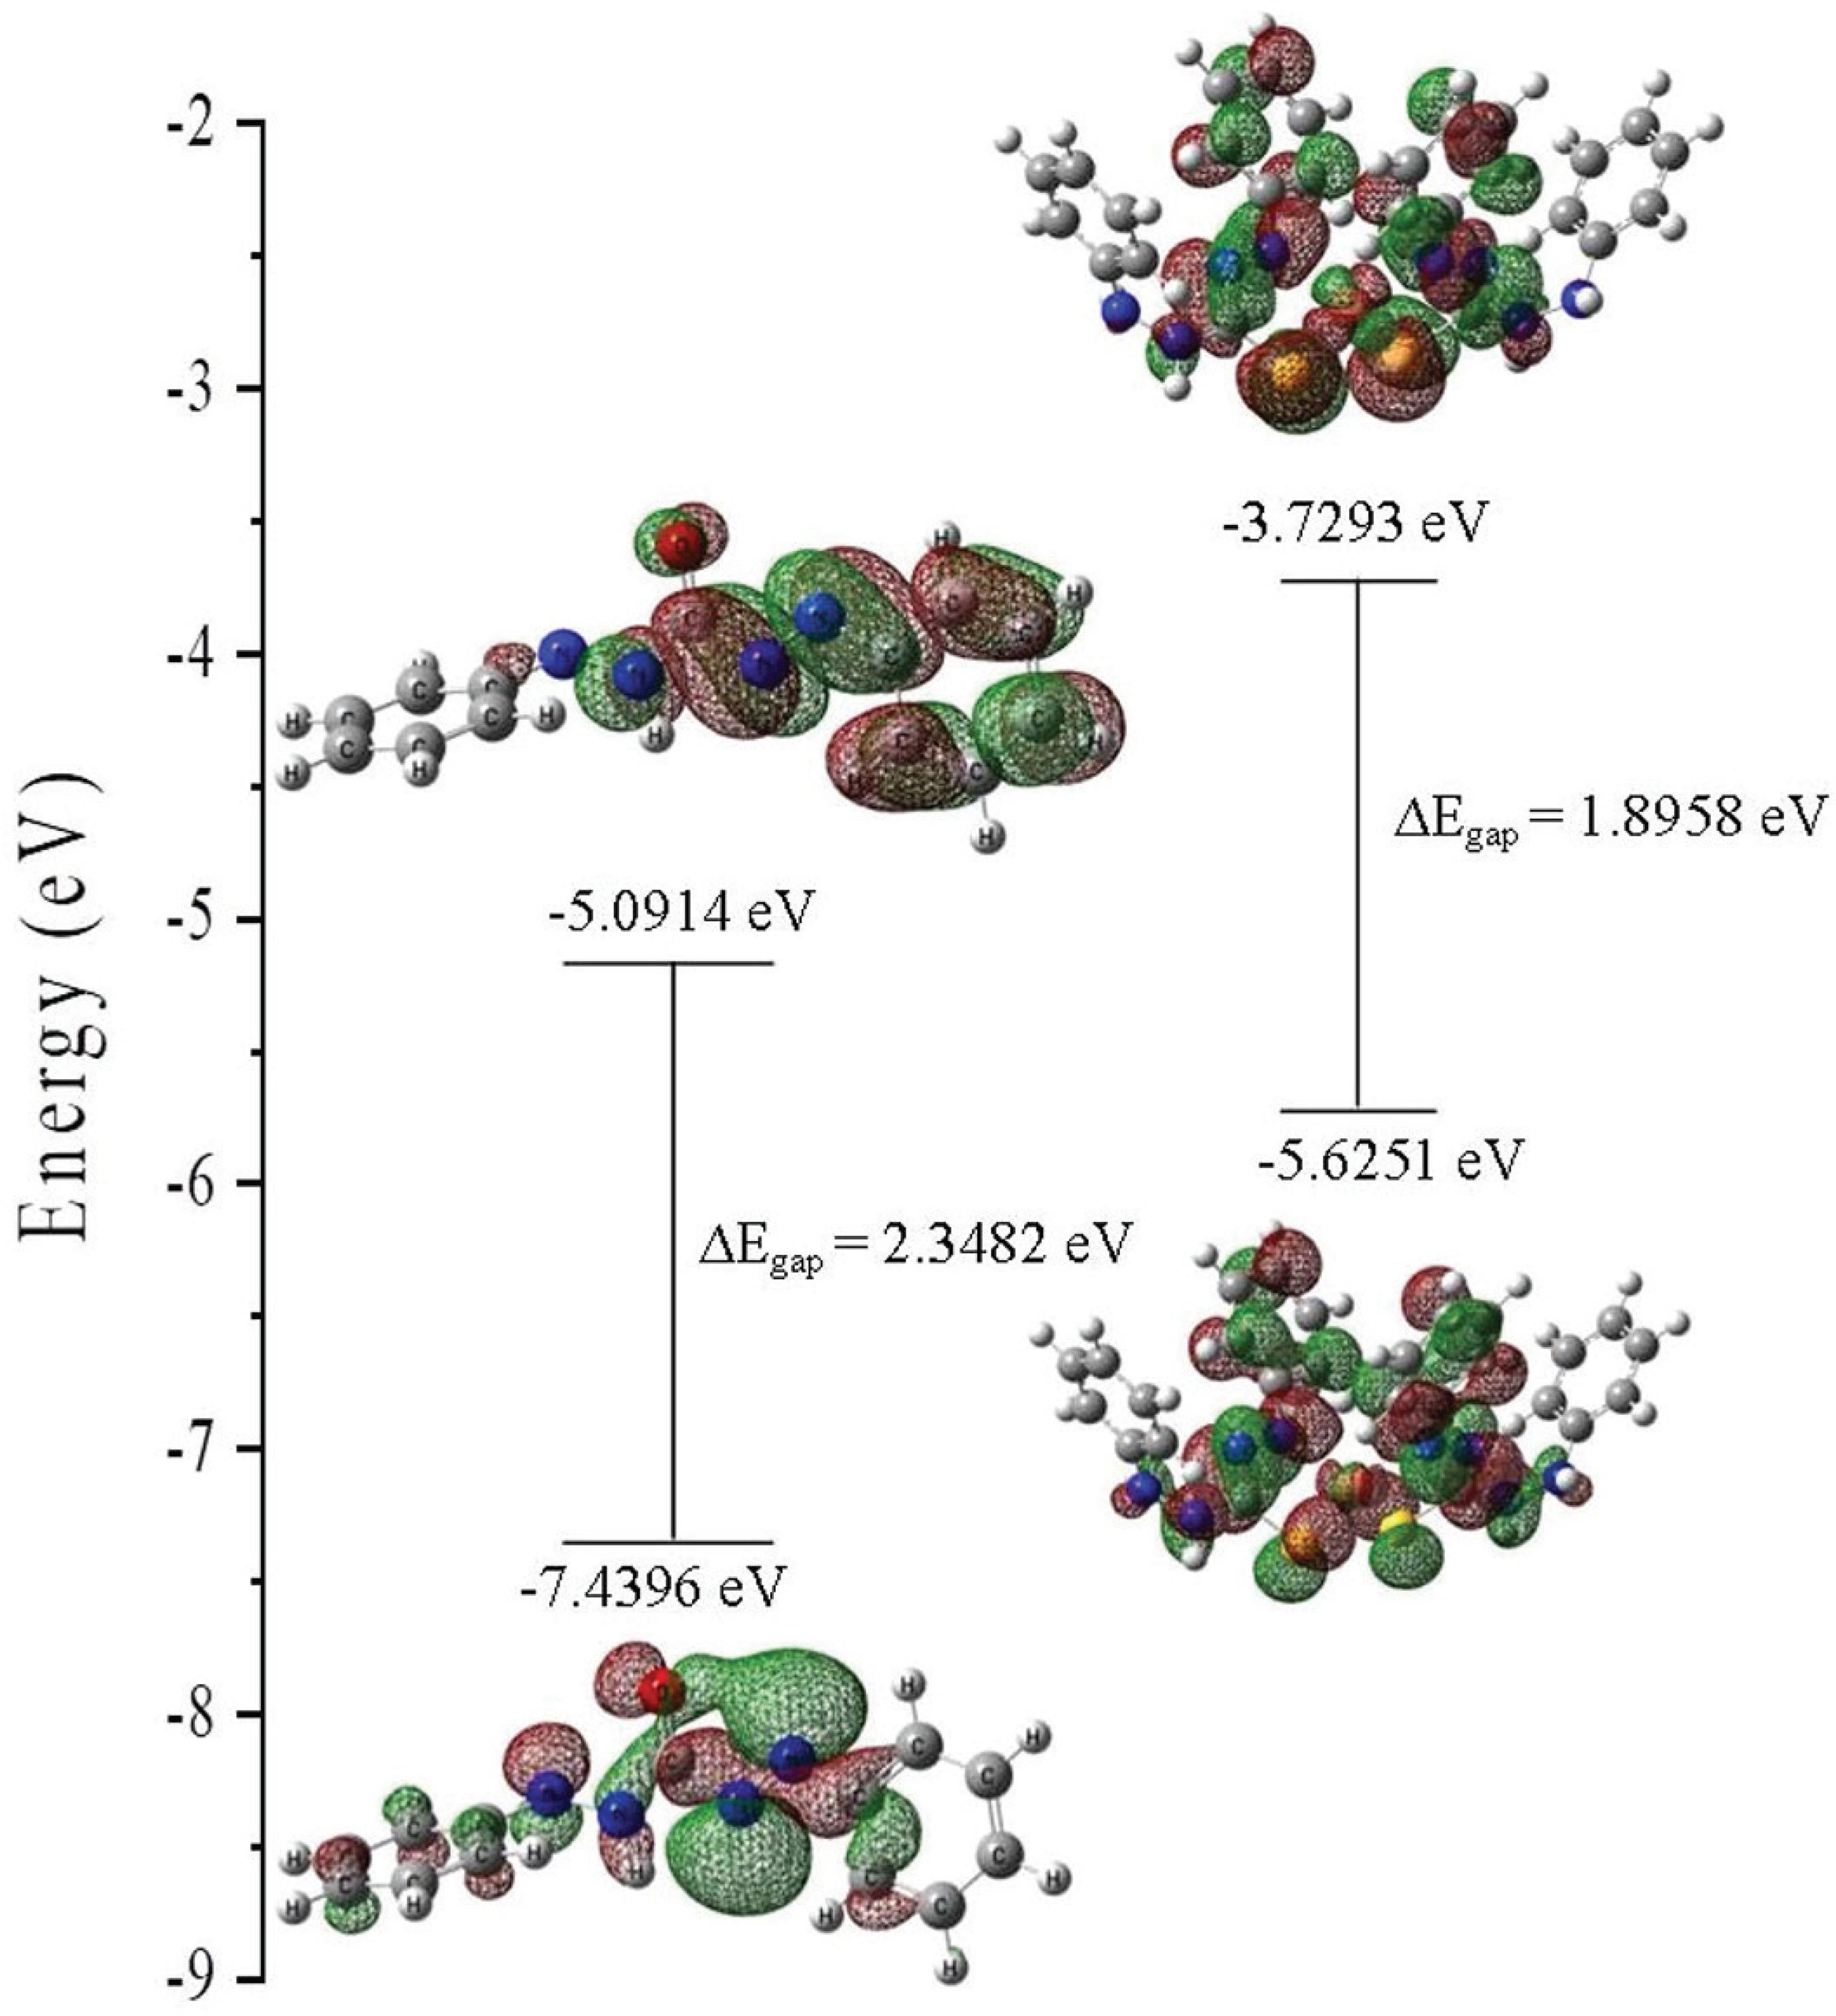
The MEP and Fukui function identified the region and the specific atom where the interaction occurred, thus HOMO-LUMO (highest occupied molecular orbital- lowest unoccupied molecular orbital) interactions were conducted to analyze the formation energy and stability of DPT and DPT-Cu complexes. The energy levels of HOMO and LUMO are important in order to describe the reaction between compounds. HOMO is the orbital that acts as an electron donor, while LUMO is the orbital that acts as the electron acceptor. The 3D plots of selected molecular orbitals and the energy gap of each electronic transition are shown in Figure 15. Based on the figure, the HOMO and LUMO orbital of both the DPT and its complex were localized over S1, N-N bond and azo groups. The DPT compound underwent n-π* transitions, according to the visualization shown in the figure, which is in agreement with the blue shift reported in the solution spectra of Figure 6.
The interaction model of DPT and Cu2+ was constructed based on the Job plot measurement with 2:1 binding stoichiometry of the complex. For the formation of the complex, the energy gap of the frontier molecular orbital is at -1.8958 eV. This lower band gap energy indicates an easier combination of DPT binding with Cu2+ ions.2323 Ding, X.; Zhang, F.; Bai, Y.; Zhao, J.; Chen, X.; Ge, M.; Sun, W.; Tetrahedron Lett. 2017, 58, 3868. The transition occurred due to the complex formation of DPT with Cu2+ ions and resulted in the formation of new peak in the UV-Vis absorption spectra. The formation energy produced by the DPT was -1113.79645660 a.u. , while the complex formation energy was calculated as -2435.71832681 a.u. The formation constant is a stability constant that measures the interaction between molecules during the formation of a complex. Generally, the energy will decrease during complex formation and the negative energy will result in the formation of a stable complex.2424 Qin, W.; Wang, J.; Xu, S.; Xie, Q.; Xu, Z.; Colloids Surf., A 2016, 490, 318. Thus, the higher negative energy produced in this study suggests that the DPT-Cu complex formed was thermodynamically stable.
Conclusions
In conclusion, the sensitivity optimization of DPT showed strong interaction with DMSO in a 9:1 (DMSO:water) ratio at a pH of 3. The sensor was selective for Cu2+ detection in aqueous solutions containing different metal ions. The detection limit of Cu2+ ion was as low as 6.08 µM. Job plots revealed that the sensor interacts with Cu2+ ions in the ratio of 2:1 stoichiometry. Computational calculations were used to support the binding mode proposed between DPT and Cu2+ ion. The application of the probe using test strips was analyzed using lake water sample and successfully recognized Cu2+ ions by the color change. The validation method was also done to prove that DPT successfully acts as an alternative chemosensor for Cu2+ ions detection in environmental water sample. The probe is more affordable, portable and user-friendly, and it can also be used without any special training.
Experimental
Materials and instruments
All the chemicals and reagents were purchased from Sigma-Aldrich (United States of America), QRec (New Zealand), R&M Chemicals (Malaysia), HmbG Chemicals (Germany) and Bendosen (Malaysia). Absorption spectra were recorded at room temperature using a PerkinElmer model Lambda 35 UV/Vis spectrometer.
Sensitivity metal sensing analysis
The 50 µM DPT was dissolved in four different polarity solvents: DMSO, DMF, acetonitrile and ethanol. The DPT 50 µM with the selected solvent was prepared with different solvent:co-solvent (water) ratios (9:1, 8:2, 7:3, 6:4, 5:5, 4:6, 3:7, 2:8 and 1:9). The pH of the medium of DPT-Cu was prepared by combining appropriate amounts of specific chemical solutions under a pH meter. The UV-Vis spectrum of sensitivity optimizations was recorded over a wavelength range of 200-700 nm.
Selectivity metal sensing analysis
Under optimized conditions, the selectivity of DPT against a series of metal ions was determined. Each of the following metal ions with 1, 5 and 10 equivalents were added into 50 µM of DPT in the optimized solution: Fe3+, Ag+, Cr3+, Pb2+, Cu2+, Mg2+, Cd2+, Zn2+, K+, Ni2+ and Co2+. The selectivity of DPT (50 µM) for Cu2+ (50 µM) in the presence of other metals ions was then observed. Tukey’s test was used to compare between the mean ± standard deviation using OriginPro software.2525 OriginPro, version 2018 OriginLab Corp., Northampton, USA, 2018.
Limit of detection
A titration method with variable Cu2+ concentration was conducted. Different concentrations of Cu2+ (1-100 µM) were added into the 50 µM of DPT under optimized conditions. A calibration curve of absorbance versus the concentration of Cu2+ was constructed. The results obtained were used to determine the limit of detection using equation 1.
Job plot
A series of solutions containing DPT (50 µM) and Cu2+ (50 µM) were prepared in such a manner that the sum of the total Cu2+ and DPT volume remained constant (5 mL). Job plots were constructed at selected wavelength.
Probe validation
The test strips were immersed into a solution under optimized conditions and then dried under a vacuum condition. The probe was tested using spiked environmental water sample. The water sample was obtained from the International Islamic University Malaysia, Kuantan Campus and was digested using previous method.2626 Abbasi, S.; Khani, H.; Tabaraki, R.; Food Chem. 2010, 123, 507. Tukey’s test was used to compare between the mean ± standard deviation using OriginPro software.2525 OriginPro, version 2018 OriginLab Corp., Northampton, USA, 2018. The result from UV-Vis analysis using DPT as a chemosensor was also compared with the ICP-MS by means of triplicate determination (n = 3) in order to determine the validity of the model. Results were considered statistically significant at p ≤ 0.05.
Computational method
Optimization of the title compound and the solvents was the first step toward predicting the thermodynamic properties using COSMO-RS. The geometries and the continuum solvation COSMO calculations of solvent molecular surface density and the titled compound were optimized using DFT calculations with Becke-Perdew-86 (BP86) functional and triple zeta valance potential (TZVP) basis sets. After geometric optimization, the COSMO files containing the ideal screening charges on the molecular surface were generated and used to create the sigma profile and the polarity of the titled compounds. All the quantum calculations above were carried out using the Amsterdam Density Functional (ADF) program package, version 2017.2727 Baerends, E. J.; Ziegler, T.; Atkins, A. J.; Autschbach, J.; Bashford, D.; Baseggio, O.; Bérces, A.; Bickelhaupt, F. M.; Bo, C.; Boerritger, P. M.; Cavallo, L.; Daul, C.; Chong, D. P.; Chulhai, D. V.; Deng, L.; Dickson, R. M.; Dieterich, J. M.; Ellis, D. E.; van Faassen, M.; Ghysels, A.; Giammona, A.; van Gisbergen, S. J. A.; Goez, A.; Götz, A. W.; Gusarov, S.; Harris, F. E.; van den Hoek, P.; Hu, Z.; Jacob, C. R.; Jacobsen, H.; Jensen, L.; Joubert, L.; Kaminski, J. W.; van Kessel, G.; König, C.; Kootstra, F.; Kovalenko, A.; Krykunov, M.; van Lenthe, E.; McCormack, D. A.; Michalak, A.; Mitoraj, M.; Morton, S. M.; Neugebauer, J.; Nicu, V. P.; Noodleman, L.; Osinga, V. P.; Patchkovskii, S.; Pavanello, M.; Peeples, C. A.; Philipsen, P. H. T.; Post, D.; Pye, C. C.; Ramanantoanina, H.; Ramos, P.; Ravenek, W.; Rodríguez, J. I.; Ros, P.; Rüger, R.; Schipper, P. R. T.; Schlüns, D.; van Schoot, H.; Schreckenbach, G.; Seldenthuis, J. S.; Seth, M.; Snijders, J. G.; Solà, M.; Stener, M.; Swart, M.; Swerhone, D.; te Velde, G.; Tognetti, V.; Vernooijs, P.; Versluis, L.; Visscher, L.; Visser, O.; Wang, F.; Wesolowski, T. A.; van Wezenbeek, E. M.; Wiesenekker, G.; Wolff, S. K.; Woo, T. K.; Yakovlev, A. L.; ADF2017; SCM, Theoretical Chemistry Department, Vrije Universiteit, Amsterdam, The Netherlands, 2017. Available at https://www.scm.com/product/adf/, accessed in April 2019.
https://www.scm.com/product/adf/...
The DFT/B3LYP at the 6-311++G(d,p) basis set level using Gaussian09 program2828 Frisch, M. J.; Trucks, G. W.; Schlegel, H. B.; Scuseria, G. E.; Robb, M. A.; Cheeseman, J. R.; Scalmani, G.; Barone, V.; Petersson, G. A.; Nakatsuji, H.; Li, X.; Caricato, M.; Marenich, A.; Bloino, J.; Janesko, B. G.; Gomperts, R.; Mennucci, B.; Hratchian, H. P.; Ortiz, J. V.; Izmaylov, A. F.; Sonnenberg, J. L.; Williams-Young, D.; Ding, F.; Lipparini, F.; Egidi, F.; Goings, J.; Peng, B.; Petrone, A.; Henderson, T.; Ranasinghe, D.; Zakrzewski, V. G.; Gao, J.; Rega, N.; Zheng, G.; Liang, W.; Hada, M.; Ehara, M.; Toyota, K.; Fukuda, R.; Hasegawa, J.; Ishida, M.; Nakajima, T.; Honda, Y.; Kitao, O.; Nakai, H.; Vreven, T.; Throssell, K.; Montgomery Jr. , J. A.; Peralta, J. E.; Ogliaro, F.; Bearpark, M.; Heyd, J. J.; Brothers, E.; Kudin, K. N.; Staroverov, V. N.; Keith, T.; Kobayashi, R.; Normand, J.; Raghavachari, K.; Rendell, A.; Burant, J. C.; Iyengar, J.; Tomasi, S. S.; Cossi, M.; Millam, J. M.; Klene, M.; Adamo, C.; Cammi, R.; Ochterski, J. W.; Martin, R. L.; Morokuma, K.; Farkas, O.; Foresman, J. B.; Fox, D. J.; Gaussian 09, Revision E.01; Gaussian, Inc., Wallingford, 2009. was adopted to optimize geometrical parameters in the solution phase using the polarizable continuum model (PCM).1414 Sarkar, D.; Pramanik, A. K.; Mondal, T. K.; Spectrochim. Acta, Part A
2016, 153, 397. The 6-311++G (d,p) was chosen in order to obtain a suitable description of the polar bonds of the title compound. The d and p polarization functions on heavy atoms and hydrogen atoms were used, respectively. The most stable conformation (lowest total energy) was from the final optimization calculation for all theoretical considerations, including the MEP, Fukui function and HOMO-LUMO energy calculations. The GaussView 5.0 program2929 Dennington, R.; Keith, T. A.; Millam, J. M.; GaussView 5.0; Semichem Inc. , Shawnee Mission, KS, 2016. was used to construct the optimized molecular geometry, MEP, HOMO and LUMO electron distributions and the HOMO-LUMO energy gap.
-
Supplementary InformationSupplementary information is available free of charge at http://jbcs.sbq.org.br as PDF file.
Acknowledgments
The authors are thankful to the International Islamic University Malaysia and the Ministry of Higher Education, Malaysia, for supporting this research through the FRGS15-205-0446 and RIGS15-133-0133 grants. We also thank Dr Asnor Azrin Sabuti and Mr Abdul Halim Ihsan for their assistance in using ICP-MS instrument.
References
-
1Osredkar, J.; Sustar, N.; J. Clin. Toxicol. 2011, S3, 001.
-
2Hedera, P.; Fink, J. K.; Bockenstedt, P. L.; Brewer, G. J.; Arch. Neurol. 2003, 60, 1303.
-
3Gaetke, L. M.; Chow, C. K.; Toxicology 2003, 189, 147.
-
4Nor, Y. M.; Environ. Res. 1987, 43, 274.
-
5Orojloo, M.; Amani, S.; Talanta 2018, 186, 584.
-
6Jang, H. J.; Ahn, H. M.; Kim, M. S.; Kim, C.; Tetrahedron 2017, 73, 6624.
-
7Wasukan, N.; Srisung, S.; Kuno, M.; Kulthong, K.; Maniratanachote, R.; Spectrochim. Acta, Part A 2015, 149, 830.
-
8Pavia, D. L.; Lampman, G. M.; Kriz, G. S.; Vyvyan, J. R.; Introduction to Spectroscopy, 4th ed.; Brooks/Cole: Belmont, 2010.
-
9Wen, X.; Fan, Z.; Sens. Actuators, B 2017, 247, 655.
-
10Li, Y.; Shi, W.; Ma, J.; Wang, X.; Kong, X.; Zhang, Y.; Feng, L.; Hui, Y.; Xie, Z.; J. Photochem. Photobiol., A 2017, 338, 1.
-
11Bendix, G. H.; Grabenstetter, D.; Ind. Eng. Chem. 1943, 15, 649.
-
12Irving, B. H.; Cooke, S. J. H.; Woodger, S. C.; Williams, R. J. P.; J. Chem. Soc. 1949, 395, 1847.
-
13Armbruster, D. A.; Pry, T.; Clin. Biochem. Rev. 2008, 29, S49.
-
14Sarkar, D.; Pramanik, A. K.; Mondal, T. K.; Spectrochim. Acta, Part A 2016, 153, 397.
-
15PerkinElmer; Atomic Spectroscopy: A Guide to Selecting the Appropriate Technique and System; PerkinElmer: Waltham, 2008. Available at https://www.perkinelmer.com/Content/relatedmaterials/brochures/bro_worldleaderaaicpmsicpms.pdf, accessed in April 2019.
» https://www.perkinelmer.com/Content/relatedmaterials/brochures/bro_worldleaderaaicpmsicpms.pdf -
16Likussar, W.; Boltz, D. F.; Anal. Chem. 1971, 43, 1265.
-
17Roy, S.; Jaidann, M.; Ringuette, S.; Lussier, L. S.; Abou-Rachid, H.; Procedia Comput. Sci. 2010, 1, 1203.
-
18Man, M. S.; Abdullah, M. A. M.; Abdullah, S. B.; Yaacob, Z.; Indian J. Sci. Technol. 2017, 10, DOI 10.17485/ijst/2017/v10i6/111218.
» https://doi.org/10.17485/ijst/2017/v10i6/111218 -
19Rashid, Z.; Wilfred, C. D.; Gnanasundaram, N.; Arunagiri, A.; Murugesan, T.; J. Mol. Liq. 2018, 255, 492.
-
20Jaapar, S. Z. S.; Morad, N. A.; Iwai, Y.; J. Phys.: Conf. Ser. 2013, 423, DOI 10.1088/1742-6596/423/1/012066.
» https://doi.org/10.1088/1742-6596/423/1/012066 -
21Normaya, E.; Ahmad, M. N.; Farina, Y.; Bulat, K. H. K.; J. Braz. Chem. Soc. 2018, 29, 2197.
-
22Parr, R. G.; Yang, W.; Density-Functional Theory of Atoms and Molecules, 1st ed.; Oxford University Press: New York, 1989.
-
23Ding, X.; Zhang, F.; Bai, Y.; Zhao, J.; Chen, X.; Ge, M.; Sun, W.; Tetrahedron Lett. 2017, 58, 3868.
-
24Qin, W.; Wang, J.; Xu, S.; Xie, Q.; Xu, Z.; Colloids Surf., A 2016, 490, 318.
-
25OriginPro, version 2018 OriginLab Corp., Northampton, USA, 2018.
-
26Abbasi, S.; Khani, H.; Tabaraki, R.; Food Chem. 2010, 123, 507.
-
27Baerends, E. J.; Ziegler, T.; Atkins, A. J.; Autschbach, J.; Bashford, D.; Baseggio, O.; Bérces, A.; Bickelhaupt, F. M.; Bo, C.; Boerritger, P. M.; Cavallo, L.; Daul, C.; Chong, D. P.; Chulhai, D. V.; Deng, L.; Dickson, R. M.; Dieterich, J. M.; Ellis, D. E.; van Faassen, M.; Ghysels, A.; Giammona, A.; van Gisbergen, S. J. A.; Goez, A.; Götz, A. W.; Gusarov, S.; Harris, F. E.; van den Hoek, P.; Hu, Z.; Jacob, C. R.; Jacobsen, H.; Jensen, L.; Joubert, L.; Kaminski, J. W.; van Kessel, G.; König, C.; Kootstra, F.; Kovalenko, A.; Krykunov, M.; van Lenthe, E.; McCormack, D. A.; Michalak, A.; Mitoraj, M.; Morton, S. M.; Neugebauer, J.; Nicu, V. P.; Noodleman, L.; Osinga, V. P.; Patchkovskii, S.; Pavanello, M.; Peeples, C. A.; Philipsen, P. H. T.; Post, D.; Pye, C. C.; Ramanantoanina, H.; Ramos, P.; Ravenek, W.; Rodríguez, J. I.; Ros, P.; Rüger, R.; Schipper, P. R. T.; Schlüns, D.; van Schoot, H.; Schreckenbach, G.; Seldenthuis, J. S.; Seth, M.; Snijders, J. G.; Solà, M.; Stener, M.; Swart, M.; Swerhone, D.; te Velde, G.; Tognetti, V.; Vernooijs, P.; Versluis, L.; Visscher, L.; Visser, O.; Wang, F.; Wesolowski, T. A.; van Wezenbeek, E. M.; Wiesenekker, G.; Wolff, S. K.; Woo, T. K.; Yakovlev, A. L.; ADF2017; SCM, Theoretical Chemistry Department, Vrije Universiteit, Amsterdam, The Netherlands, 2017. Available at https://www.scm.com/product/adf/, accessed in April 2019.
» https://www.scm.com/product/adf/ -
28Frisch, M. J.; Trucks, G. W.; Schlegel, H. B.; Scuseria, G. E.; Robb, M. A.; Cheeseman, J. R.; Scalmani, G.; Barone, V.; Petersson, G. A.; Nakatsuji, H.; Li, X.; Caricato, M.; Marenich, A.; Bloino, J.; Janesko, B. G.; Gomperts, R.; Mennucci, B.; Hratchian, H. P.; Ortiz, J. V.; Izmaylov, A. F.; Sonnenberg, J. L.; Williams-Young, D.; Ding, F.; Lipparini, F.; Egidi, F.; Goings, J.; Peng, B.; Petrone, A.; Henderson, T.; Ranasinghe, D.; Zakrzewski, V. G.; Gao, J.; Rega, N.; Zheng, G.; Liang, W.; Hada, M.; Ehara, M.; Toyota, K.; Fukuda, R.; Hasegawa, J.; Ishida, M.; Nakajima, T.; Honda, Y.; Kitao, O.; Nakai, H.; Vreven, T.; Throssell, K.; Montgomery Jr. , J. A.; Peralta, J. E.; Ogliaro, F.; Bearpark, M.; Heyd, J. J.; Brothers, E.; Kudin, K. N.; Staroverov, V. N.; Keith, T.; Kobayashi, R.; Normand, J.; Raghavachari, K.; Rendell, A.; Burant, J. C.; Iyengar, J.; Tomasi, S. S.; Cossi, M.; Millam, J. M.; Klene, M.; Adamo, C.; Cammi, R.; Ochterski, J. W.; Martin, R. L.; Morokuma, K.; Farkas, O.; Foresman, J. B.; Fox, D. J.; Gaussian 09, Revision E.01; Gaussian, Inc., Wallingford, 2009.
-
29Dennington, R.; Keith, T. A.; Millam, J. M.; GaussView 5.0; Semichem Inc. , Shawnee Mission, KS, 2016.
Data availability
Publication Dates
-
Publication in this collection
16 Sept 2019 -
Date of issue
Sept 2019
History
-
Received
11 Oct 2018 -
Accepted
15 May 2019