Abstract
2,4-Dichlorophenoxyacetic acid (2,4-D) has been one of the main herbicides used to control weeds, however, due to its high use it can promote episodes of environmental contamination. Therefore, this study aimed to optimize and validate the liquid-liquid extraction with low-temperature partition (LLE-LTP) and the quick, easy, cheap, effective, rugged, and safe (QuEChERS) methods for determining 2,4-D in water samples by high performance liquid chromatography with diode array detector. The recovery percentages of the two methodologies were close to 100 ± 3%, and the limits of quantification were 2.0 and 3.1 µg L-1 for LLE-LTP and QuEChERS, respectively. The methodologies were selective and presented linearity from 2.0-26.0 and 3.1-40.6 µg L-1 for LLE-LTP and QuEChERS, respectively. The LLE-LTP was better than QuEChERS due to a smaller number of steps, lower reagent consumption, higher concentration factor and a lower limit of quantification. The real samples did not reveal any environmental contamination episodes by 2,4-D.
Keywords:
2,4-dichlorophenoxyacetic acid; herbicide; HPLC-DAD; LLE-LTP; QuEChERS; partition at low temperature
Introduction
2,4-Dichlorophenoxyacetic acid (2,4-D) is one of the most widely used herbicides in the world due to its low cost, selectivity, easy availability and broad spectrum of weed control. 11 Jaafarzadeh, N. ; Ghanbari, F. ; Ahmadi, M. ; Chem. Eng. J.
2017, 320, 436.,22 Islam, F. ; Wang, J. ; Farooq, M. A. ; Khan, M. S. S. ; Xu, L. ; Zhu, J. ; Zhao, M. ; Muños, S. ; Li, Q. X. ; Zhou, W. ; Environ. Int.
2018, 111, 332. 2,4-D has been widely used as a pre- and post-emergence systemic herbicide to control broadleaf weeds. 33 de Arcaute, C. R. ; Soloneski, S. ; Larramendy, M. L. ; Ecotoxicol. Environ. Saf.
2016, 128, 222. This herbicide is registered by the National Health Surveillance Agency (ANVISA)44 https://portal.anvisa.gov.br/documents/111215/117782/D27%2B%2B24-D.pdf/8548d5b3-f306-49df-ac49-4498bc5768d8, accessed in May 2020.
https://portal.anvisa.gov.br/documents/1...
in Brazil for agricultural use on several crops and also for non-agricultural activity, as well as chemical weeding in non-agricultural areas. 44 https://portal.anvisa.gov.br/documents/111215/117782/D27%2B%2B24-D.pdf/8548d5b3-f306-49df-ac49-4498bc5768d8, accessed in May 2020.
https://portal.anvisa.gov.br/documents/1...
It is poorly retained by most soils and has high water solubility. 55 Njoku, V. O. ; Islam, Md. A. ; Asif, M. ; Hameed, B. H. ; J. Environ. Manage.
2015, 154, 138.,66 Souza, F. L. ; Sáez, C. ; Lanza, M. R. V. ; Cañizares, P. ; Rodrigo, M. A. ; Sep. Purif. Technol.
2017, 178, 147. Several studies77 Salvatierra-stamp, V. ; Muñiz-Valencia, R. ; Jurado, J. M. ; Ceballos-Magaña, S. G. ; Microchem. J.
2018, 140, 87.,88 Ji, Z. ; Cheng, J. ; Song, C. ; Hu, N. ; Zhou, W. ; Suo, Y. ; Sun, Z. ; You, J. ; Talanta
2019, 191, 313. have shown the presence of 2,4-D in water resources, which may pose risks to human health and the environment. 99 Cai, J. ; Zhou, M. ; Yang, W. ; Pan, Y. ; Lu, X. ; Serrano, K. G. ; Chemosphere
2018, 212, 784.
The national and international regulatory agencies have established the maximum residue limit (MRL) allowed for 2,4-D in drinking water. The Ministry of Health in Brazil1010 Ministério da Saúde; Portaria de Consolidação No. 5, de 28 de setembro de 2017; Consolidação das Normas sobre as Ações e os Serviços de Saúde do Sistema Único de Saúde; Brasília, 2017. Available at http://bvsms.saude.gov.br/bvs/saudelegis/gm/2017/prc0005_03_10_2017.html, accessed in May 2020.
http://bvsms.saude.gov.br/bvs/saudelegis...
passed the Consolidated Resolution No. 5 of 2017 which established the MRL limit of 30.0 µg L-1. Moreover, the World Health Organization (WHO)1111 World Health Organization (WHO); Guidelines for Drinking-Water Quality, 4th edition; WHO Press: Geneva, Switzerland, 2011. Available at https://www.who.int/water_sanitation_health/publications/2011/dwq_guidelines/en/, accessed in May 2020.
https://www.who.int/water_sanitation_hea...
and the United States Environmental Protection Agency (USEPA)1212 https://www.epa.gov/ground-water-and-drinking-water/national-primary-drinking-water-regulations, accessed in May 2020.
https://www.epa.gov/ground-water-and-dri...
set the MRL at 30.0 and 70.0 µg L-1, respectively.
2,4-D belongs to the chemical group of phenoxyalkanoic acid, and it is classified as an extremely toxic product by ANVISA,44 https://portal.anvisa.gov.br/documents/111215/117782/D27%2B%2B24-D.pdf/8548d5b3-f306-49df-ac49-4498bc5768d8, accessed in May 2020.
https://portal.anvisa.gov.br/documents/1...
moderately toxic by WHO,1313 World Health Organization (WHO); The WHO Recommended Classification of Pesticides by Hazard and Guidelines to Classification 2009; WHO Press: Geneva, Switzerland, 2010. Available at https://apps.who.int/iris/bitstream/handle/10665/44271/9789241547963_eng.pdf?sequence=1&isAllowed=y, accessed in May 2020.
https://apps.who.int/iris/bitstream/hand...
and slightly to moderately toxic by USEPA. 1414 U.S. Environmental Protection Agency (USEPA); EPA 738-R-05-002: Reregistration Eligibility Decision for 2,4-D; USEPA, Office of Prevention, Pesticides and Toxic Substances, Office of Pesticide Programs, U.S. Government Printing Office: Washington, DC, 2005. Available at https://archive.epa.gov/pesticides/reregistration/web/pdf/24d_red.pdf, accessed in May 2020.
https://archive.epa.gov/pesticides/rereg...
The International Agency for Research on Cancer (IARC)1515 Loomis, D. ; Guyton, K. ; Grosse, Y. ; El Ghissasi, F. ; Bouvard, V. ; Benbrahim-Tallaa, L. ; Guha, N. ; Mattock, H. ; Straif, K. ; Lancet Oncol.
2015, 16, 891. classified 2,4-D as a possibly carcinogenic product for humans in 2015.
Therefore, several extraction methods have been applied to monitor this herbicide in water, such as solid phase extraction (SPE),1616 Chávez-Moreno, C. A. ; Guzmán-Mar, J. L. ; Hinojosa-Reyes, L. ; Hernández-Ramírez, A. ; Ferrer, L. ; Cerdà, V. ; Anal. Bioanal. Chem. 2012, 403, 2705.,1717 Raks, V. A. ; Turchin, V. A. ; Zaitsev, V. N. ; J. Water Chem. Technol. 2015, 37, 295. liquid-liquid extraction (LLE),1818 Tran, A. T. K. ; Hyne, R. V. ; Doble, P. ; Chemosphere 2007, 67, 944.,1919 Wen, Y. ; Yu, C. ; Zhang, J. ; Zhu, C. ; Li, X. ; Zhang, T. ; Niu, Z. ; Int. J. Adv. Res. Chem. Sci. 2015, 2, 8. dispersive liquid-liquid microextraction (DLLME)2020 Caldas, S. S. ; Rombaldi, C. ; Arias, J. L. O. ; Marube, L. C. ; Primel, E. G. ; Talanta 2016, 146, 676.,2121 Ebrahimi, R. ; Feizbakhsh, A. ; Es’haghi, A. ; Chromatographia 2016, 79, 515. and magnetic solid phase extraction (MSPE). 2222 Shahrebabak, S. M. ; Saber-Tehrani, M. ; Faraji, M. ; Shabanian, M. ; Aberoomand-Azar, P. ; Microchem. J. 2019, 146, 630. SPE and LLE methodologies have been widely used for extracting pesticides in aqueous samples, including 2,4-D, due to efficiency, pre-concentration of the analytes, and reduced limits of quantification. Therefore, they have been accepted as reference methodologies. 2323 Paula, C. ; Jurisch, M. ; Piccin, E. ; Augusti, R. ; Drug Test. Anal. 2018, 10, 1348.,2424 Perestrelo, R. ; Silva, P. ; Porto-Figueira, P. ; Pereira, J. A. M. ; Silva, C. ; Medina, S. ; Câmara, J. S. ; Anal. Chim. Acta 2019, 1070, 1.
In addition to these methods, the liquid-liquid extraction with low-temperature partition (LLE-LTP) and the quick, easy, cheap, effective, rugged, and safe (QuEChERS) methodologies have been used for pesticide extraction in aqueous samples. These two methods have been considered simpler and more accessible in relation to SPE and LLE due to the reduced consumption of organic solvents and sample, in addition to not requiring cartridges, glassware or special equipment. 2323 Paula, C. ; Jurisch, M. ; Piccin, E. ; Augusti, R. ; Drug Test. Anal. 2018, 10, 1348.,2424 Perestrelo, R. ; Silva, P. ; Porto-Figueira, P. ; Pereira, J. A. M. ; Silva, C. ; Medina, S. ; Câmara, J. S. ; Anal. Chim. Acta 2019, 1070, 1. Despite these advantages, no studies using LLE-LTP and QuEChERS for the extraction of 2,4-D in water samples have been completed so far.
The quantification of 2,4-D has been performed by analytical techniques, including gas chromatography coupled with mass spectrometry detection (GC-MS),2121 Ebrahimi, R. ; Feizbakhsh, A. ; Es’haghi, A. ; Chromatographia 2016, 79, 515.,2525 Carver, Z. A. ; Han, A. A. ; Timchalk, C. ; Weber, T. J. ; Tyrrell, K. J. ; Sontag, R. L. ; Luders, T. ; Chrisler, W. B. ; Weitz, K. K. ; Smith, J. N. ; Toxicology 2018, 410, 171. and liquid chromatography coupled with different detectors such as mass spectrometry (LC-MS/MS),77 Salvatierra-stamp, V. ; Muñiz-Valencia, R. ; Jurado, J. M. ; Ceballos-Magaña, S. G. ; Microchem. J. 2018, 140, 87.,2020 Caldas, S. S. ; Rombaldi, C. ; Arias, J. L. O. ; Marube, L. C. ; Primel, E. G. ; Talanta 2016, 146, 676.,2626 Sack, C. ; Vonderbrink, J. ; Smoker, M. ; Smith, R. E. ; J. Agric. Food Chem. 2015, 63, 9657. ultraviolet (HPLC-UV),11 Jaafarzadeh, N. ; Ghanbari, F. ; Ahmadi, M. ; Chem. Eng. J. 2017, 320, 436.,77 Salvatierra-stamp, V. ; Muñiz-Valencia, R. ; Jurado, J. M. ; Ceballos-Magaña, S. G. ; Microchem. J. 2018, 140, 87.,99 Cai, J. ; Zhou, M. ; Yang, W. ; Pan, Y. ; Lu, X. ; Serrano, K. G. ; Chemosphere 2018, 212, 784. fluorescence (HPLC-FD)2727 Dickow, L. M. ; Gerken, D. F. ; Sams, R. A. ; Ashcraft, S. M. ; J. Anal. Toxicol. 2001, 25, 35. and diode array (HPLC-DAD). 2828 D’Archivio, A. A. ; Fanelli, M. ; Mazzeo, P. ; Ruggieri, F. ; Talanta 2007, 71, 25.,2929 Coelho, E. R. C. ; Leal, W. P. ; de Souza, K. B. ; do Rozário, A. ; Antunes, P. W. P. ; Eng. Sanit. Ambient. 2018, 23, 1043. Analysis of 2,4-D by gas chromatography requires a prior derivatization step, which can increase the time and cost of analysis. 3030 Yang, F. ; Bian, Z. ; Chen, X. ; Liu, S. S. ; Liu, Y. ; Tang, G. ; J. AOAC Int. 2013, 96, 1134.,3131 Behbahani, M. ; Najafi, F. ; Bagheri, S. ; Bojdi, M. K. ; Hassanlou, P. G. ; Bagheri, A; Environ. Monit. Assess. 2014, 186, 2609. Therefore, liquid chromatography has been considered the most appropriate technique for determining this compound. 2929 Coelho, E. R. C. ; Leal, W. P. ; de Souza, K. B. ; do Rozário, A. ; Antunes, P. W. P. ; Eng. Sanit. Ambient. 2018, 23, 1043.,3131 Behbahani, M. ; Najafi, F. ; Bagheri, S. ; Bojdi, M. K. ; Hassanlou, P. G. ; Bagheri, A; Environ. Monit. Assess. 2014, 186, 2609.
Thus, the objective of this study was to optimize and validate the LLE-LTP and QuEChERS methodologies with HPLC-DAD for determining 2,4-D in water samples.
Experimental
Reagents and solutions
The 2,4-D analytical standard with 99.9% (m/m) purity was obtained from Sigma-Aldrich (St. Louis, MO, USA). Grade-HPLC solvents acetonitrile, acetic acid and ethyl acetate were purchased from J.T. Baker (Phillipsburg, NJ, USA), Dinâmica (Diadema, SP, Brazil) and Vetec (Rio de Janeiro, RJ, Brazil), respectively. Phosphoric acid (H3PO4) was obtained from Vetec (Rio de Janeiro, RJ, Brazil). Anhydrous sodium sulfate (Na2SO4) and sodium chloride (NaCl) were obtained from Vetec (Rio de Janeiro, RJ, Brazil) and magnesium sulfate (MgSO4) from Synth (Diadema, SP, Brazil), both with a purity higher than 99.0% (m/m). The 2,4-D stock and working solutions were prepared in acetonitrile at concentrations of 20.0 and 2.00 mg L-1, respectively.
Equipment
Sample preparation was performed using an analytical balance from Shimadzu (São Paulo, SP, Brazil), a centrifuge from Kindly (São Paulo, SP, Brazil), a pH meter from Quimis (São Paulo, SP, Brazil), a vacuum pump from Prismatec (Itu, SP, Brazil) and a vortex from Scilogex (Rocky Hill, NJ, USA).
Chromatographic analysis
The obtained extracts were analyzed using a high performance liquid chromatograph coupled with a diode array detector (HPLC-DAD, model 1290, Agilent Technologies, Germany) equipped with an auto-sampler and quaternary pump. A Kinetex C18 100A reverse phase analytical column (150 × 4.60 mm, 5 µm, Phenomenex, Milford, MA, USA) was used for separating 2,4-D. The temperature of the analytical column was maintained at 30 ºC and the sample injection volume was 20 µL. The mobile phase composition, wavelength and flow were optimized, as shown in Table 1.
LLE-LTP
The following three extraction phase compositions were evaluated to optimize the LLE-LTP extraction methodology: 8.00 mL acetonitrile, 8.00 mL acetonitrile/ethyl acetate (6.50/1.50 mL) and 8.00 mL acetonitrile acidified with 1% (v/v) acetic acid.
In the LLE-LTP procedure, 4.00 mL of the water sample was added to 22 mL clear glass vial, fortified with 81.0 µL of the 2,4-D working solution at a concentration of 2.00 mg L-1 and kept at rest for 1 h. Next, 8.00 mL of the extraction phase was added to the flask and homogenized in a vortex for 1 min. The system was kept at -20 ºC for 1 h for complete freezing of the aqueous phase and consequent phase separation. The liquid organic phase was subsequently transferred to a 15 mL polypropylene tube containing 0.375 g of anhydrous Na2SO4, shaken in a vortex for 1 min and centrifuged at 4000 rpm for 5 min. Then, 5.00 mL of the obtained extract was completely evaporated using continuous air flow and resuspended in 400 µL of acetonitrile. Lastly, the extract was filtered through a 0.45 µm nylon membrane, transferred to a vial and analyzed by HPLC-DAD.
QuEChERS
The following three extraction phase compositions were evaluated to optimize the QuEChERS methodology: 5.00 mL of acetonitrile, 5.00 mL of acetonitrile/ethyl acetate (4.00/1.00 mL) and 5.00 mL of acetonitrile acidified with 1% (v/v) acetic acid.
In the QuEChERS procedure, 5.00 mL of the water sample was added to a 50 mL polypropylene tube and fortified with 85.0 µL of the 2,4-D working solution at a concentration of 2.00 mg L-1 and kept at rest for 1 h. Next, 5.00 mL of the extraction phase was added, and the system homogenized in a vortex for 1 min. Then, 2.00 g of anhydrous MgSO4 and 0.500 g of NaCl were added. The mixture was put in the vortex and shaken immediately for 1 min and centrifuged at 4000 rpm for 5 min. The supernatant was transferred to a 15.0 mL polypropylene tube containing 1.00 g of anhydrous MgSO4. The mixture was shaken for 1 min in a vortex and centrifuged at 4000 rpm for 5 min, and 3.20 mL of the obtained extract was completely evaporated using continuous air flow and resuspended in 400 µL of acetonitrile. The obtained sample was filtered through a 0.45 µm nylon membrane, transferred to a vial and analyzed by HPLC-DAD.
Validating the methodologies
After the optimization, LLE-LTP and QuEChERS methodologies were validated in terms of selectivity, limit of quantification (LOQ), precision and accuracy, linearity and matrix effect. 3232 SANTE/11813/2017: Guidance Document on Analytical Quality Control and Method Validation Procedures for Pesticide Residues and Analysis in Food and Feed; European Commission, 2018. Available at: https://ec.europa.eu/food/sites/food/files/plant/docs/pesticides_mrl_guidelines_wrkdoc_2017-11813.pdf, accessed in May 2020.
https://ec.europa.eu/food/sites/food/fil...
Selectivity
Selectivity was determined by a comparative analysis between the chromatograms of the analyte-free sample (blank) and the fortified matrix extracts, checking for the presence of signals of interferents at the same retention time of 2,4-D. 3232 SANTE/11813/2017: Guidance Document on Analytical Quality Control and Method Validation Procedures for Pesticide Residues and Analysis in Food and Feed; European Commission, 2018. Available at: https://ec.europa.eu/food/sites/food/files/plant/docs/pesticides_mrl_guidelines_wrkdoc_2017-11813.pdf, accessed in May 2020.
https://ec.europa.eu/food/sites/food/fil...
Limit of quantification
LOQ was evaluated by fortifying samples with minimum concentrations of 2,4-D that can be quantified with precision and accuracy. 3232 SANTE/11813/2017: Guidance Document on Analytical Quality Control and Method Validation Procedures for Pesticide Residues and Analysis in Food and Feed; European Commission, 2018. Available at: https://ec.europa.eu/food/sites/food/files/plant/docs/pesticides_mrl_guidelines_wrkdoc_2017-11813.pdf, accessed in May 2020.
https://ec.europa.eu/food/sites/food/fil...
The LOQ was obtained considering the concentration that produced a signal 10 times higher than the baseline noise of the analyte-free samples (blank), at the same analyte retention time.
Precision and accuracy
Precision and accuracy were assessed through fortification/recovery experiments. The matrix was fortified at three concentration levels: 2.0, 11.6 and 21.2 µg L-1 for LLE-LTP, and 3.1, 18.1 and 33.1 µg L-1 for QuEChERS. Precision was analyzed in seven repetitions at the second level, assessing the relative standard deviation (RSD) obtained, with RSD ≤ 20% considered as the acceptability level. 3232 SANTE/11813/2017: Guidance Document on Analytical Quality Control and Method Validation Procedures for Pesticide Residues and Analysis in Food and Feed; European Commission, 2018. Available at: https://ec.europa.eu/food/sites/food/files/plant/docs/pesticides_mrl_guidelines_wrkdoc_2017-11813.pdf, accessed in May 2020.
https://ec.europa.eu/food/sites/food/fil...
Accuracy was assessed in three repetitions for first and third levels, and recovery values between 70 and 120% were considered acceptable. 3232 SANTE/11813/2017: Guidance Document on Analytical Quality Control and Method Validation Procedures for Pesticide Residues and Analysis in Food and Feed; European Commission, 2018. Available at: https://ec.europa.eu/food/sites/food/files/plant/docs/pesticides_mrl_guidelines_wrkdoc_2017-11813.pdf, accessed in May 2020.
https://ec.europa.eu/food/sites/food/fil...
Linearity
Linearity was investigated by the calibration curve of the fortified matrix extract samples at six equidistant concentration levels of 2.0, 6.80, 11.6, 16.4, 21.2, 26.0 µg L-1 for LLE-LTP, and 3.1, 10.6, 18.1, 25.6, 33.1, 40.6 µg L-1 for QuEChERS, with three independent replicates for each level. The ordinary least squares method was used to estimate the linear regression parameters. The jackknife test, with a maximum number of extreme values removed from 22.2% of the original data, was employed to treat and confirm outliers. Regression analysis was evaluated by the normality (Ryan and Joiner test), independence (Durbin and Watson test) and homoscedasticity (Brown and Forsythe test) parameters. Analysis of variance (ANOVA) was applied to analytical curves to test for lack of linearity fit and regression significance.
Matrix effect
The matrix effect was determined from preparing the calibration curves for 2,4-D in acetonitrile and matrix extracts at six equidistant concentration levels of 2.0, 6.80, 11.6, 16.4, 21.2, 26.0 µg L-1 for LLE-LTP, and 3.1, 10.6, 18.1, 25.6, 33.1, 40.6 µg L-1 for QuEChERS, with three independent replicates at each level. The matrix effect was investigated by calculating the ratio between the angular coefficients obtained on the analytical curve of the matrix extract and the analytical curve in acetonitrile (multiplied by 100), according to equation 1.
where: ME is the matrix effect; amatrix is the angular coefficient of the analytical curve in matrix extract; asolvent is the angular coefficient of the analytical curve in solvent.
For interpreting the result, it was considered that the value equivalent to 100% indicates no matrix effect. If the value is less than 100% it means suppression of the analytical area promoted by the matrix. If the result is greater than 100%, it indicates an increase in the analyte response caused by the matrix. 3333 Chamkasem, N. ; Harmon, T. ; Anal. Bioanal. Chem. 2016, 408, 4995.
Real samples
After being optimized and validated, the LLE-LTP was applied to 2 groundwater samples and 8 surface water samples collected in the municipality of Turmalina, Minas Gerais, Brazil. This region was chosen due to the presence of extensive eucalyptus plantations and consequently probable intensive use of the 2,4-D herbicide. Considering that this herbicide is poorly retained by most soils and has high water solubility,66 Souza, F. L. ; Sáez, C. ; Lanza, M. R. V. ; Cañizares, P. ; Rodrigo, M. A. ; Sep. Purif. Technol. 2017, 178, 147.,99 Cai, J. ; Zhou, M. ; Yang, W. ; Pan, Y. ; Lu, X. ; Serrano, K. G. ; Chemosphere 2018, 212, 784. water resources located near eucalyptus plantations have a high potential to be contaminated by 2,4-D.
Study on the stability of 2,4-D in water
An experiment was developed to evaluate the stability of 2,4-D in water by simulating environmental conditions. First, 700 mL of purified water was added into a 1 L glass flask. The same procedure was carried out using groundwater samples from Montes Claros City, both 2,4-D-free samples. Then, both samples were spiked with 2,4-D, obtaining an initial concentration of 25.0 µg L-1. The flasks were hermetically sealed to prevent water evaporation and kept in sunlight during the day. The samples were homogenized every five days, and aliquots were collected to determine the concentration of 2,4-D by LLE-LTP, followed by HPLC-DAD analysis. The experiment was performed in triplicate.
Results and Discussion
Optimization of the chromatographic conditions
The wavelength was the first optimized parameter for determining 2,4-D by HPLC-DAD. Previous studies have employed 200,2929 Coelho, E. R. C. ; Leal, W. P. ; de Souza, K. B. ; do Rozário, A. ; Antunes, P. W. P. ; Eng. Sanit. Ambient. 2018, 23, 1043. 220,1717 Raks, V. A. ; Turchin, V. A. ; Zaitsev, V. N. ; J. Water Chem. Technol. 2015, 37, 295.,3434 Shamsipur, M. ; Fattahi, N. ; Pirsaheb, M. ; Sharafi, K. ; J. Sep. Sci. 2012, 35, 2718. 228,3535 Kashyap, S. M. ; Pandya, G. H. ; Kondawar, V. K. ; Gabhane, S. S. ; J. Chromatogr. Sci. 2005, 43, 81. 280,55 Njoku, V. O. ; Islam, Md. A. ; Asif, M. ; Hameed, B. H. ; J. Environ. Manage. 2015, 154, 138.,3131 Behbahani, M. ; Najafi, F. ; Bagheri, S. ; Bojdi, M. K. ; Hassanlou, P. G. ; Bagheri, A; Environ. Monit. Assess. 2014, 186, 2609. and 284 nm. 3636 Tsai, W. -C. ; Huang, S. -D. ; J. Chromatogr. A 2009, 1216, 7846. However, the absorption spectrum in the ultraviolet region showed that the 2,4-D solution at a concentration of 1.00 mg L-1 had absorption bands at 200, 228 and 284 nm, as can be seen in Figure S1 (Supplementary Information (SI) section).
Monitoring of 2,4-D at 200 and 228 nm showed higher signal intensity and chromatographic areas. However, the chromatograms obtained presented higher number of signals attributed to interferents, as can be seen in Figures S2a and S2b (SI section). Despite having a lower peak intensity compared to the other wavelengths, the monitoring at 284 nm enabled obtaining better selectivity and less peaks of interferents, as can be seen in Figure S2c (SI section). Thus, 284 nm was chosen for the quantification of 2,4-D in chromatographic analyses.
The second optimized parameter was the proportion of the mobile phase in isocratic mode. 2,4-D is an ionizable compound with pKa 2.80 due to the presence of the carboxylic acid group, therefore it tends to be poorly retained in reverse phase column. 2929 Coelho, E. R. C. ; Leal, W. P. ; de Souza, K. B. ; do Rozário, A. ; Antunes, P. W. P. ; Eng. Sanit. Ambient. 2018, 23, 1043. In this case, the ideal situation is that the employed mobile phase has a reduced pH value, as this condition influences acid ionization, increasing the retention in reverse phase column. 1616 Chávez-Moreno, C. A. ; Guzmán-Mar, J. L. ; Hinojosa-Reyes, L. ; Hernández-Ramírez, A. ; Ferrer, L. ; Cerdà, V. ; Anal. Bioanal. Chem. 2012, 403, 2705.,2929 Coelho, E. R. C. ; Leal, W. P. ; de Souza, K. B. ; do Rozário, A. ; Antunes, P. W. P. ; Eng. Sanit. Ambient. 2018, 23, 1043.,3737 Baggiani, C. ; Giraudi, G. ; Giovannoli, C. ; Trotta, F. ; Vanni, A. ; J. Chromatogr. A 2000, 883, 119. The molecular form of 2,4-D consequently has better interaction with the column, promoting better resolution. 3838 Sampaio, M. R. F. ; Tomasini, D. ; Cardoso, L. V. ; Caldas, S. S. ; Primel, E. G. ; J. Braz. Chem. Soc. 2012, 23, 197.
Thus, the mobile phase consisting of acetonitrile/water with pH = 3.00 was chosen for this study. Moreover, 2,4-D was detected in all studied proportions, as can be observed in the chromatograms shown in Figure S3 (SI section), but the best resolution for monitoring 2,4-D was observed using the 75/25 (v/v) ratio. Therefore, this proportion of the mobile phase was chosen for this work.
The third parameter studied was mobile phase flow, as can be observed in Table 1. The chromatogram obtained using 0.500 mL min-1 showed higher resolution, intensity and chromatographic area, and so this flow was defined for this study, as can be observed in Figure S4 (SI section).
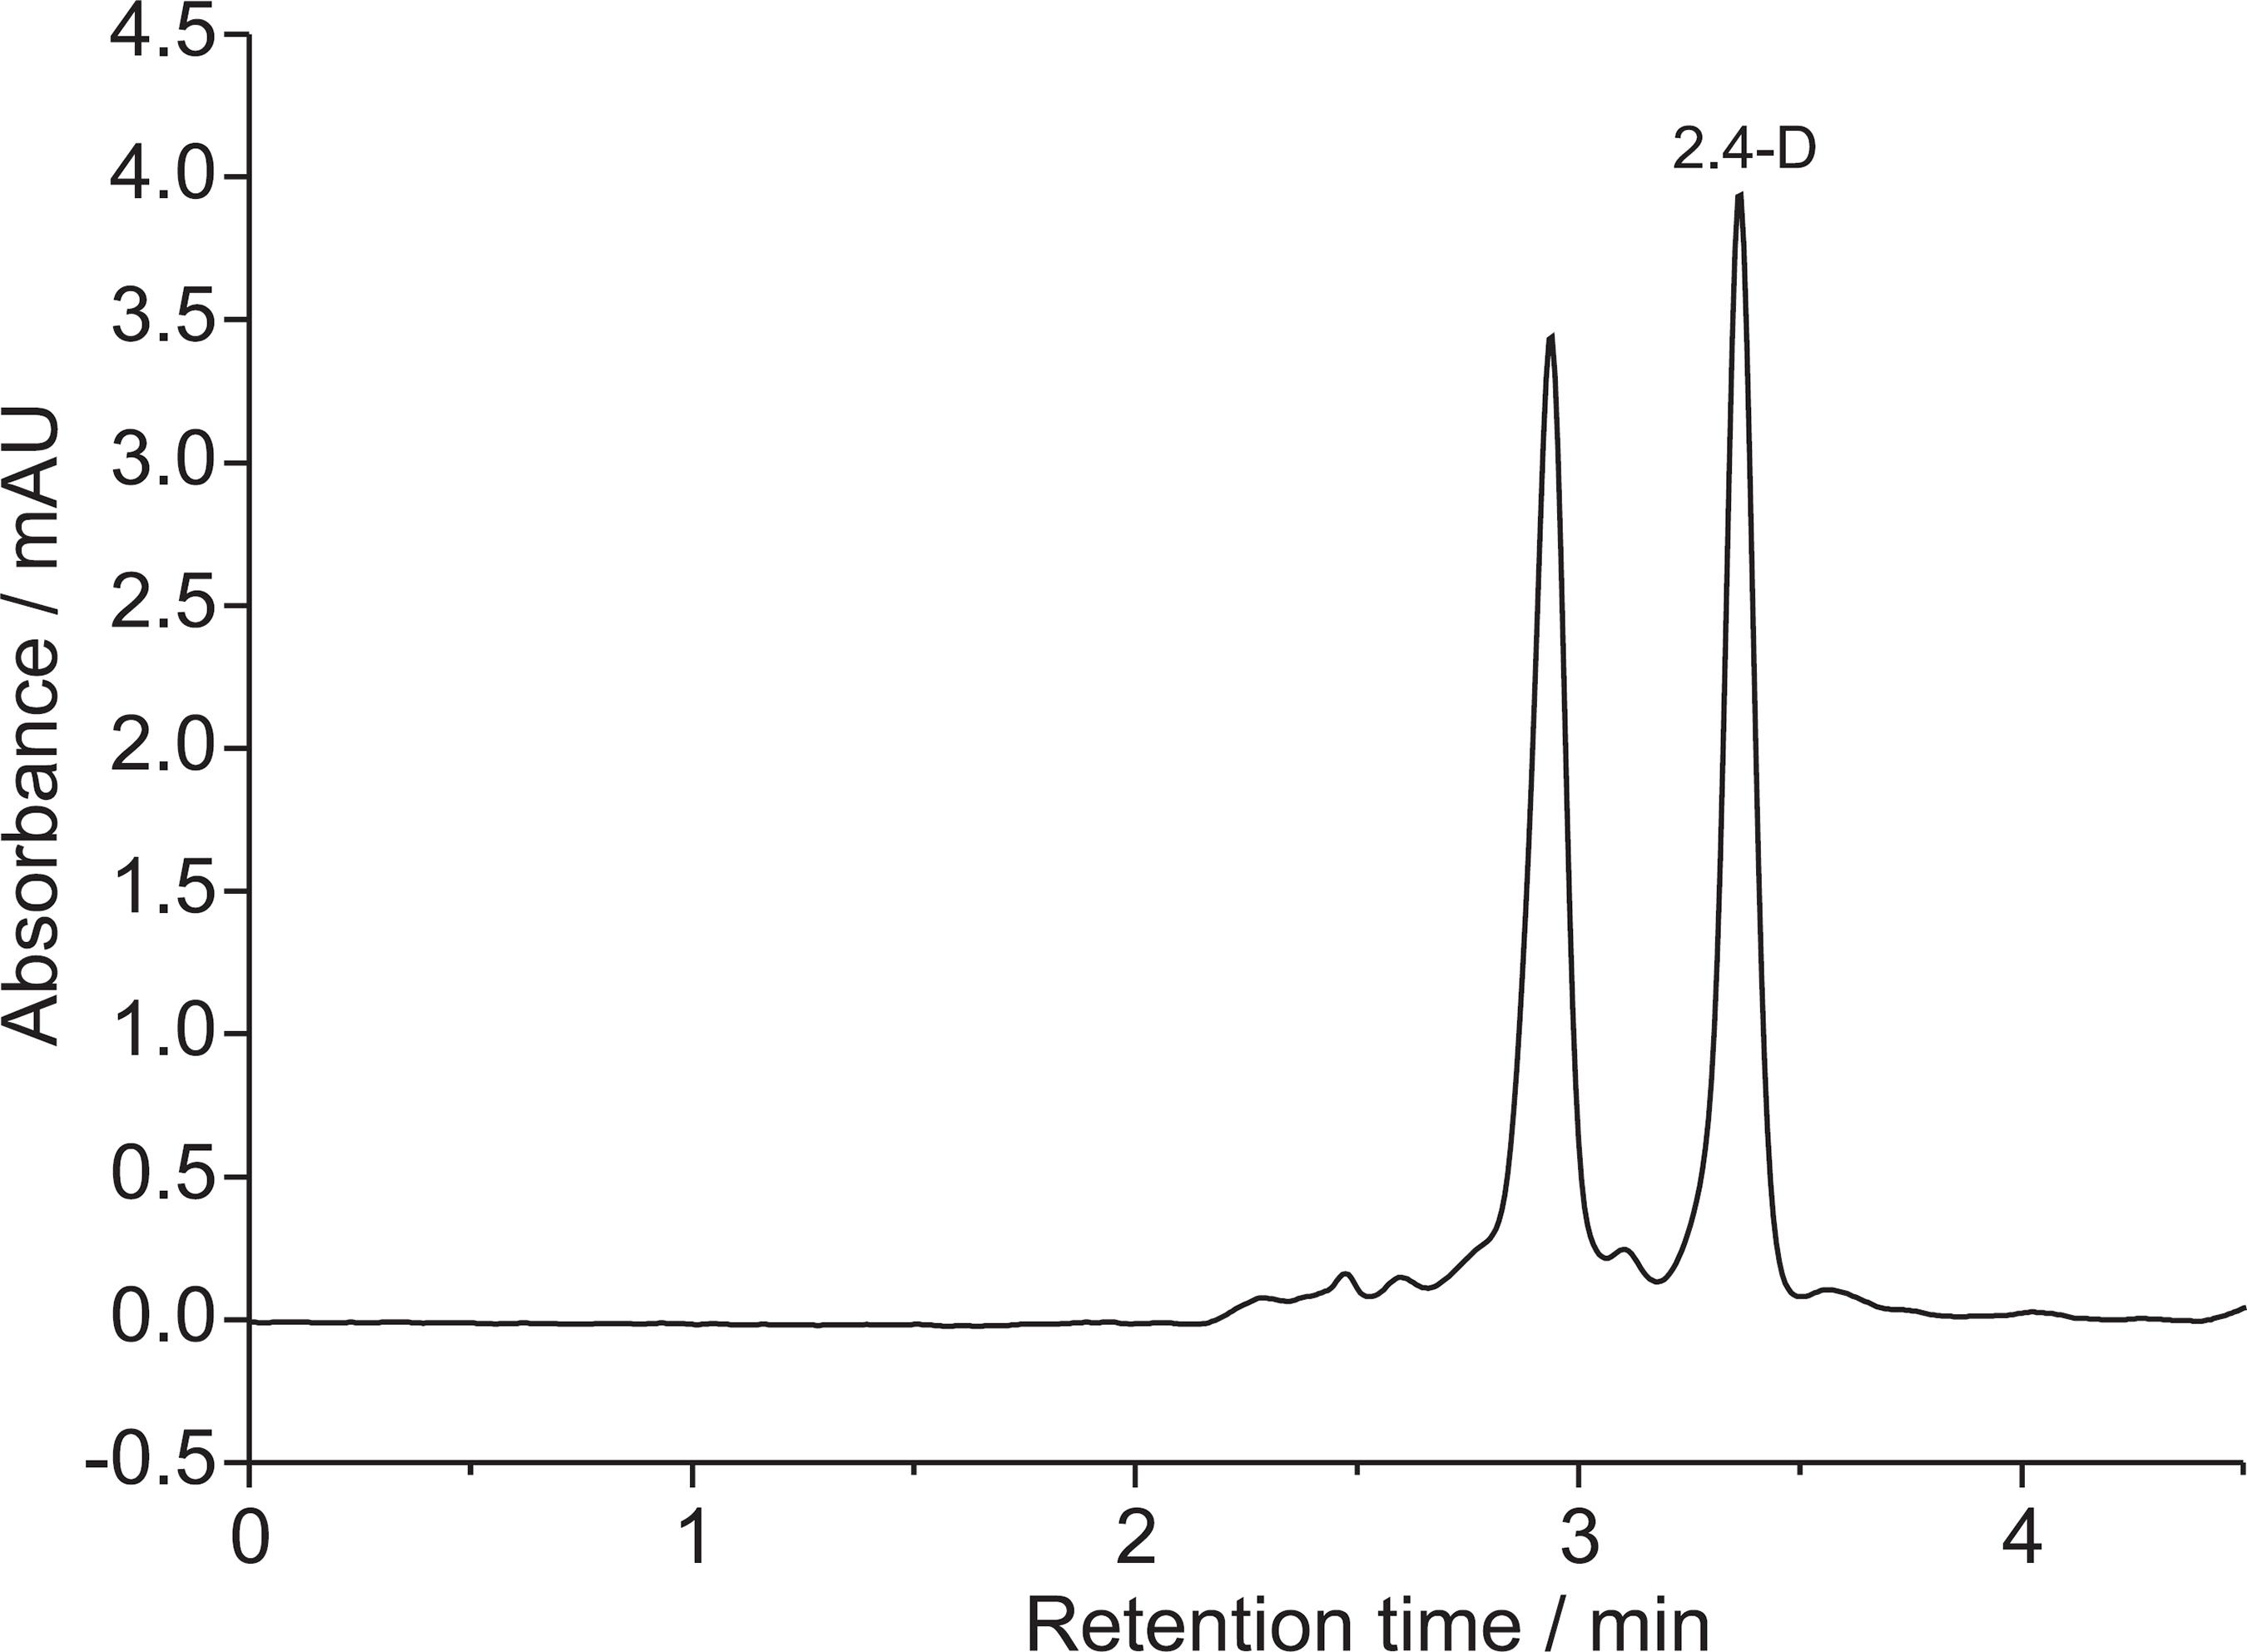
The chromatogram obtained after optimization of all chromatographic conditions is presented in Figure 1.
LLE-LTP optimization
LLE-LTP is based on the addition of organic solvent to the aqueous sample, usually at a 2/1 (v/v) ratio. 3939 Vieira, H. P. ; Neves, A. A. ; Queiroz, M. E. L. R. ; Quim. Nova 2007, 30, 535. Next, the mixture is homogenized, and the temperature is reduced to -20 ºC for freezing the aqueous phase and forming a two-phase system. A time of 1 h has been reported as suitable for freezing the aqueous phase. 4040 Rudakov, O. B. ; Khorokhordina, E. A. ; Preobrazhenskii, M. A. ; Rudakova, L. V. ; Russ. J. Phys. Chem. 2016, 90, 1665.,4141 Sicupira, L. ; Tiago, J. P. F. ; de Pinho, G. P. ; Silvério, F. O. ; J. Braz. Chem. Soc. 2019, 30, 1284. At this moment, the target analytes migrate to the liquid organic phase, and no clean-up step is required. 4242 Pinho, G. P. ; Neves, A. A. ; de Queiroz, M. E. L. R. ; Silvério, F. O. ; Food Control 2010, 21, 1307.,4343 Rego, E. C. P. ; Guimarães, E. F. ; dos Santos, A. L. M. ; Mothé, E. S. M. ; Rodrigues, J. M. ; Pereira Netto, A. D. ; Anal. Methods 2015, 7, 4699. The obtained extraction percentages are presented in Figure 2.
Recovery percentages of 2,4-D in the optimization of the LLE-LTP methodology. Bars followed by the same letter do not differ statistically from each other by the Tukey’s test at 5% significance level. ACN = acetonitrile; ACN/Et. Ac. = acetonitrile/ethyl acetate; ACN Ac. = acetonitrile acidified with 1% (v/v) acetic acid.
The highest recovery percentages were obtained using acetonitrile and acetonitrile/ethyl acetate as extraction phases and did not differ statistically by the Tukey’s test at the 5% significance level. However, the chromatogram obtained using acetonitrile showed a smaller number of signals attributed to interferents in relation to other two extraction phases, as shown in Figure S5b (SI section). Therefore, acetonitrile was chosen as the best extraction phase for this methodology. Similar results using this same condition have also been reported in previous studies. 4141 Sicupira, L. ; Tiago, J. P. F. ; de Pinho, G. P. ; Silvério, F. O. ; J. Braz. Chem. Soc. 2019, 30, 1284.,4444 Silvério, F. O. ; Silva, J. G. S. ; Aguiar, M. C. S. ; Cacique, A. P. ; Pinho, G. P. ; Quim. Nova 2012, 35, 2052.
An additional extract concentration step was added to the LLE-LTP method in this study. After extraction, 5.00 mL of the organic fraction was completely evaporated and resuspended in 400 µL acetonitrile, resulting in a 12-fold concentration factor. This step presented the advantage of reducing the LOQ to 2.0 µg L-1. The method validation began after optimizing the LLE-LTP method.
QuEChERS optimization
QuEChERS is a sample preparation methodology proposed by Anastassiades et al. 4545 Anastassiades, M. ; Lehotay, S. J. ; Stajnbaher, D. ; Schenck, F. J. ; J. AOAC Int.
2003, 86, 412. This methodology is based on single phase extraction with the addition of organic solvent to the aqueous sample. The system is homogenized and subjected to the partitioning step by adding a salt mixture. Then, an additional clean-up step is performed to remove interferents and residual water. 4545 Anastassiades, M. ; Lehotay, S. J. ; Stajnbaher, D. ; Schenck, F. J. ; J. AOAC Int.
2003, 86, 412.
46 Cabrera, L. C. ; Martins, M. L. ; Primel, E. G. ; Prestes, O. D. ; Adaime, M. B. ; Zanella, R. ; Sci. Chromatogr.
2012, 4, 227.-4747 Nadaf, H. A. ; Yadav, G. S. ; Kumari, B. ; J. Apic. Res.
2016, 54, 260.
In the original QuEChERS method, the clean-up step is performed using anhydrous MgSO4 and the primary secondary amine (PSA) sorbent. However, considering that water is a less complex matrix, only 1.00 g of MgSO4 was used in this step in this study in order to promote removal of residual water in the obtained extract. The obtained extraction percentages are presented in Figure 3.
Recovery percentages of 2,4-D in the QuEChERS methodology optimization. Bars followed by the same letter do not differ statistically from each other by the Tukey’s test at the 5% significance level. ACN = acetonitrile; ACN/Et. Ac. = acetonitrile/ethyl acetate; ACN Ac. = acetonitrile acidified with 1% (v/v) acetic acid.
The highest recovery percentage of 2,4-D was obtained using the extraction phase consisting of acetonitrile acidified with 1% (v/v) acetic acid, as can be seen in Figure 3. This extraction phase also presented a chromatogram with a smaller number of signals attributed to interference when compared to the other evaluated extraction phases, as shown in Figure S6c (SI section). Therefore, acetonitrile acidified with 1% (v/v) acetic acid was chosen for the QuEChERS methodology. Previous studies2626 Sack, C. ; Vonderbrink, J. ; Smoker, M. ; Smith, R. E. ; J. Agric. Food Chem.
2015, 63, 9657.,4848 Shi, X. ; Jin, F. ; Huang, Y. ; Du, X. ; Li, C. ; Wang, M. ; Shao, H. ; Jin, M. ; Wang, J. ; J. Agric. Food Chem.
2012, 60, 60.
49 Carneiro, R. P. ; Oliveira, F. A. S. ; Madureira, F. D. ; Silva, G. ; de Souza, W. R. ; Lopes, R. P. ; Food Control
2013, 33, 413.-5050 Li, M. ; Dai, C. ; Wang, F. ; Kong, Z. ; He, Y. ; Huang, Y. T. ; Fan, B. ; Sci. Rep.
2017, 7, 42489. using the QuEChERS method for 2,4-D extraction in rice, milk, fruits and vegetables also used acidified acetonitrile as the extraction phase.
The absence of a concentration step has been reported as the main disadvantage of the QuEChERS method, which may result in higher LOQ when compared to other sample preparation methodologies. 5151 Cunha, S. C. ; Fernandes, J. O. ; J. Chromatogr. A 2011, 1218, 7748.,5252 Garcia, C. V. ; Gotah, A. ; J. Anal. Methods Chem. 2017, 2017, ID 2603067. Therefore, an additional concentration step of the obtained extract was added in this study. After extraction procedures, 3.20 mL of the organic fraction was completely evaporated using air flow and resuspended in 400 µL acetonitrile. The addition of this step resulted in an eight-fold concentration factor, reducing the LOQ to 3.1 µg L-1. The validation step began after optimizing the QuEChERS method.
Validating the methodologies
In this study, the parameters evaluated for the validation of the LLE-LTP and QuEChERS methodologies were selectivity, LOQ, accuracy, precision, linearity and matrix effect.
Selectivity
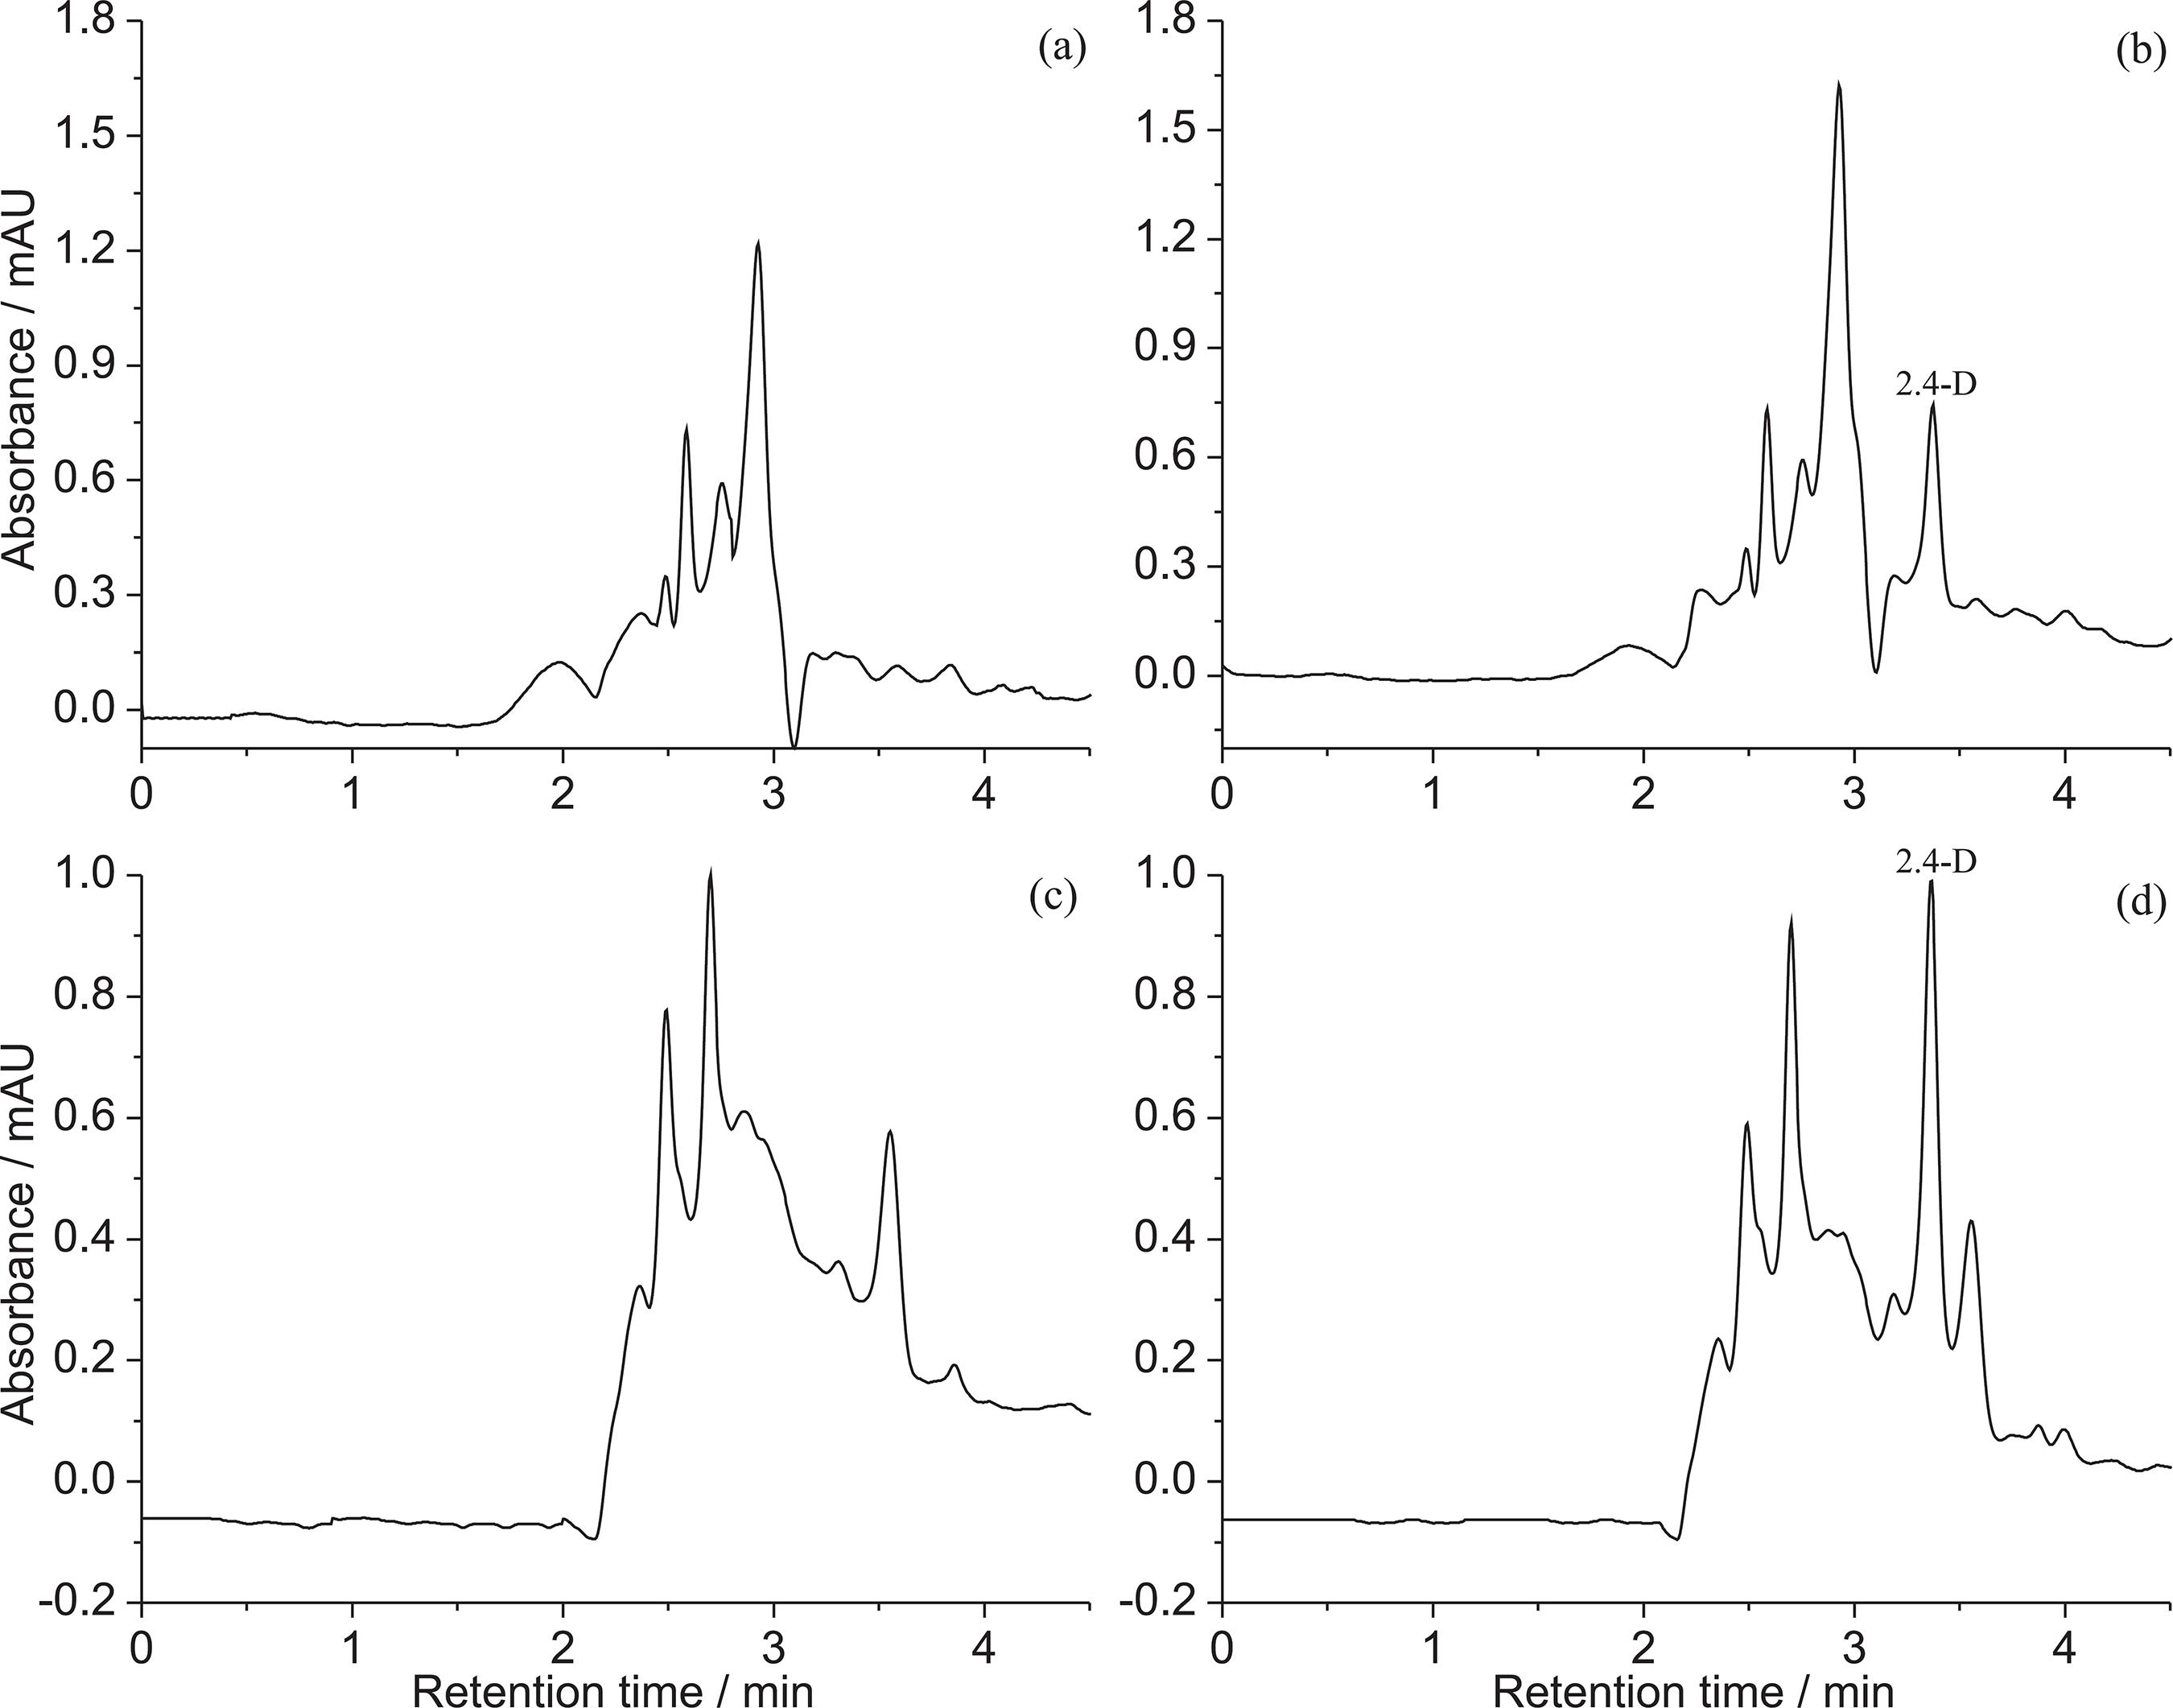
The selectivity of the proposed methodologies was determined through comparing chromatograms of the analyte-free sample (blank) and the spiked matrix with 2,4-D. The results showed that both methodologies were selective for monitoring this analyte, since no signal of interferents was detected in the chromatograms of the blank samples at the same retention time of 2,4-D, as can be seen in Figure 4.
Chromatograms of (a) the analyte-free sample and (b) the spiked extract with 2,4-D at a concentration of 250 μg L−1 in the LLE-LTP; and chromatograms of (c) the analyte-free sample and (d) the spiked extract with 2,4-D at a concentration of 250 μg L−1 in the QuEChERS methodology.
Limit of quantification
LOQ was determined considering the concentration of 2,4-D in the matrix after extraction procedures, resulting in a peak 10 times greater than the baseline noise obtained in the chromatogram of the analyte-free sample. The LOQ obtained in the LLE-LTP and QuEChERS methodologies are presented in Tables 2 and 3, respectively.
The LOQ values achieved in the LLE-LTP and QuEChERS were lower than the maximum residue limits defined by Brazilian legislation, which established 4.00 and 30.0 µg L-1 in the CONAMA resolution5353 Conselho Nacional do Meio Ambiente (CONAMA); Resolução CONAMA No. 357/2005: Dispõe sobre Classificação dos Corpos de Água e Diretrizes Ambientais para o seu Enquadramento, bem como Estabelece as Condições e Padrões de Lançamento de Efluentes, e Dá outras Providências; DOU No. 053, de 18/03/2005. Available at http://www.mma.gov.br/port/conama/legiabre.cfm?codlegi=459, accessed in May 2020.
http://www.mma.gov.br/port/conama/legiab...
and the Consolidated Resolution from the Ministry of Health,1010 Ministério da Saúde; Portaria de Consolidação No. 5, de 28 de setembro de 2017; Consolidação das Normas sobre as Ações e os Serviços de Saúde do Sistema Único de Saúde; Brasília, 2017. Available at http://bvsms.saude.gov.br/bvs/saudelegis/gm/2017/prc0005_03_10_2017.html, accessed in May 2020.
http://bvsms.saude.gov.br/bvs/saudelegis...
respectively. The obtained LOQ values were also lower than those established by the international agencies of WHO1313 World Health Organization (WHO); The WHO Recommended Classification of Pesticides by Hazard and Guidelines to Classification 2009; WHO Press: Geneva, Switzerland, 2010. Available at https://apps.who.int/iris/bitstream/handle/10665/44271/9789241547963_eng.pdf?sequence=1&isAllowed=y, accessed in May 2020.
https://apps.who.int/iris/bitstream/hand...
and USEPA,1212 https://www.epa.gov/ground-water-and-drinking-water/national-primary-drinking-water-regulations, accessed in May 2020.
https://www.epa.gov/ground-water-and-dri...
which defined 30.0 and 70.0 µg L-1, respectively. Thus, these results demonstrate the efficiency of the proposed methodologies for monitoring 2,4-D in these water samples.
Precision and accuracy
The precision and accuracy of the proposed methodologies were determined simultaneously. Tables 2 and 3 show the results of the mean recovery and RSD obtained from the LLE-LTP and QuEChERS methods, respectively.
Precision was assessed in terms of repeatability, for which the RSD values obtained in the LLE-LTP and QuEChERS were below 20%, confirming the precision of the proposed methodologies. 3232 SANTE/11813/2017: Guidance Document on Analytical Quality Control and Method Validation Procedures for Pesticide Residues and Analysis in Food and Feed; European Commission, 2018. Available at: https://ec.europa.eu/food/sites/food/files/plant/docs/pesticides_mrl_guidelines_wrkdoc_2017-11813.pdf, accessed in May 2020.
https://ec.europa.eu/food/sites/food/fil...
The accuracy of both methodologies was determined in terms of recovery, which defines a recovery percentage of 70 to 120% as acceptable, thus confirming the accuracy of the proposed methodologies. 3232 SANTE/11813/2017: Guidance Document on Analytical Quality Control and Method Validation Procedures for Pesticide Residues and Analysis in Food and Feed; European Commission, 2018. Available at: https://ec.europa.eu/food/sites/food/files/plant/docs/pesticides_mrl_guidelines_wrkdoc_2017-11813.pdf, accessed in May 2020.
https://ec.europa.eu/food/sites/food/fil...
Linearity
The linearity of the LLE-LTP and QuEChERS methodologies was analyzed by the calibration curves of the spiked matrix extract samples at six equidistant concentration levels, in three independent repetitions. All linearity assessments followed the procedures described by Souza and Junqueira5454 Souza, S. V. C. ; Junqueira, R. G. ; Anal. Chim. Acta 2005, 552, 25. and Bazilio et al. 5555 Bazilio, F. S. ; Bomfim, M. V. J. ; Almeida, R. J. ; Abrantes, S. M. P. ; Rev. Anal. 2012, 59, 60.
The linear regression parameters were analyzed using the ordinary least squares method. All outliers were treated and confirmed by the jackknife test (Figure S7, SI section). A total of four extreme values were removed in the LLE-LTP methodology, corresponding to the maximum data exclusion limit (22.2%). The QuEChERS methodology did not present extreme values. The Ryan-Joiner test indicated normal distribution of regression residuals of the proposed methodologies, obtaining correlation coefficients higher than the critical correlation coefficient, as shown in Figures S8a and S8b (SI section). The homoscedasticity of the regression residuals was confirmed by the Brown and Forsythe test and the homogeneous distribution of the residuals over the concentration levels. The Durbin and Watson test and the random distribution of the residuals in the four quadrants, as observed in Figures S9a and S9b (SI section), demonstrated the independence of the regression residuals.
An ANOVA indicated significant regression and non-significant linearity deviation, indicating data fit to the linear model in the range 2.0-26.0 and 3.1-40.6 µg L-1 for the LLE-LTP and QuEChERS methods, respectively (Tables 2 and 3). Therefore, using the ordinary least squares method, the LLE-LTP and QuEChERS followed by HPLC-DAD analysis were linear for the determination of 2,4-D.
Matrix effect
The matrix effect of the LLE-LTP and QuEChERS methodologies were evaluated from the analysis of 2,4-D calibration curves prepared in acetonitrile and matrix extracts. The data analysis was performed according to the procedure described for linearity, obtaining the regression equation adjusted for each analytical curve of the proposed methodologies, presented in Figure S10 (SI section). After calculating the ratio between the angular coefficients of the analytical curves and multiplying this value by 100, the obtained values were 100 and 99.5% for the LLE-LTP and QuEChERS methodologies, respectively. This result is equivalent to 100% and indicates the absence of matrix effect in the studied methodologies. 3333 Chamkasem, N. ; Harmon, T. ; Anal. Bioanal. Chem. 2016, 408, 4995.
The matrix effect on the determination of 2,4-D in water was observed in studies employing LC-MS-MS2020 Caldas, S. S. ; Rombaldi, C. ; Arias, J. L. O. ; Marube, L. C. ; Primel, E. G. ; Talanta 2016, 146, 676. and UHPLC-MS-MS. 88 Ji, Z. ; Cheng, J. ; Song, C. ; Hu, N. ; Zhou, W. ; Suo, Y. ; Sun, Z. ; You, J. ; Talanta 2019, 191, 313. However, similar to the results obtained, several studies1616 Chávez-Moreno, C. A. ; Guzmán-Mar, J. L. ; Hinojosa-Reyes, L. ; Hernández-Ramírez, A. ; Ferrer, L. ; Cerdà, V. ; Anal. Bioanal. Chem. 2012, 403, 2705.,2121 Ebrahimi, R. ; Feizbakhsh, A. ; Es’haghi, A. ; Chromatographia 2016, 79, 515.,3131 Behbahani, M. ; Najafi, F. ; Bagheri, S. ; Bojdi, M. K. ; Hassanlou, P. G. ; Bagheri, A; Environ. Monit. Assess. 2014, 186, 2609. which determined 2,4-D in water also indicated the absence of the matrix effect.
Methodology comparison
The results of the comparative analysis between the two methodologies are presented in Table 4.
The LLE-LTP and QuEChERS methodologies were effective for determining 2,4-D in water, with recovery percentages close to 100% and RSD below 3%. The sample preparation time by the QuEChERS methodology was shorter than the LLE-LTP methodology due to the freezing period of the sample. Although the freezing step can be considered time consuming, no supervision is required, and multiple samples can be extracted simultaneously. 5656 Rezende, F. B. F. ; Cheibub, A. M. S. S. ; Pereira Netto, A. D. ; Marques, F. F. C. ; Microchem. J. 2017, 134, 383.
On the other hand, the LLE-LTP presented fewer steps than the QuEChERS method. The QuEChERS method presented higher salt consumption due to the extraction principle of the technique because the separation of the aqueous and organic phases occurs by adding MgSO4 and NaCl. Also, the LLE-LTP required for removing residual water in the obtained extract.
The sample/solvent ratio was 1/2 and 1/1 (v/v) for the LLE-LTP and QuEChERS methodologies, respectively. Therefore, the solvent volume required in the LLE-LTP was higher than the volume used in the QuEChERS method. The use of more solvent in the LLE-LTP enabled concentrating 5.00 mL of the extract, resulting in a 12.5-fold concentration factor. The concentrated extract amount in the QuEChERS method was 3.20 mL and had an 8-fold concentration factor. Consequently, the LOQ obtained in the LLE-LTP was lower than the QuEChERS method.
Both methodologies presented similar results, but the LLE-LTP presented superiority in relation to the QuEChERS method because it presented a smaller number of steps, lower salt and sample consumption, a higher concentration factor and a lower limit of quantification. It is important to bear in mind that the presence of 2,4-D in water usually occurs at low concentrations, and the LOQ was the main parameter which influenced this choice.
Real samples
After being optimized and validated, 2 groundwater samples and 8 surface water samples were analyzed, and the obtained results indicated that 2,4-D was not quantified in any of the samples. Similar results were also obtained in similar studies employing HPLC-UV,3131 Behbahani, M. ; Najafi, F. ; Bagheri, S. ; Bojdi, M. K. ; Hassanlou, P. G. ; Bagheri, A; Environ. Monit. Assess. 2014, 186, 2609.,5757 Amani, V. ; Roshan, S. ; Asgharinezhad, A. A. ; Najafi, E. ; Abedi, H. ; Tavassoli, N. ; Zhad, H. R. L. Z. ; Anal. Methods 2011, 3, 2261. LC-MS/MS,2121 Ebrahimi, R. ; Feizbakhsh, A. ; Es’haghi, A. ; Chromatographia 2016, 79, 515. and multi-syringe chromatography coupled with ultraviolet detection (MSC-UV). 1616 Chávez-Moreno, C. A. ; Guzmán-Mar, J. L. ; Hinojosa-Reyes, L. ; Hernández-Ramírez, A. ; Ferrer, L. ; Cerdà, V. ; Anal. Bioanal. Chem. 2012, 403, 2705.
The non-quantification of 2,4-D in the real samples analyzed can be related to the 2,4-D-free samples, or to the concentration of this compound being below the LOQs, or it can further be related to the degradation period of this compound in the water. Therefore, the stability of 2,4-D in water under environmental conditions was evaluated.
Study of the stability of 2,4-D in water
The initial concentration of 2,4-D in the water samples was 25.0 µg L-1 because it is within the linearity range of the LLE-LTP. This methodology was chosen because it was superior to QuEChERS method. The results obtained in this study are shown in Figure S11 (SI section).
The concentration values of 2,4-D were similar in the purified and groundwater water samples and the half-life of 2,4-D was approximately 15 days, as can be seen in Figure S11 (SI section). The mean concentration of 2,4-D reduced from 25 to ca. 12.5 µg L-1 in this period, in both water samples. These results are similar to that reported by USEPA,1414 U.S. Environmental Protection Agency (USEPA); EPA 738-R-05-002: Reregistration Eligibility Decision for 2,4-D; USEPA, Office of Prevention, Pesticides and Toxic Substances, Office of Pesticide Programs, U.S. Government Printing Office: Washington, DC, 2005. Available at https://archive.epa.gov/pesticides/reregistration/web/pdf/24d_red.pdf, accessed in May 2020.
https://archive.epa.gov/pesticides/rereg...
which defines the half-life of 2,4-D as 15 days in aerobic aquatic environments and ranging from 41 to 333 days in anaerobic aquatic environments.
The 2,4-D concentration after 60 days from the beginning of the experiment was 1.90 and 2.30 µg L-1 for purified and underground water samples, respectively. These concentration values are equivalent to the LOQ of the LLE-LTP which is 2.0 µg L-1. This result indicates that this methodology is unable to quantify 2,4-D in water samples after 60 days of water contamination. This period can be one of the factors attributed to the non-quantification of any residues of this herbicide in the real samples.
Conclusions
The optimized and validated LLE-LTP and QuEChERS methodologies followed by HPLC analysis in this study were practical and effective, with a small number of steps and low solvent and sample consumption. Both methodologies were selective, precise, accurate, linear and did not present the matrix effect. The obtained limits of quantification were smaller than the maximum residue limits established by national and international legislations. Therefore, these methodologies represent efficient alternatives for monitoring 2,4-D in this matrix, but the LLE-LTP methodology presented superiority over the QuEChERS method. The real samples did not reveal any samples contaminated by 2,4-D, but this result may be associated to the 2,4-D-free samples, or to the concentration levels being below of the LOQs, or further to this herbicide having been degraded, since the concentration of 2,4-D in this matrix cannot be quantified by LLE-LTP followed by HPLC-DAD analysis after 60 days.
-
Supplementary InformationSupplementary data are available free of charge at http://jbcs.sbq.org.br as a PDF file.
Acknowledgments
We thank the Conselho Nacional de Desenvolvimento Científico e Tecnológico (CNPq) (420637/2016-8 and 308480/2019-8); the Fundação de Amparo à Pesquisa do Estado de Minas Gerais (FAPEMIG) (APQ-01429-16), and the Universidade Federal de Minas Gerais (UFMG). This study was financed in part by the Coordenação de Aperfeiçoamento de Pessoal de Nível Superior, Brazil (CAPES), finance code 001.
References
-
1Jaafarzadeh, N. ; Ghanbari, F. ; Ahmadi, M. ; Chem. Eng. J. 2017, 320, 436.
-
2Islam, F. ; Wang, J. ; Farooq, M. A. ; Khan, M. S. S. ; Xu, L. ; Zhu, J. ; Zhao, M. ; Muños, S. ; Li, Q. X. ; Zhou, W. ; Environ. Int. 2018, 111, 332.
-
3de Arcaute, C. R. ; Soloneski, S. ; Larramendy, M. L. ; Ecotoxicol. Environ. Saf. 2016, 128, 222.
-
4https://portal.anvisa.gov.br/documents/111215/117782/D27%2B%2B24-D.pdf/8548d5b3-f306-49df-ac49-4498bc5768d8, accessed in May 2020.
» https://portal.anvisa.gov.br/documents/111215/117782/D27%2B%2B24-D.pdf/8548d5b3-f306-49df-ac49-4498bc5768d8 -
5Njoku, V. O. ; Islam, Md. A. ; Asif, M. ; Hameed, B. H. ; J. Environ. Manage. 2015, 154, 138.
-
6Souza, F. L. ; Sáez, C. ; Lanza, M. R. V. ; Cañizares, P. ; Rodrigo, M. A. ; Sep. Purif. Technol. 2017, 178, 147.
-
7Salvatierra-stamp, V. ; Muñiz-Valencia, R. ; Jurado, J. M. ; Ceballos-Magaña, S. G. ; Microchem. J. 2018, 140, 87.
-
8Ji, Z. ; Cheng, J. ; Song, C. ; Hu, N. ; Zhou, W. ; Suo, Y. ; Sun, Z. ; You, J. ; Talanta 2019, 191, 313.
-
9Cai, J. ; Zhou, M. ; Yang, W. ; Pan, Y. ; Lu, X. ; Serrano, K. G. ; Chemosphere 2018, 212, 784.
-
10Ministério da Saúde; Portaria de Consolidação No. 5, de 28 de setembro de 2017; Consolidação das Normas sobre as Ações e os Serviços de Saúde do Sistema Único de Saúde; Brasília, 2017. Available at http://bvsms.saude.gov.br/bvs/saudelegis/gm/2017/prc0005_03_10_2017.html, accessed in May 2020.
» http://bvsms.saude.gov.br/bvs/saudelegis/gm/2017/prc0005_03_10_2017.html -
11World Health Organization (WHO); Guidelines for Drinking-Water Quality, 4th edition; WHO Press: Geneva, Switzerland, 2011. Available at https://www.who.int/water_sanitation_health/publications/2011/dwq_guidelines/en/, accessed in May 2020.
» https://www.who.int/water_sanitation_health/publications/2011/dwq_guidelines/en/ -
12https://www.epa.gov/ground-water-and-drinking-water/national-primary-drinking-water-regulations, accessed in May 2020.
» https://www.epa.gov/ground-water-and-drinking-water/national-primary-drinking-water-regulations -
13World Health Organization (WHO); The WHO Recommended Classification of Pesticides by Hazard and Guidelines to Classification 2009; WHO Press: Geneva, Switzerland, 2010. Available at https://apps.who.int/iris/bitstream/handle/10665/44271/9789241547963_eng.pdf?sequence=1&isAllowed=y, accessed in May 2020.
» https://apps.who.int/iris/bitstream/handle/10665/44271/9789241547963_eng.pdf?sequence=1&isAllowed=y -
14U.S. Environmental Protection Agency (USEPA); EPA 738-R-05-002: Reregistration Eligibility Decision for 2,4-D; USEPA, Office of Prevention, Pesticides and Toxic Substances, Office of Pesticide Programs, U.S. Government Printing Office: Washington, DC, 2005. Available at https://archive.epa.gov/pesticides/reregistration/web/pdf/24d_red.pdf, accessed in May 2020.
» https://archive.epa.gov/pesticides/reregistration/web/pdf/24d_red.pdf -
15Loomis, D. ; Guyton, K. ; Grosse, Y. ; El Ghissasi, F. ; Bouvard, V. ; Benbrahim-Tallaa, L. ; Guha, N. ; Mattock, H. ; Straif, K. ; Lancet Oncol. 2015, 16, 891.
-
16Chávez-Moreno, C. A. ; Guzmán-Mar, J. L. ; Hinojosa-Reyes, L. ; Hernández-Ramírez, A. ; Ferrer, L. ; Cerdà, V. ; Anal. Bioanal. Chem. 2012, 403, 2705.
-
17Raks, V. A. ; Turchin, V. A. ; Zaitsev, V. N. ; J. Water Chem. Technol. 2015, 37, 295.
-
18Tran, A. T. K. ; Hyne, R. V. ; Doble, P. ; Chemosphere 2007, 67, 944.
-
19Wen, Y. ; Yu, C. ; Zhang, J. ; Zhu, C. ; Li, X. ; Zhang, T. ; Niu, Z. ; Int. J. Adv. Res. Chem. Sci. 2015, 2, 8.
-
20Caldas, S. S. ; Rombaldi, C. ; Arias, J. L. O. ; Marube, L. C. ; Primel, E. G. ; Talanta 2016, 146, 676.
-
21Ebrahimi, R. ; Feizbakhsh, A. ; Es’haghi, A. ; Chromatographia 2016, 79, 515.
-
22Shahrebabak, S. M. ; Saber-Tehrani, M. ; Faraji, M. ; Shabanian, M. ; Aberoomand-Azar, P. ; Microchem. J. 2019, 146, 630.
-
23Paula, C. ; Jurisch, M. ; Piccin, E. ; Augusti, R. ; Drug Test. Anal. 2018, 10, 1348.
-
24Perestrelo, R. ; Silva, P. ; Porto-Figueira, P. ; Pereira, J. A. M. ; Silva, C. ; Medina, S. ; Câmara, J. S. ; Anal. Chim. Acta 2019, 1070, 1.
-
25Carver, Z. A. ; Han, A. A. ; Timchalk, C. ; Weber, T. J. ; Tyrrell, K. J. ; Sontag, R. L. ; Luders, T. ; Chrisler, W. B. ; Weitz, K. K. ; Smith, J. N. ; Toxicology 2018, 410, 171.
-
26Sack, C. ; Vonderbrink, J. ; Smoker, M. ; Smith, R. E. ; J. Agric. Food Chem. 2015, 63, 9657.
-
27Dickow, L. M. ; Gerken, D. F. ; Sams, R. A. ; Ashcraft, S. M. ; J. Anal. Toxicol. 2001, 25, 35.
-
28D’Archivio, A. A. ; Fanelli, M. ; Mazzeo, P. ; Ruggieri, F. ; Talanta 2007, 71, 25.
-
29Coelho, E. R. C. ; Leal, W. P. ; de Souza, K. B. ; do Rozário, A. ; Antunes, P. W. P. ; Eng. Sanit. Ambient. 2018, 23, 1043.
-
30Yang, F. ; Bian, Z. ; Chen, X. ; Liu, S. S. ; Liu, Y. ; Tang, G. ; J. AOAC Int. 2013, 96, 1134.
-
31Behbahani, M. ; Najafi, F. ; Bagheri, S. ; Bojdi, M. K. ; Hassanlou, P. G. ; Bagheri, A; Environ. Monit. Assess. 2014, 186, 2609.
-
32SANTE/11813/2017: Guidance Document on Analytical Quality Control and Method Validation Procedures for Pesticide Residues and Analysis in Food and Feed; European Commission, 2018. Available at: https://ec.europa.eu/food/sites/food/files/plant/docs/pesticides_mrl_guidelines_wrkdoc_2017-11813.pdf, accessed in May 2020.
» https://ec.europa.eu/food/sites/food/files/plant/docs/pesticides_mrl_guidelines_wrkdoc_2017-11813.pdf -
33Chamkasem, N. ; Harmon, T. ; Anal. Bioanal. Chem. 2016, 408, 4995.
-
34Shamsipur, M. ; Fattahi, N. ; Pirsaheb, M. ; Sharafi, K. ; J. Sep. Sci. 2012, 35, 2718.
-
35Kashyap, S. M. ; Pandya, G. H. ; Kondawar, V. K. ; Gabhane, S. S. ; J. Chromatogr. Sci. 2005, 43, 81.
-
36Tsai, W. -C. ; Huang, S. -D. ; J. Chromatogr. A 2009, 1216, 7846.
-
37Baggiani, C. ; Giraudi, G. ; Giovannoli, C. ; Trotta, F. ; Vanni, A. ; J. Chromatogr. A 2000, 883, 119.
-
38Sampaio, M. R. F. ; Tomasini, D. ; Cardoso, L. V. ; Caldas, S. S. ; Primel, E. G. ; J. Braz. Chem. Soc. 2012, 23, 197.
-
39Vieira, H. P. ; Neves, A. A. ; Queiroz, M. E. L. R. ; Quim. Nova 2007, 30, 535.
-
40Rudakov, O. B. ; Khorokhordina, E. A. ; Preobrazhenskii, M. A. ; Rudakova, L. V. ; Russ. J. Phys. Chem. 2016, 90, 1665.
-
41Sicupira, L. ; Tiago, J. P. F. ; de Pinho, G. P. ; Silvério, F. O. ; J. Braz. Chem. Soc. 2019, 30, 1284.
-
42Pinho, G. P. ; Neves, A. A. ; de Queiroz, M. E. L. R. ; Silvério, F. O. ; Food Control 2010, 21, 1307.
-
43Rego, E. C. P. ; Guimarães, E. F. ; dos Santos, A. L. M. ; Mothé, E. S. M. ; Rodrigues, J. M. ; Pereira Netto, A. D. ; Anal. Methods 2015, 7, 4699.
-
44Silvério, F. O. ; Silva, J. G. S. ; Aguiar, M. C. S. ; Cacique, A. P. ; Pinho, G. P. ; Quim. Nova 2012, 35, 2052.
-
45Anastassiades, M. ; Lehotay, S. J. ; Stajnbaher, D. ; Schenck, F. J. ; J. AOAC Int. 2003, 86, 412.
-
46Cabrera, L. C. ; Martins, M. L. ; Primel, E. G. ; Prestes, O. D. ; Adaime, M. B. ; Zanella, R. ; Sci. Chromatogr. 2012, 4, 227.
-
47Nadaf, H. A. ; Yadav, G. S. ; Kumari, B. ; J. Apic. Res. 2016, 54, 260.
-
48Shi, X. ; Jin, F. ; Huang, Y. ; Du, X. ; Li, C. ; Wang, M. ; Shao, H. ; Jin, M. ; Wang, J. ; J. Agric. Food Chem. 2012, 60, 60.
-
49Carneiro, R. P. ; Oliveira, F. A. S. ; Madureira, F. D. ; Silva, G. ; de Souza, W. R. ; Lopes, R. P. ; Food Control 2013, 33, 413.
-
50Li, M. ; Dai, C. ; Wang, F. ; Kong, Z. ; He, Y. ; Huang, Y. T. ; Fan, B. ; Sci. Rep. 2017, 7, 42489.
-
51Cunha, S. C. ; Fernandes, J. O. ; J. Chromatogr. A 2011, 1218, 7748.
-
52Garcia, C. V. ; Gotah, A. ; J. Anal. Methods Chem. 2017, 2017, ID 2603067.
-
53Conselho Nacional do Meio Ambiente (CONAMA); Resolução CONAMA No. 357/2005: Dispõe sobre Classificação dos Corpos de Água e Diretrizes Ambientais para o seu Enquadramento, bem como Estabelece as Condições e Padrões de Lançamento de Efluentes, e Dá outras Providências; DOU No. 053, de 18/03/2005. Available at http://www.mma.gov.br/port/conama/legiabre.cfm?codlegi=459, accessed in May 2020.
» http://www.mma.gov.br/port/conama/legiabre.cfm?codlegi=459 -
54Souza, S. V. C. ; Junqueira, R. G. ; Anal. Chim. Acta 2005, 552, 25.
-
55Bazilio, F. S. ; Bomfim, M. V. J. ; Almeida, R. J. ; Abrantes, S. M. P. ; Rev. Anal. 2012, 59, 60.
-
56Rezende, F. B. F. ; Cheibub, A. M. S. S. ; Pereira Netto, A. D. ; Marques, F. F. C. ; Microchem. J. 2017, 134, 383.
-
57Amani, V. ; Roshan, S. ; Asgharinezhad, A. A. ; Najafi, E. ; Abedi, H. ; Tavassoli, N. ; Zhad, H. R. L. Z. ; Anal. Methods 2011, 3, 2261.
Publication Dates
-
Publication in this collection
19 Aug 2020 -
Date of issue
Sept 2020
History
-
Received
23 Dec 2019 -
Accepted
12 May 2020