
Abstract
A catalyst comprised of SnO2 impregnated on ZnO nanowires, which presented remarkable ability to catalyze fatty acid esterification/transesterification reactions, is reported. For optimization of reaction conditions, artificially acidified soybean oil with 10 wt.% oleic acid was used as a model feed. The optimized conditions were: 150 °C, 6 h, 5 g of oil, catalyst concentration of 5%, and methanol:oil molar ratio of 15:1. The catalyst achieved 92% of total fatty acid methyl esters (FAME) content and was used five times without the necessity of catalyst washing from one reaction to the other. Then, such conditions were applied to produce biodiesel from the oil extracted from Scenedesmus sp. microalgae; the system reached 72% of FAME content, without any previous refining or degumming process of the oil. Rietveld refinement, X-ray diffraction, elemental mapping in scanning transmission electron microscopy, X-ray photoelectron spectroscopy, and pyridine-desorption Fourier-transform infrared spectroscopy were used to characterize the material.
Keywords:
acid catalyst; SnO2/ZnO; Scenedesmus sp. microalgae; biodiesel
Introduction
The finite natural fossil fuel resources and the necessity of mitigating carbon dioxide emissions are great concerns at the moment.11 Walsh, B.; Ciais, P.; Janssens, I. A.; Penuelas, J.; Riahi, K.; Rydzak, F.; Vuuren, D. P. V.; Obersteiner, M.; Nat. Commun. 2017, 8, 14856. In this context, biodiesel has become more attractive in recent years due to its renewability, less toxicity when compared to petroleum diesel, and environmental appeal since it is free from sulfur, aromatics and produces less soot, carbon oxide, and carbon dioxide.22 Mishra, V. K.; Goswami, R.; Biofuel 2018, 9, 273. Although the most common raw materials used for biodiesel production are vegetable oils and animal fat,33 Zhang, H.; Li, H.; Pan, H.; Wang, A.; Souzanchi, S.; Xu, C. C.; Yang, S.; Appl. Energy 2018, 223, 416. non-edible oils extracted from microalgal biomass have been lately considered once their production does not need arable lands for cultivation.44 Randrianarison, G.; Ashraf, M. A.; Geol. Ecol. Landscapes 2017, 1, 104. The use of these substrates is sometimes difficult due to their typical high acid values, which demands the use of acid catalysts.55 Thangaraj, B.; Solomon, P. R.; Muniyandi, B.; Ranganathan, S.; Lin, L.; Clean Energy 2018, 3, 2. Such reactions are conventionally catalyzed under homogeneous conditions using concentrated sulfuric acid, which is corrosive and dangerous.66 Das, S. K.; Bhunia, M. K.; Sinha, A. K.; Bhaumik, A.; ACS Catal. 2011, 1, 493.
Thus, solid acid catalysts are preferable as they eliminate such problems and can be easily separated from the reaction medium by simple filtration. Several solid acid catalysts are described in the literature for long-chain fatty acids esterification reactions, including mesoporous zirconium oxophosphates,66 Das, S. K.; Bhunia, M. K.; Sinha, A. K.; Bhaumik, A.; ACS Catal. 2011, 1, 493. zeolites,77 Kiss, A. A.; Dimian, A. C.; Rothenberg, G.; Adv. Synth. Catal. 2006, 348, 75. sulfated zirconia,77 Kiss, A. A.; Dimian, A. C.; Rothenberg, G.; Adv. Synth. Catal. 2006, 348, 75.,88 Kiss, A. A.; Dimian, A. C.; Rothenberg, G.; Energy Fuels 2008, 22, 598. silica zirconia,99 Rosenberg, D. J.; Bachiller-Baeza, B.; Dines, T. J.; Anderson, J. A.; J. Phys. Chem. B 2003, 107, 6526. sulfated zirconium phosphate supported by different metal oxides and mesoporous silica organosulfonic acid.1010 Rao, K. N.; Sridhar, A.; Lee, A. F.; Tavener, S. J.; Young, N. A.; Wilson, K.; Green Chem. 2006, 8, 790.,1111 Zhang, J.; Zou, H.; Qing, Q.; Yang, Y.; Li, Q.; Liu, Z.; Guo, X.; Du, Z.; J. Phys. Chem. B 2003, 107, 3712. Also, strong bifunctional acid catalysts, i.e., with Brønsted and Lewis sites, have received considerable attention due to their synergistic effect, which can effectively improve the catalytic activity of various reactions, such as acetalization, polymerization, benzylation, and oxidation reactions.1212 Pan, H.; Li, H.; Zhang, H.; Wang, A.; Jin, D.; Yang, S.; Energy Convers. Manage. 2018, 166, 534. Pan et al.1212 Pan, H.; Li, H.; Zhang, H.; Wang, A.; Jin, D.; Yang, S.; Energy Convers. Manage. 2018, 166, 534. have synthesized a Brønsted-Lewis acid bifunctional catalyst ([1,3-disulfonic acid imidazolium chloride][FeCl4]) and used it to prepare biodiesel with 98.7% of conversion to the desired products. Our group has obtained a Brønsted/Lewis acid catalyst from Cr/Al oxide and employed it in the synthesis of babassu oil biodiesel. The system has reached 98.6% of conversion.1313 Moura, C. V. R.; Neres, H. L. S.; Lima, M. G.; Moura, E. M.; Moita Neto, J. M.; de Oliveira, J. E.; Lima, J. R. O.; Sttolin, I. M.; Araújo, E. C.; J. Braz. Chem. Soc. 2016, 27, 515.
Sometimes, harsh conditions, e.g., high temperatures and long reaction times, are necessary for the efficiency of transesterification reactions that use acid catalysts.1414 Wang, J.; Dong, S.; Yu, C.; Han, X.; Guo, J.; Sun, J.; Catal. Commun. 2017, 92, 100. On the other hand, the use of alkali catalysts can be suitable, considering the milder reaction conditions, but the saponification is a great issue to be solved.1515 Pinto, B. F.; Garcia, M. A. S.; Costa, J. C. S.; de Moura, C. V. R.; Abreu, W. C.; de Moura, E. M.; Fuel 2019, 239, 290. Bearing that in mind, some strategies can be designed. For instance, the hydrophobicity that metal oxides present directly affects their performance on the biodiesel synthesis from oils with high acidity value, due to their natural protection against deactivation by the water produced during the reaction.55 Thangaraj, B.; Solomon, P. R.; Muniyandi, B.; Ranganathan, S.; Lin, L.; Clean Energy 2018, 3, 2. Therefore, choosing the correct mixture of oxides is crucial for the catalysis. Much has been suggested on the field, but sulfonated metal oxides are more frequently used. The process proposes the synthesis of materials that present active acid sites promoted by sulfation.1616 Arata, K.; Green Chem. 2009, 11, 1719. A series of active sulfated metal oxides have been exploited, which includes SO42-/ZrO2,1717 Guo-liang, S.; Feng, Y.; Xiao-liang, Y.; Rui-feng, L.; J. Fuel Chem. Technol. 2017, 45, 311.,1818 Luo, Y.; Mei, Z.; Liu, N.; Wang, H.; Han, C.; He, S.; Catal. Today 2017, 298, 99. SO42-/TiO2,1919 Hosseini-Sarvari, M.; Sodagar, E.; C. R. Chim. 2013, 16, 229. SO42-/TiO2-SiO2,2020 Shao, G. N.; Sheikh, R.; Hilonga, A.; Lee, J. E.; Park, Y.; Kim, H. T.; Chem. Eng. J.2013, 215, 600. SO42-/ZrO2-SiO2,2121 Thitsartarn, W.; Kawi, S.; Ind. Eng. Chem. Res. 2011, 50, 7857. SO42-/TiO2-Fe2O3,2222 Anuradha, S.; Raj, K. J. A.; Vijayaraghavan, V. R.; Viswanathan, B.; Indian J. Chem. 2014, 53, 1493. SO42-/SnO2,2323 Lam, M. K.; Lee, K. T.; Mohamed, A. R.; Appl. Catal., B 2009, 93, 134. SO42-/Al2O3-SnO2,2424 Nuithitikul, K.; Prasitturattanachai, W.; Int. J. Green Energy 2014, 11, 1097. and SO42-/ZnO,2525 Istadi, I.; Anggoro, D. D.; Buchori, L.; Rahmawati, D. A.; Intaningrum, D.; Procedia Environ. Sci. 2015, 23, 385. among others55 Thangaraj, B.; Solomon, P. R.; Muniyandi, B.; Ranganathan, S.; Lin, L.; Clean Energy 2018, 3, 2.,2525 Istadi, I.; Anggoro, D. D.; Buchori, L.; Rahmawati, D. A.; Intaningrum, D.; Procedia Environ. Sci. 2015, 23, 385.,2626 Guan, Q.; Li, Y.; Chen, Y.; Shi, Y.; Gu, J.; Li, B.; Miao, R.; Chen, Q.; Ning, P.; RSC Adv. 2017, 7, 7250. for transesterification and esterification reactions and remarkable results were achieved. However, sulfated catalysts are known to undergo leaching due to the polar medium and the water generated in esterification reactions.2727 Sani, Y. M.; Daud, W. M. A. W.; Aziz, A. R. A.; Appl. Catal., A 2014, 470, 140.,2828 Diamantopoulos, N.; Panagiotaras, D.; Nikolopoulos, D.; J. Thermodyn. Catal. 2015, 6, 143. Thus, to overcome this drawback, the natural acidic properties of the oxides can be explored.
Naked zinc oxide (ZnO) nanomaterials have been successfully applied for biodiesel production. Nambo et al.2929 Nambo, A.; Miralda, C. M.; Jasinski, J. B.; Carreon, M. A.; React. Kinet., Mech. Catal. 2015, 114, 583. showed their applicability as nanorods in olive oil transesterification, while Archana et al.3030 Archana, B.; Nagaraju, G.; Yatish, K. V.; Udayabhanu; Sekhar, K. B. C.; Kottam, N.; AIP Conf. Proc. 2018, 1992, 030004. demonstrated their ability as nanoparticles for the biodiesel production from Aegle marmelos oil. Also, ZnO presents noteworthy applications as catalytic support for several esterification/transesterification reactions. Baskar and Aiswarya3131 Baskar, G.; Aiswarya, R.; Bioresour. Technol. 2015, 188, 124. have proposed a heterogeneous catalyst comprised of copper-doped zinc oxide for biodiesel production from waste cooking oil. Under optimized conditions, the obtained biodiesel conversion was 97.71% with good performance in at least five runs.
Once Brønsted acid catalysts are more active in esterification reactions, and Lewis acid catalysts are more effective for transesterification ones,3232 di Serio, M.; Tesser, R.; Dimiccoli, M.; Cammarota, F.; Nastasi, M.; Santacesaria, E.; J. Mol. Catal. A: Chem. 2005, 239, 111.,3333 Su, F.; Guo, Y.; Green Chem. 2014, 16, 2934. both sites are important when higher quantity of fatty acid are available in oils. Known for some time, the transesterification reaction of soybean oil with methanol performed with some transition metal salts suggests that the strength of Lewis acid sites is: Sn2+ >> Zn2+ > Pb2+ ca. Hg2+.3434 Abreu, F. R.; Lima, D. G.; Hamú, E. H.; Einloft, S.; Rubim, J. C.; Suarez, P. A. Z.; J. Am. Oil Chem. Soc. 2003, 80, 601. Abreu et al.3535 Abreu, F. R.; Alves, M. B.; Macêdo, C. C. S.; Zara, L. F.; Suarez, P. A. Z.; J. Mol. Catal. A: Chem. 2005, 227, 263. have shown the applicability of SnO for biodiesel production of soybean oil. Although the data have not dealt with Sn4+, we decided to study such cation for biodiesel production once it is not available in the literature. Thus, attempts to use ZnO and SnO2 materials as a Brønsted and Lewis acid catalyst are worthy and, to the best of our knowledge, not explored in the literature up to now for biodiesel production. Also, successful examples using SnO2/γ-Fe2O3,3636 Akkarawatkhoosith, N.; Jaree, A.; Appl. Surf. Sci. 2018, 456, 615. mixed iron/tin,3737 Alves, M. B.; Medeiros, F. C. M.; Sousa, M. H.; Rubim, J. C.; Suarez, P. A. Z.; J. Braz. Chem. Soc. 2014, 25, 2304. SnO2/dolomite,3838 Shajaratun Nur, Z. A.; Taufiq-Yap, Y. H.; Nizah, M. F. R.; Teo, S. H.; Syazwani, O. N. S.; Islam, A.; Energy Convers. Manage. 2014, 78, 738. (Al2O3)8(SnO)2,3939 Mello, V. M.; Pousa, G. P. A. G.; Pereira, M. S. C.; Dias, I. M.; Suarez, P. A. Z.; Fuel Process. Technol. 2011, 92, 53. copper doped zinc oxide,3232 di Serio, M.; Tesser, R.; Dimiccoli, M.; Cammarota, F.; Nastasi, M.; Santacesaria, E.; J. Mol. Catal. A: Chem. 2005, 239, 111. and iron(II) doped zinc oxide4040 Baskar, G.; Soumiya, S.; Renewable Energy 2016, 98, 101. as catalysts for biodiesel production are available. We have synthesized ZnO nanowires because the synthesis described in the literature is cost-effective and fast, with a high purity.4141 Lin, C.; Li, Y.; Mater. Chem. Phys. 2009, 113, 334.
Herein, we presented the synthesis of a catalyst comprised of ZnO and SnO2 for simultaneous esterification and transesterification reactions for biodiesel production. Soybean oil was artificially acidified with 10 wt.% oleic acid to present an acid value compared to the Scenedesmus sp. microalgae oil and used to optimize the performance of the catalyst. The material was fully characterized by Rietveld refinement, X-ray photoelectron spectroscopy, elemental mapping in scanning transmission electron microscopy, and pyridine-desorption Fourier-transform infrared spectroscopy.
Experimental
All reagents were of analytical grade (Sigma-Aldrich, Saint Louis, Missouri, USA) and used without further purification. Refined soybean oil was purchased from a local market (Teresina, PI, Brazil) and used without any degumming procedure. Before the catalytic experiments, the refined soybean oil was acidified under stirring with 10 wt.% oleic acid (isomer not specified by the producer, product number: O1008) by just mixing 10 g of oleic acid with 90 g of soybean oil. The Scenedesmus sp. microalgae oil was extracted as previously reported by some of us.4242 Dall’Oglio, D. F.; de Sousa, L. C.; de Sousa, S. A. A.; Garcia, M. A. S.; Sousa, E. S.; de Lima, S. G.; Costa, P. S.; Guldhe, A.; Bux, F.; de Moura, E. M.; de Moura, C. V. R.; J. Braz. Chem. Soc. 2019, 30, 633. Specifically, we used as extraction conditions: CHCl3:MeOH (2:1); ultrasound for 2 h, and 60 °C.
Catalyst preparation
Zinc oxide nanowires were prepared by a previously described method in the literature.4141 Lin, C.; Li, Y.; Mater. Chem. Phys. 2009, 113, 334. The tin has been impregnated in the support (ZnO) using a wet impregnation method. Briefly, 0.5 g of zinc acetate dihydrate (≥ 99.0%) was placed in an alumina crucible and calcined in a muffle furnace for 6 h at 300 °C (heating rate = 20 °C min-1). A quantity of SnCl2.2H2O (98%) was dissolved in ethanol to give 10% of tin on the support, and the mixture was vigorously stirred while the ZnO was added. After 6 h of constant stirring, the solvent was removed under reduced pressure, and the solid was ground to a fine powder; then, washed three times with water. The material was subsequently calcined at 300 °C for 6 h (heating rate = 20 °C min-1) and designated as the SnO2/ZnO catalyst.
Catalytic reactions
The reactions were carried out in a 100-mL Teflon-lined stainless-steel autoclave. A heating plate coupled with digital temperature control (Arec X, Velp Scientifica) was used in the experiments. In a typical procedure, catalyst and methanol were mixed in the Teflon liner and stirred during 30 min before the addition of substrate (acidified soybean oil or Scenedesmus sp. microalgae oil) at 60 °C. Then, the liner was placed in the autoclave, and the system was positioned in an oil bath, under 600 rpm of stirring. The reaction conditions after optimization were: 5 g of oil, 5% of catalyst (related to the oil mass), 150 °C and methanol to oil molar ratio of 15:1. Any further modifications will be clearly stated in this work. At the end of the reaction, the system was cooled down to room temperature and, after centrifugation, the catalyst was recovered. The resulting mixture of the reaction was placed in a separating funnel and any excess of methanol was drained, and the upper phase was collected (the process was performed three times). Anhydrous sodium sulfate (≥ 99.0%) was used to remove any trace of water before analysis of the products. After the optimization of the catalytic conditions, the catalyst was reused without substantial loss of activity. From one run to the other, no washing procedure was performed, as the best condition. However, two other procedures using ether/ethanol (1:1) and hexane/water + methanol for washing were also tried. From one run to the other, the catalyst was dried in an oven overnight at 100 °C, under static air, in a ceramic container.
Characterizations
JEOL JEM 2100F transmission electron microscope operating at 200 kV, with a field emission gun and equipped with an energy dispersive spectrometer (Oxford X-MaxN 100TLE) was used to obtain scanning transmission electron microscopy (STEM) images of the as-prepared and spent catalyst (without washing). The images were acquired on bright-field and high angle-annular dark-field detection with a spot size of 1.5 nm. The element distribution maps were recorded using energy-dispersive X-ray spectroscopy (EDS). Fatty acid methyl esters (FAME) content was determined according to EN 14103,4343 EN 14103:2003: Fatty Acid Methyl Esters (FAME), Determination of Ester and Linolenic Acid Methyl Esters Contents, European Committee for Standardization, Brussels, 2003. by using gas chromatography (GC, Shimadzu GC-2010) coupled with flame ionization detector (FID) and Rtx-Wax capillary column. At the end of the reaction, the products were transferred for a separating funnel and washed twice with a mixture of 50 mL of distilled water and 25 mL of hexane. The aqueous phase was discarded, and 1 μL of the final mixture was injected using a column temperature of 210 °C for 50 min; the temperature of FID was 250 °C and the H2, air, and carrier gas (N2/air) flows were 40, 400 and 25 mL min-1, respectively. The GC-FID chromatogram was used to determine the relative concentrations using peak areas.
X-ray diffraction (XRD) measurements were obtained using a Bruker D8 Advance at a 2θ range from 10 to 90° with a 0.02° step size and measuring time of 5 s per step. The phases’ composition identification was performed by Rietveld refinement using ReX software version 0.8.2.4444 ReX Powder Diffraction Analysis Software, version 0.8.2; ReXpd Software Ltd., USA, 2016. X-ray photoelectron spectroscopy (XPS) data were obtained with ESCA + spectrometer system equipped with an EA 125 hemispherical analyzer and XM 1000 monochromated X-ray source (Scientia Omicron, Uppsala, Sweden) in Al K (1486.7 eV). The calibration was performed using C 1s peak (binding energy, BE = 284.8 eV). Textural characteristics were determined from nitrogen adsorption isotherms, recorded at -196 °C. The samples (100 mg) were degassed for 2 h at 150 °C before analysis. Specific surface area was obtained by the Brunauer-Emmett-Teller equation (BET method) from adsorption isotherm generated in a relative pressure range 0.07 < P/Po < 0.3 using Autosorb IQ-Quantachrome Instrument. The metal content in the catalysts (before and after usage) was measured by flame atomic absorption spectroscopy (FAAS), using an AA-6300 atomic absorption spectrophotometer (Shimadzu Corp, Kyoto, Japan). A PerkinElmer spectrum 100 GX FT-IR system set to measure 16 cumulative scans at 4 cm-1 in a range between 1700 and 1400 cm-1 was used to obtain Fourier-transform infrared spectroscopy (FTIR) analyses. The acid value of the oils used herein was measured by the D664-07 method.4545 ASTM D664-18e2: Standard Test Method for Acid Number of Petroleum Products by Potentiometric Titration, West Conshohocken, PA, 2018. The acid content was calculated by the equation:
where D (cm) is the diameter of the wafer, and w (g) the sample weight. The equipment software provided the integrated area A (in arbitrary units) of the bands at 1515-1565 (Brønsted) and 1435-1470 cm-1 (Lewis). The extinction coefficients ɛ of pyridine in interaction with Brønsted and Lewis sites are 1.67 ± 0.12 and 2.22 ± 0.21 cm mmol-1, respectively.4646 Emeis, C. A.; J. Catal. 1993, 141, 347. In a typical analysis, a sample was heated to 300 °C for 3 h before preparing wafers of approximately 30 mg of catalyst in 100 mg of KBr. Then, an N2 flow of 40 mL min-1 went through the sample at 100 °C for 20 min. Next, 1 mbar of pyridine was admitted to the cell. After 1 h of adsorption, the excess and weakly adsorbed pyridine was removed by evacuation at the same temperature for 30 min. The spectra were recorded in the transmission mode. The process was repeated at 200 °C.
Results and Discussion
Morphological and structural characteristics
The as-prepared material was characterized to confirm its composition and structure; then, used as a catalyst to check its performance in the transesterification reaction of refined soybean oil acidified with 10 wt.% oleic acid. Such a substrate was used for catalytic optimization before application of the material in the biodiesel production from the oil extracted from Scenedesmus sp. microalgae. The SnO2/ZnO catalyst presented a surface area of 76.3 m22 Mishra, V. K.; Goswami, R.; Biofuel 2018, 9, 273. g-1 (naked ZnO presented surface area of 85.2 m22 Mishra, V. K.; Goswami, R.; Biofuel 2018, 9, 273. g-1).
The crystal phases of the catalyst were identified by powder XRD, as we expected to obtain ZnO and SnO2 phases. The SnO2 would be produced from SnCl2 oxidation under heating, and air.4747 Butem, R.; Kraisingdecha, P.; Sadee, W. In Fluoride and Antimony-Doped Tin Oxide Film by Spray Pyrolysis; Tunkasiri, T., ed.; Trans Tech Publications: Zürich, Switzerland, 2008. Basically, the basic properties of SnCl2 are responsible for the oxidation in the presence of O2. SnCl2 oxides to Sn(OH)Cl under heating (100 °C). Then, tin oxychloride decomposes to SnCl4 and SnO2 at 120 °C. As we used 300 °C, we believe all the SnCl4 becomes SnO2, which was confirmed forward.
Figure 1a shows the patterns of zinc oxide, tin oxide, and the prepared catalyst. The XRD peaks shift towards higher angles observed in the catalyst indicates an improvement in the overall crystal structure. The apparent difficulty of finding SnO2 characteristic peaks in the XRD analysis of the catalyst might be related to the formation of an amorphous SnO2 phase. Thus, the Rietveld refinement (Figure 1b) was performed to quantify the number of crystalline phases of the catalyst and the presence of SnO2. They were indexed as ZnO (International Crystal Structure Database (ICSD) No. 57450) and SnO2 (ICSD No. 160667), resulting in 88.08% of ZnO and 11.92% of SnO2. The ZnO nanoparticles present space group of P63mc (186), with lattice constants a = b = 3.1415 (1) Å, and c = 5.033 (1) Å. The XRD peaks of SnO2 can be attributed to the rutile type tetragonal structure, space group of P42/mnm (136), with lattice constants a = b = 4.7347 (1) Å, and c = 3.1946 (1) Å. The quality of the data from structural refinement has been verified by R values related to Rprofile (Rp), Rexpected (Rexp), Rweighted (Rwp) profiles and the goodness of fit (GoF). More details regarding the Rietveld refinement are shown in Table 1. To measure the quantity of ZnO and SnO2 present in the catalyst, we used three different techniques: XRD, FAAS, and EDS. Data are displayed in Table 2 and showed a good agreement among the techniques.
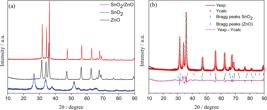
(a) XRD patterns of the SnO2, ZnO and catalyst. (b) Rietveld refinement of as-prepared catalyst, showing the observed, calculated, and difference pattern.
Lattice parameters, unit cell volume, and atomic positions obtained from Rietveld refinements of the SnO2/ZnO catalyst
To get further information on the physical characteristics of the SnO2/ZnO catalyst, the material was analyzed by TEM and STEM images and EDS, which are shown in Figure 2. Low-magnification TEM images of the as-prepared ZnO and SnO2/ZnO catalyst are shown in Figures 2a-2b, which indicated that the samples were comprised of a large number of nanowires (diameter 40-60 nm, length 10-20 μm). The size distribution was found to be well described by a lognormal distribution function, and the narrow size distribution demonstrated the robustness of this approach for ZnO nanowires synthesis. An important feature to confirm was the efficiency of the immobilization of SnO2 onto the ZnO surface. Elemental mapping images of Zn Kα1 (brown), O Kα1 (red), and Sn Kα1 (green) elements are shown in Figures 2d-2f, respectively, which presented the nanowire-shaped structure showed before. Interestingly, the signal of Sn attests its uniform disposition along the ZnO nanowires, suggesting that the impregnation performed was very efficient. This result confirms that the nanowires synthesis reached our expectations regarding SnO2/ZnO interaction.

Low-magnification TEM images (200 nm) of the as-prepared ZnO nanowires (a) and of the SnO2/ZnO material (b). Higher-magnification TEM images (20 nm) of the catalyst (c). Elemental mapping images of Zn Kα1 (d), O Kα1 (e), and Sn Kα1 (f).
Composition analysis
XPS spectra were performed to determine the chemical composition and the surface oxidation states of the proposed material, as shown in Figure 3. The binding energy peaks of O, Zn, Cl, and Sn were identified in the full range spectrum (Survey), and no peaks of other elements were observed (Figure 3a). As the calcination conditions were rather gentle to eliminate residual Cl ions, XPS analysis showed 7.08% of Cl. One may notice that the existence of Cl ions may enhances the surface acidity of the material, owing to the inductive effect on the neighboring hydroxyl groups. The asymmetric profile observed for O1s (Figure 3b) can be fitted to three sub-peaks by a 70% Gaussian/30% Lorentzian line shape, which indicated the presence of three different oxygen species. The energy peak centered at 530.3 eV matches to lattice oxygen in Sn-O-Sn; the peak located at 531.9 eV corresponds to the O-Zn binding, and the peak at 533.3 eV is attributed to OH species in H2O molecules.4848 Li, C. C.; Yin, X. M.; Li, Q. H.; Wang, T. H.; CrystEngComm 2011, 13, 1557. The high-resolution spectrum for Zn 2p (Figure 3c) presented peaks located at 1021.9 and 1044.9, being attributed to the Zn 2p3/2 and Zn 2p1/2 of Zn2+, respectively.4949 Balachandran, S.; Selvam, K.; Babu, B.; Swaminathan, M.; Dalton Trans. 2013, 42, 16365. Figure 3d displays the high-resolution spectrum of tin, in which the peaks located in 487.1 and 495.8 eV are ascribed as Sn 3d5/2 and Sn 3d3/2, respectively, and corresponds to Sn4+ species.5050 Wang, L.; Li, J.; Wang, Y.; Yu, K.; Tang, X.; Zhang, Y.; Wang, S.; Wei, C.; Sci. Rep. 2016, 6, 35079. The observed carbon may be attributed to surface hydrocarbon or adventitious hydrocarbons.

XPS spectra of samples SnO2/ZnO catalyst. (a) The survey, (b) oxygen, (c) zinc, and (d) tin spectra.
Surface acidity analyses
FTIR spectroscopy was successfully used with pyridine as a basic probe to determine the nature of acid sites on the surface of the material. Figure 4 shows the FTIR spectra of pyridine adsorbed on the catalyst at 100 and 200 °C. The spectra obtained in both temperatures showed sharp pyridine absorption bands around 1445 cm-1, which are attributed to the interaction of pyridine with Lewis acid sites,5151 Yazici, D. T.; Bilgiç, C.; Surf. Interface Anal. 2010, 42, 959. whereas just discrete signals are observed around 1550 cm-1 which are due to the protonation of molecules of pyridine by Brønsted acid sites.5252 Morterra, C.; Cerrato, G.; Pinna, F.; Meligrana, G.; Top. Catal. 2001, 15, 53. The weak intensity of peaks for the Brønsted sites suggests that they are in smaller concentrations than the Lewis ones on the material’s surface; peaks around 1486 cm-1 are associated with pyridine molecules adsorbed on both Lewis and Brønsted sites.5353 El-sayed, Y.; Abu-farha, N.; Kanan, S.; Vib. Spectrosc. 2014, 75, 78. The peaks around 1608 cm-1 are also ascribed as the vibration of pyridine molecules adsorbed on Lewis sites,5454 Rabee, A. I. M.; Mekhemer, G. A. H.; Osatiashtiani, A.; Isaacs, M. A.; Lee, A. F.; Wilson, K.; Zaki, M. I.; Catalysts 2017, 7, 204. showing its higher quantity when compared to Brønsted sites. Nevertheless, based on equation 1, the Lewis acid contents were 10.5 and 35.43 µmol g-1 for 100 and 200 °C, respectively, while the Brønsted acid contents were 5.25 and 0.26 µmol g-1 for 100 and 200 °C, respectively. The total acidity of the catalyst at different temperatures was 15.75 µmol g-1 for 100 ºC and 35.69 µmol g-1 for 200 ºC. Such results are comparable to the acidity of heteropolyacid catalysts, which are considered some of the most acid materials available for catalysis without the necessity of H2SO4 functionalization.5555 Tao, M.; Xue, L.; Sun, Z.; Wang, S.; Wang, X.; Shi, J.; Sci. Rep. 2015, 5, 13764.

Catalytic assessment
The as-synthesized solid material was a very good candidate for biodiesel production due to its properties; acid catalysts present higher tolerance to water and free fatty acids than basic ones, with no soap by-products formation.1414 Wang, J.; Dong, S.; Yu, C.; Han, X.; Guo, J.; Sun, J.; Catal. Commun. 2017, 92, 100. Also, it presented the possibility of recycling, which improves the net efficiency of the process.5656 Sheikh, R.; Choi, M.; Im, J.; Park, Y.; J. Ind. Eng. Chem. 2013, 19, 1413.
The determined acid value was 20.5 mg KOH g-1 for Scenedesmus sp. microalgae, an indication of the presence of a considerable amount of free fatty acids.5757 Guldhe, A.; Singh, B.; Rawat, I.; Bux, F.; Chem. Eng. Res. Des. 2014, 92, 1503. According to the literature, Brønsted acid catalysts are more active in esterification reactions, while Lewis acid catalysts are more active for transesterification ones.3131 Baskar, G.; Aiswarya, R.; Bioresour. Technol. 2015, 188, 124.,3232 di Serio, M.; Tesser, R.; Dimiccoli, M.; Cammarota, F.; Nastasi, M.; Santacesaria, E.; J. Mol. Catal. A: Chem. 2005, 239, 111. Thus, a catalyst with both acid sites would be suitable. Considering the acidity of the synthesized material, which presents a higher concentration of Lewis sites than Brønsted ones, it is plausible to expect that the SnO2/ZnO catalyst presents a higher activity to transesterification reactions; however, the bifunctionality of the material may be an important feature for both reactions. As an initial screening, refined soybean oil (acid value = 0.9 mg KOH g-1) and oleic acid underwent reactions for esterification/transesterification, as shown in Table 3. In agreement with the lower concentration of Brønsted acid sites, the FAME content obtained from oleic acid achieved just 47.9%, while the content for the refined soybean oil attained 77.6%, reflecting the higher concentration of Lewis sites.
FAME content for oleic acid and refined soybean oila a Conditions: 5% of catalyst; oil to alcohol molar ratio: 15:1; 6 h; 150 ºC. FAME: fatty acid methyl esters.
As far as we can tell, there are no examples in the literature dealing with ZnO nanowires for biodiesel production, nor SnO2 and SnO by themselves. Also, we decided not to perform ZnO and SnO2 reactions separately, once some Cl was deposited onto ZnO during the interaction with SnO2 precursor, which made impossible the comparison with bare ZnO nanowires. However, the literature presents examples of ZnO mixed with other oxides but rarely deals with only ZnO. Antunes et al.5858 Antunes, W. M.; Veloso, C. O.; Henriques, C. A.; Catal. Today 2008, 133, 548. used ZnO to produce biodiesel from soybean oil at 100 °C, 7 h, molar ratio of 55:1, and obtained 15% of yield. Kim et al.5959 Kim, M.; Lee, H.-S.; Yoo, S. J.; Youn, Y.-S.; Shin, Y. H.; Lee, Y.-W.; Fuel 2013, 109, 279. produced simultaneously biodiesel (from rapeseed oil) and ZnO (from zinc nitrate) and presented similar conversion to the obtained here at 250 °C, 5 h, 2.79 g of oil, 4.05 g of methanol, and 400 °C. Although very difficult to make a comparison between our result and the mentioned examples due to obvious differences, our system presents much milder conditions to reach similar performance. Basically, our studies show the viability of using ZnO/SnO2 as catalysts for biodiesel production.
Thus, for the optimization experiments, refined soybean oil artificially acidified with 10 wt.% oleic acid was used once its acidity was like that observed for the microalgae oil (21.9 mg KOH g-1). We have chosen soybean oil for optimization once the quantity of oil obtained from microalgae is typically low, even under improved conditions.4242 Dall’Oglio, D. F.; de Sousa, L. C.; de Sousa, S. A. A.; Garcia, M. A. S.; Sousa, E. S.; de Lima, S. G.; Costa, P. S.; Guldhe, A.; Bux, F.; de Moura, E. M.; de Moura, C. V. R.; J. Braz. Chem. Soc. 2019, 30, 633.
Thus, the effect of the reaction conditions on the transesterification of the acidified soybean oil was determined by measurements under laboratory conditions. The effect of each variable is described below.
The effect of temperature
A crucial factor that affects the performance of a catalyst is the reaction temperature since the Lewis and Brønsted sites content changes with the temperature, as stated by the FTIR analyses. For this optimization, seven different reaction temperatures-100, 110, 120, 130, 140, 150, and 160 °C, were selected. For each reaction, the following conditions were considered (15:1 molar ratio, 5% of catalyst, 6 h) and kept constant. According to Figure 5, temperatures below 100 °C would be pointless since at 100 °C the system achieved an exceptionally low conversion (23%). As can be seen, the conversion to ester increased almost linearly with increasing reaction temperature from 100 to 120 °C. Above 120 °C, a discrete augmentation was observed up to 140 °C, attaining the best conversion at 150 °C (92%). FAME content were 37, 63, 65, and 70% at 110, 120, 130, and 140 °C, respectively. Over 150 °C, the conversion decreased to a value similar to 120 °C (60%). The reason for these phenomena is that the raise of the temperature can reduce the catalyst activity and reverse the reaction since both transesterification and esterification reactions are reversible reactions in nature.6060 Anbessa, T. T.; Karthikeyan, S.; Int. J. Eng. Adv. Technol. 2019, 9, 1733.,6161 Srilatha, K.; Lingaiah, N.; Devi, B. L. A. P.; Prasad, R. B. N.; Venkateswar, S.; Prasad, P. S. S.; Appl. Catal., A 2009, 365, 28.

Temperature effects on the transesterification of refined acidified soybean oil using the catalyst SnO2/ZnO. Reaction conditions: 6 h, oil mass = 5 g; catalyst concentration = 5%; methanol:oil molar ratio: 15:1.
The effect of catalyst concentration
The effect of the catalyst concentration on the FAME content was the second parameter considered for the optimization of the esterification reaction (Figure 6), as the optimum temperature was set to 150 °C. The reactions were performed using five different catalyst concentrations-1, 3, 5, 7, and 9%-and were carried out by using a 15:1 methanol to oil molar ratio for 6 h at 150 °C. Although the performance of the material was significant with a concentration of 1% of the catalyst (57% of conversion), there was a noteworthy enhancement in the performance from 1 to 5% of SnO2/ZnO material, i.e., the system reached 92% of FAME content. Further increase in the catalyst concentration gave unsatisfactory FAME content due to mass-transfer restrictions.6262 Bhoi, R.; Singh, D.; Mahajani, S.; React. Chem. Eng. 2017, 2, 740. From the results, the optimum content of biodiesel can be obtained at 5% of catalyst concentration.

Effect of catalyst to oil weight on the transesterification of the refined acidified soybean oil using the SnO2/ZnO catalyst. Reaction conditions: 150 °C; 6 h; oil mass = 5 g; methanol:oil molar ratio: 15:1.
The effect of molar ratio
Although the literature deals with an excess of methanol for several applications in biodiesel production,6363 Lee, A. F.; Bennett, J. A.; Manayil, J. C.; Wilson, K.; Chem. Soc. Rev. 2014, 43, 7887. one may consider that a large excess of alcohol could slow down the phase separation of the alcohol and biodiesel,6464 Antolín, G.; Tinaut, F. V.; Briceno, Y.; Pérez, C.; Ramírez, A. I.; Bioresour. Technol. 2002, 83, 111. and that the purification of the recovered alcohol is difficult and costly.6565 Behzadi, S.; Farid, M. M.; Bioresour. Technol. 2009, 100, 683. Therefore, the molar ratio of methanol to the refined soybean oil is important since it directly influences the conversion of the substrate into the esters.
As shown in Figure 7, a series of reactions were conducted using methanol:oil molar ratios of 6:1, 12:1, 15:1, 18:1, and 30:1 (reaction time of 6 h, temperature of 150 °C, catalyst concentration of 5%). A remarkable enhancement was achieved when the molar ratio was changed from 12:1 to 15:1. However, modifying the molar ratio to 18:1 decreased the conversion, while the molar ratio of 30:1 was highly detrimental for the reaction as the augmentation on the methanol concentration causes a dilution of the oil.6666 Takase, M.; Chen, Y.; Liu, H.; Zhao, T.; Yang, L.; Wu, X.; Ultrason. Sonochem. 2014, 21, 1752. Maybe, the excess of methanol, associated to its first addition to the catalyst (and further stirring for 30 min before oil addition) can cause partial blockage of active sites of the catalyst, which provides lower conversion. It was quite unexpected since our previously published work with an acid catalyst required at least a molar ratio of 30:1 to present significant conversion.1414 Wang, J.; Dong, S.; Yu, C.; Han, X.; Guo, J.; Sun, J.; Catal. Commun. 2017, 92, 100. Also, Xie and Wang6767 Xie, W.; Wang, T.; Fuel Process. Technol. 2013, 109, 150. reported the same molar ratio as the best conditions using tin oxide-supported WO3 catalysts. Therefore, the molar ratio of 15:1 was the choice for the next optimization step.

Effect of methanol:oil molar ratio on the transesterification reaction of the refined acidified soybean oil using the SnO2/ZnO catalyst. Reaction conditions: 150 °C; 6 h; oil mass = 5 g; catalyst concentration = 5%.
The effect of reaction time
Five different reaction times-2, 4, 6, 8, and 10 h-were selected for the experiments. For each reaction, the optimized conditions in the previous sections were considered (15:1 molar ratio, 5% of catalyst, at 150 °C) and kept constant. The effect of reaction time on the FAME content is shown in Figure 8. FAME content increased from 77 to 92% when the reaction time was increased from 4 to 6 h. However, long reaction times are detrimental to the system. Such a result suggests that the reaction reached equilibrium, which drove the reverse reaction to occur, i.e., hydrolysis of the biodiesel produced. Thus, considering all the optimization performed herein, tests of recyclability were performed.

Transesterification effects of the refined acidified soybean oil using the catalyst SnO2/ZnO catalyst at different reaction times. Reaction conditions: 150 °C; oil mass = 5 g; catalyst concentration = 5%; methanol:oil molar ratio: 15:1.
Reusability of the catalyst
Although the catalyst, after the optimization processes, presented a significant activity, recycling experiments were performed once the stability of a system is one of the most important features of a catalyst (Figure 9). In order to evaluate the best procedure for the cleaning of the material after each run, three different washing methods were applied: (i) a mixture of ether and methanol (1:1); (ii) a mixture of hexane and water (1:1) followed by a methanol washing, and (iii) without washing. All the methods were followed by overnight drying in an oven at 100 ºC. The procedure (i) presented a slight increase run in the catalyst performance for the second run; nevertheless, from the third run, the activity reduced linearly up to the fifth run. The procedure (ii) was proposed due to the higher tolerance of solid acid catalysts to water.6868 Tran, H. L.; Ryu, Y. J.; Seong, D. H.; Lim, S. M.; Lee, C. G.; Biotechnol. Bioprocess Eng. 2013, 18, 242. Also, Interrante et al.6969 Interrante, L.; Bensaid, S.; Galletti, C.; Pirone, R.; Schiavo, B.; Scialdone, O.; Galia, A.; Fuel Process. Technol. 2018, 177, 336. have shown that a tin(II) oxide heterogeneous catalyst improved it performance when water was added to the reactions system. However, the performance of the catalyst was highly affected in the following cycles. The best results were achieved with procedure (iii). One may notice that this process is within the experimental error, maintaining the performance of the catalyst. Figure 8 shows that the catalyst is very stable up to 5 cycles, with the possibility of more runs, if desirable.

Reusability of the SnO2/ZnO catalyst for esterification of the refined acidified soybean oil at the optimum reaction conditions. Reaction conditions: 150 °C; 6 h; oil mass = 5 g; catalyst concentration = 5%; methanol:oil molar ratio: 15:1.
After the fifth run, the catalyst was also analyzed by FAAS, and no leaching of Zn or Sn was detected under the limit of detection of the equipment, i.e., the material maintained 9.0 wt.% Sn after five cycles. However, one may notice that after the runs (five in total), there was some damage to the nanowires, as seen in Figures 10a-10e. The modification of the particles surface is probably due to a limited leaching of Zn species, followed by re-deposition once the acid content in the reacting medium becomes low enough to allow the process.

Low-magnification TEM images (200 nm) of the as-prepared ZnO nanowires (a) and of the SnO2/ZnO material after the fifth run (b). Highermagnification TEM images (20 nm) of the used catalyst (c). Elemental mapping images of Zn Kα1 (d), O Kα1 (e), and Sn Kα1 (f).
Catalytic application on the Scenedesmus sp. microalgae
Oil from Scenedesmus sp. microalgae was extracted according to Dall’Oglio et al.4242 Dall’Oglio, D. F.; de Sousa, L. C.; de Sousa, S. A. A.; Garcia, M. A. S.; Sousa, E. S.; de Lima, S. G.; Costa, P. S.; Guldhe, A.; Bux, F.; de Moura, E. M.; de Moura, C. V. R.; J. Braz. Chem. Soc. 2019, 30, 633. and then, used as a substrate for biodiesel production. The optimized conditions for the acidified soybean oil were also used for the Scenedesmus sp. oil esterification/transesterification. Considering the oil did not undergo any refining or degumming process, the obtained FAME content was quite significant, i.e., reached 72%. One can be aware that the composition of FAME from acidified soybean oil is different from the obtained from a microalgae oil. The reason for that is the middle-chain length fatty acids that are in the mixture, as well as the nitrogen compounds, which can be detrimental to the final product.
Conclusions
In summary, ZnO nanowires impregnated with SnO2, containing Brønsted and Lewis acid sites, were synthesized through thermal treatment of zinc acetate dehydrate, followed by immobilization with SnCl2.2H2O before calcination at 300 °C. We were able to synthesize a catalyst with both acid sites without the need of sulfation. Pyridine-desorption FTIR spectroscopy confirmed the presence of the acid sites. The nature of the catalyst was analyzed by Rietveld refinement analysis and scanning TEM elemental mappings and XPS spectra. Refined soybean oil acidified with 10 wt.% oleic acid was the substrate used for the optimization of the reaction conditions, which were used in the production of biodiesel from Scenedesmus sp. microalgae. The SnO2/ZnO material was able to simultaneously catalyze esterification and transesterification reactions. Thus, a 92% FAME content was obtained at 150 °C, using 5 wt.% of catalyst in 6 h of reaction using the acidified soybean oil. Also, the catalyst was used up to five times without significant performance loss. When the catalyst was applied to the oil extracted from the microalgae, the process reached 72%, which was a very significant result since the oil did not undergo any refining or degumming process. Further studies are needed on the oil extraction and pre-treatment methods opening up the possibility of preparing biodiesel from microalgae using this novel catalyst.
Acknowledgments
The authors acknowledge financial support from CAPES, CNPq, and the technical support of the Center for Strategic Technology of the Northeast (CETENE-PE). We also thank Dr Liane M. Rossi for the FAAS equipment disponibility. Thanks to CCMC/CDMF (FAPESP No. 2013/07296-2, Brazil) and Prof Dr Renato Vitalino Gonçalves for the XPS measurements.
References
-
1Walsh, B.; Ciais, P.; Janssens, I. A.; Penuelas, J.; Riahi, K.; Rydzak, F.; Vuuren, D. P. V.; Obersteiner, M.; Nat. Commun. 2017, 8, 14856.
-
2Mishra, V. K.; Goswami, R.; Biofuel 2018, 9, 273.
-
3Zhang, H.; Li, H.; Pan, H.; Wang, A.; Souzanchi, S.; Xu, C. C.; Yang, S.; Appl. Energy 2018, 223, 416.
-
4Randrianarison, G.; Ashraf, M. A.; Geol. Ecol. Landscapes 2017, 1, 104.
-
5Thangaraj, B.; Solomon, P. R.; Muniyandi, B.; Ranganathan, S.; Lin, L.; Clean Energy 2018, 3, 2.
-
6Das, S. K.; Bhunia, M. K.; Sinha, A. K.; Bhaumik, A.; ACS Catal 2011, 1, 493.
-
7Kiss, A. A.; Dimian, A. C.; Rothenberg, G.; Adv. Synth. Catal 2006, 348, 75.
-
8Kiss, A. A.; Dimian, A. C.; Rothenberg, G.; Energy Fuels 2008, 22, 598.
-
9Rosenberg, D. J.; Bachiller-Baeza, B.; Dines, T. J.; Anderson, J. A.; J. Phys. Chem. B 2003, 107, 6526.
-
10Rao, K. N.; Sridhar, A.; Lee, A. F.; Tavener, S. J.; Young, N. A.; Wilson, K.; Green Chem. 2006, 8, 790.
-
11Zhang, J.; Zou, H.; Qing, Q.; Yang, Y.; Li, Q.; Liu, Z.; Guo, X.; Du, Z.; J. Phys. Chem. B 2003, 107, 3712.
-
12Pan, H.; Li, H.; Zhang, H.; Wang, A.; Jin, D.; Yang, S.; Energy Convers. Manage. 2018, 166, 534.
-
13Moura, C. V. R.; Neres, H. L. S.; Lima, M. G.; Moura, E. M.; Moita Neto, J. M.; de Oliveira, J. E.; Lima, J. R. O.; Sttolin, I. M.; Araújo, E. C.; J. Braz. Chem. Soc 2016, 27, 515.
-
14Wang, J.; Dong, S.; Yu, C.; Han, X.; Guo, J.; Sun, J.; Catal. Commun. 2017, 92, 100.
-
15Pinto, B. F.; Garcia, M. A. S.; Costa, J. C. S.; de Moura, C. V. R.; Abreu, W. C.; de Moura, E. M.; Fuel 2019, 239, 290.
-
16Arata, K.; Green Chem. 2009, 11, 1719.
-
17Guo-liang, S.; Feng, Y.; Xiao-liang, Y.; Rui-feng, L.; J. Fuel Chem. Technol. 2017, 45, 311.
-
18Luo, Y.; Mei, Z.; Liu, N.; Wang, H.; Han, C.; He, S.; Catal. Today 2017, 298, 99.
-
19Hosseini-Sarvari, M.; Sodagar, E.; C. R. Chim. 2013, 16, 229.
-
20Shao, G. N.; Sheikh, R.; Hilonga, A.; Lee, J. E.; Park, Y.; Kim, H. T.; Chem. Eng. J.2013, 215, 600.
-
21Thitsartarn, W.; Kawi, S.; Ind. Eng. Chem. Res. 2011, 50, 7857.
-
22Anuradha, S.; Raj, K. J. A.; Vijayaraghavan, V. R.; Viswanathan, B.; Indian J. Chem. 2014, 53, 1493.
-
23Lam, M. K.; Lee, K. T.; Mohamed, A. R.; Appl. Catal., B 2009, 93, 134.
-
24Nuithitikul, K.; Prasitturattanachai, W.; Int. J. Green Energy 2014, 11, 1097.
-
25Istadi, I.; Anggoro, D. D.; Buchori, L.; Rahmawati, D. A.; Intaningrum, D.; Procedia Environ. Sci. 2015, 23, 385.
-
26Guan, Q.; Li, Y.; Chen, Y.; Shi, Y.; Gu, J.; Li, B.; Miao, R.; Chen, Q.; Ning, P.; RSC Adv. 2017, 7, 7250.
-
27Sani, Y. M.; Daud, W. M. A. W.; Aziz, A. R. A.; Appl. Catal., A 2014, 470, 140.
-
28Diamantopoulos, N.; Panagiotaras, D.; Nikolopoulos, D.; J. Thermodyn. Catal. 2015, 6, 143.
-
29Nambo, A.; Miralda, C. M.; Jasinski, J. B.; Carreon, M. A.; React. Kinet., Mech. Catal. 2015, 114, 583.
-
30Archana, B.; Nagaraju, G.; Yatish, K. V.; Udayabhanu; Sekhar, K. B. C.; Kottam, N.; AIP Conf. Proc. 2018, 1992, 030004.
-
31Baskar, G.; Aiswarya, R.; Bioresour. Technol. 2015, 188, 124.
-
32di Serio, M.; Tesser, R.; Dimiccoli, M.; Cammarota, F.; Nastasi, M.; Santacesaria, E.; J. Mol. Catal. A: Chem. 2005, 239, 111.
-
33Su, F.; Guo, Y.; Green Chem. 2014, 16, 2934.
-
34Abreu, F. R.; Lima, D. G.; Hamú, E. H.; Einloft, S.; Rubim, J. C.; Suarez, P. A. Z.; J. Am. Oil Chem. Soc. 2003, 80, 601.
-
35Abreu, F. R.; Alves, M. B.; Macêdo, C. C. S.; Zara, L. F.; Suarez, P. A. Z.; J. Mol. Catal. A: Chem. 2005, 227, 263.
-
36Akkarawatkhoosith, N.; Jaree, A.; Appl. Surf. Sci 2018, 456, 615.
-
37Alves, M. B.; Medeiros, F. C. M.; Sousa, M. H.; Rubim, J. C.; Suarez, P. A. Z.; J. Braz. Chem. Soc 2014, 25, 2304.
-
38Shajaratun Nur, Z. A.; Taufiq-Yap, Y. H.; Nizah, M. F. R.; Teo, S. H.; Syazwani, O. N. S.; Islam, A.; Energy Convers. Manage. 2014, 78, 738.
-
39Mello, V. M.; Pousa, G. P. A. G.; Pereira, M. S. C.; Dias, I. M.; Suarez, P. A. Z.; Fuel Process. Technol. 2011, 92, 53.
-
40Baskar, G.; Soumiya, S.; Renewable Energy 2016, 98, 101.
-
41Lin, C.; Li, Y.; Mater. Chem. Phys 2009, 113, 334.
-
42Dall’Oglio, D. F.; de Sousa, L. C.; de Sousa, S. A. A.; Garcia, M. A. S.; Sousa, E. S.; de Lima, S. G.; Costa, P. S.; Guldhe, A.; Bux, F.; de Moura, E. M.; de Moura, C. V. R.; J. Braz. Chem. Soc 2019, 30, 633.
-
43EN 14103:2003: Fatty Acid Methyl Esters (FAME), Determination of Ester and Linolenic Acid Methyl Esters Contents, European Committee for Standardization, Brussels, 2003.
-
44ReX Powder Diffraction Analysis Software, version 0.8.2; ReXpd Software Ltd., USA, 2016.
-
45ASTM D664-18e2: Standard Test Method for Acid Number of Petroleum Products by Potentiometric Titration, West Conshohocken, PA, 2018.
-
46Emeis, C. A.; J. Catal 1993, 141, 347.
-
47Butem, R.; Kraisingdecha, P.; Sadee, W. In Fluoride and Antimony-Doped Tin Oxide Film by Spray Pyrolysis; Tunkasiri, T., ed.; Trans Tech Publications: Zürich, Switzerland, 2008.
-
48Li, C. C.; Yin, X. M.; Li, Q. H.; Wang, T. H.; CrystEngComm 2011, 13, 1557.
-
49Balachandran, S.; Selvam, K.; Babu, B.; Swaminathan, M.; Dalton Trans 2013, 42, 16365.
-
50Wang, L.; Li, J.; Wang, Y.; Yu, K.; Tang, X.; Zhang, Y.; Wang, S.; Wei, C.; Sci. Rep 2016, 6, 35079.
-
51Yazici, D. T.; Bilgiç, C.; Surf. Interface Anal 2010, 42, 959.
-
52Morterra, C.; Cerrato, G.; Pinna, F.; Meligrana, G.; Top. Catal. 2001, 15, 53.
-
53El-sayed, Y.; Abu-farha, N.; Kanan, S.; Vib. Spectrosc. 2014, 75, 78.
-
54Rabee, A. I. M.; Mekhemer, G. A. H.; Osatiashtiani, A.; Isaacs, M. A.; Lee, A. F.; Wilson, K.; Zaki, M. I.; Catalysts 2017, 7, 204.
-
55Tao, M.; Xue, L.; Sun, Z.; Wang, S.; Wang, X.; Shi, J.; Sci. Rep 2015, 5, 13764.
-
56Sheikh, R.; Choi, M.; Im, J.; Park, Y.; J. Ind. Eng. Chem. 2013, 19, 1413.
-
57Guldhe, A.; Singh, B.; Rawat, I.; Bux, F.; Chem. Eng. Res. Des. 2014, 92, 1503.
-
58Antunes, W. M.; Veloso, C. O.; Henriques, C. A.; Catal. Today 2008, 133, 548.
-
59Kim, M.; Lee, H.-S.; Yoo, S. J.; Youn, Y.-S.; Shin, Y. H.; Lee, Y.-W.; Fuel 2013, 109, 279.
-
60Anbessa, T. T.; Karthikeyan, S.; Int. J. Eng. Adv. Technol. 2019, 9, 1733.
-
61Srilatha, K.; Lingaiah, N.; Devi, B. L. A. P.; Prasad, R. B. N.; Venkateswar, S.; Prasad, P. S. S.; Appl. Catal., A 2009, 365, 28.
-
62Bhoi, R.; Singh, D.; Mahajani, S.; React. Chem. Eng. 2017, 2, 740.
-
63Lee, A. F.; Bennett, J. A.; Manayil, J. C.; Wilson, K.; Chem. Soc. Rev. 2014, 43, 7887.
-
64Antolín, G.; Tinaut, F. V.; Briceno, Y.; Pérez, C.; Ramírez, A. I.; Bioresour. Technol. 2002, 83, 111.
-
65Behzadi, S.; Farid, M. M.; Bioresour. Technol. 2009, 100, 683.
-
66Takase, M.; Chen, Y.; Liu, H.; Zhao, T.; Yang, L.; Wu, X.; Ultrason. Sonochem. 2014, 21, 1752.
-
67Xie, W.; Wang, T.; Fuel Process. Technol. 2013, 109, 150.
-
68Tran, H. L.; Ryu, Y. J.; Seong, D. H.; Lim, S. M.; Lee, C. G.; Biotechnol. Bioprocess Eng. 2013, 18, 242.
-
69Interrante, L.; Bensaid, S.; Galletti, C.; Pirone, R.; Schiavo, B.; Scialdone, O.; Galia, A.; Fuel Process. Technol. 2018, 177, 336.
Publication Dates
-
Publication in this collection
20 Jan 2021 -
Date of issue
Jan 2021
History
-
Received
21 Jan 2020 -
Accepted
17 Aug 2020


