Abstract
This paper proposes a method for defining the levels of work in progress (WIP) in productive environments managed by constant work in process (CONWIP) policies. The proposed method combines the approaches of Computer Simulation and Electre TRI to support estimation of the adequate level of WIP and is presented in eighteen steps. The paper also presents an application example, performed on a metalworking company. The research method is based on Computer Simulation, supported by quantitative data analysis. The main contribution of the paper is its provision of a structured way to define inventories according to demand. With this method, the authors hope to contribute to the establishment of better capacity plans in production environments.
Work in process; CONWIP; Discrete event simulation; Multicriteria decision analysis
Work in process level definition: a method based on computer simulation and electre tri
Isaac PergherI,* * UNIVATES, Lajeado, RS, Brazil ; Guilherme Luís Roehe VaccaroII
Ieng.isaac@hotmail.com, UNIVATES, Brazil
IIguilhermev@unisinos.br, UNISINOS, Brazil
ABSTRACT
This paper proposes a method for defining the levels of work in progress (WIP) in productive environments managed by constant work in process (CONWIP) policies. The proposed method combines the approaches of Computer Simulation and Electre TRI to support estimation of the adequate level of WIP and is presented in eighteen steps. The paper also presents an application example, performed on a metalworking company. The research method is based on Computer Simulation, supported by quantitative data analysis. The main contribution of the paper is its provision of a structured way to define inventories according to demand. With this method, the authors hope to contribute to the establishment of better capacity plans in production environments.
Keywords: Work in process. CONWIP. Discrete event simulation. Multicriteria decision analysis.
1. Introduction
In the competitive business environment, managers of manufacturing industries encounter the challenge every day to produce quality products and provide better services to customers (CHAKRABORTY; GIRI; CHAUDHURI, 2008) taking account lots of information with the constraint of making a decision process as fast as necessary. In intermittent production systems that operate under the make-to-stock (MTS) perspective, especially those with convergent flow (referred as type A according to Umble and Srikanth (1990), the possibility of forming work-in-process (WIP), inventories of finished products or inventories of raw materials increases the complexity of the management, due the need of using different control procedures to manage each of the different types of stock (SIMCHI-LEVI; KAMINSKY; SIMCHI-LEVI, 2003). In the same context, another aspect that may become significant to the complexity of inventory management is the approach used to handle the flow of materials, since different assumptions lead to different decisions regarding how much, how and where inventories are needed.
By focusing on the alignment of the management of inventories to the demand and capacity plans, considering a production environment that operates in the approach Constant Work-in-process CONWIP (HOPP; SPEARMAN, 2000) to manage the materials' flow, we understand that the use of tools that support decision making approaches, such as Computer Simulation and Multicriteria Decision Support Methods, may contribute to the development of actions focused on inventory management, aiming to provide significant gains in terms of competitive advantage. In this sense, in this article we propose a method that aims to quantify the WIP level, by combining the approaches of Computer Simulation and of the decision support multi-criteria method Electre Tri, that according Dias et al. (2002) is a well-known method to assign a set of alternatives to a set of predefined categories, considering multiple criteria. WIP definition is a multicriterial problem, since it needs to take in account stock and material's flow policies, inventory costs, risks of production shortage, desired service levels, the variability of production processes and other intrinsic characteristics of production systems.
To justify the relevance of the theme proposed in this paper, we carried out a research in several academic and technical databases, including the following magazines and annals: European Journal of Operational Research; Production and Operations Management; Winter Simulation Conference; Manufacturing Technology Management; Annals of Operations Research; Productivity and Performance Management; Management Science; Advanced Manufacturing Technology; Production Research; Production Economics; Intelligent Manufacturing; Gestão e Produção; Produção; GEPROS; Produção Online; Gestão Industrial; Administração e Inovação; Pesquisa e Desenvolvimento; Revista Brasileira de Pesquisa Operacional; and SPOLM Simpósio de Pesquisa Operacional e Logística da Marinha do Brasil. The time range of the search focused on articles published from January 2005 until November 2011 and the following keywords were used in the search: Constant work-in-process (or CONWIP), Discrete Event Simulation, Multicriteria Decision Analysis. As results we found: (i) 17 articles reporting the use of Conwip combined with different approaches intending to manage production and supply operations; (ii) 15 papers describing and comparing Conwip approaches to other materials' flow management approaches, such as Kanban and MRP, in different areas of application, in the field of Production Engineering; (iii) one study comparing the performance of Multiloop and Single-loop Conwip using Genetic Algorithms; and (iv) 19 papers aiming the quantification of WIP under the light of CONWIP through techniques as Discrete Event Simulation, Dynamic Simulation, Markov Chains, Petri Nets and Queueing Theory. Considering these results, we detected: (i) an evidence of the relevance of the theme for both academy research and applied decision making on organizations; and (ii) a possibility for contributing to this subject due the lack of research dealing simultaneously with the application of multi-criteria decision methods and Computer Simulation to quantify WIP. This encouraged us to propose, refine and test the method presented in this paper.
The remaining sections of this paper are presented as follows: section 2 describes the methodological approach used in this research; section 3 presents an extract from the theoretical framework used in research; section 4 describes the proposed method to quantify the WIP; section 5 presents an application of the proposed method on a metalwork company; and, finally, section 6 presents some conclusions and considerations about this research.
2. Methodological approach
The methodological approach used in this research consisted of the six steps as follows:
-
Literature research, aiming to collect information referring the major concepts, assumptions, strengths and weaknesses, concerning Discrete Event Simulation and Multicriteria Decision Support methods. Additional research was also performed in order to reinforce the concepts discussed during the subsequent steps;
-
Theoretical conception of the proposed method, outlining the theory background and its support to the development of a structured method for WIP definition as intended;
-
Definition of structural elements of the proposed method, which are: (a) the method of conducting simulation projects; (b) the performance indicators used to decision support; and (c) the decision criteria;
-
Definition of the method of determining the level of WIP which combined the information generated in previous steps to establish the mechanisms of operation of the proposed method;
-
Application and Testing, consisting of the application of the proposed method in a real production system and of presenting the method for the analysis and judgment of specialists in the field. This step was designed to generate subsidies to better identify adjustments needed in the structure of the method developed in step (iv); and
-
Analysis of results and Refinement of the proposal, by taking in account the suggestions identified in the previous step as inputs for refinement of the proposed method, leading to the version presented in this paper.
3. Theoretical background
3.1. Computer simulation
Simulation is an effective and widespread methodology providing dynamic visibility in process design and improvement (LAW; KELTON, 2000; KOUVELIS; CHAMBERS; WANG, 2006). According to Pidd (1998), as well as to Law (2005), computer simulation consists of applying a model as basis for exploration and experimentation over reality. As other modeling methodologies, simulation is recommended when complexity, critical issues (as safety) or costs present benefits if compared to experimenting directly with real systems. According Dassisti and Galantucci (2005), the level of complexity and uncertainty in the operation of real manufacturing systems stresses the role that simulation might play in driving appropriate decisions, also for production settings with a low level of flexibility. Simulation can also be used for design and evaluation of new systems, such as to analyze physical layout changes or in the reconfiguration of control or rules of operation of existing systems. It is also a recognized approach for research purposes. Such kind of application has grown in several areas, assisting decision making on complex problems, or providing better understanding of processes in organizations (SAKURADA; MIYAKE, 2009) in the field of Industrial Engineering and Operations Management. Simulation is essentially a statistical approach and, thus, is based on the appropriate collection of data, and on the adequate statistical treatment of inputs and outputs.
However, the success of a project based on Computer Simulation is also based on the use of an adequate method to manage all activities involved in the study. This method shall connect all the steps in an orderly and systematic way, starting from the design of the problem to the evaluation and presentation of results. Some examples of methods of conducting simulation projects that can be observed in the literature are: Pritsker, Sigal and Hammesfahr (1989), Gogg and Mott (1992), Balci (1998), Banks (1998) and Law and Kelton (2000), among others.
In this research we adopted an approach based on the one proposed by Law and Kelton (2000) since it is a widespread method in the literature and present an adequate structure to serve as basis to the method we developed. In its original form, the method proposed by Law and Kelton (2000) and Law (2005) consists of a systematic sequence of 10 steps: (i) formulate the problem to be solved and plan the simulation project; (ii) collect the data and define a conceptual model; (iii) conceptual model validity; (iv) construct a computer model and verify; (v) make pilot runs; (vi) programmed model validation; (vii) design experiments; (viii) make production runs; (ix) analyze output data; and (x) document, present, and use results. Examples of research that used this method in production environments are: Amini et al. (2007), Pergher and Vaccaro (2009), Greasley (2005), Pergher, Deus and Rossi Filho (2009), among others.
3.2. The ELECTRE TRI multicriteria method
According to Costa et al. (2007), Electre Tri (preconized by Wei Yu, 1992 aims to solve sorting classification problems, or, in other words, to rank alternatives in a set of viable alternatives in classes which maintain a preference relation amongst them. For Gomes, González Araya and Carignano (2004), Electre Tri classifies the various alternatives for solving a problem by comparing each potential alternative to a reference alternative. As examples of application of Electre Tri in different environments, and of its relationship with other approaches, one can find Brito, Almeida and Mota (2010), Szajubok, Alencar and Almeida (2006), Campos and Almeida (2010), Gomes and Costa (2008), Doumpos and Zopounidis (2002), Costa, Santafé Júnior and Haddad (2007), Neves and Costa (2010) and Mousseau, Slowinski and Zielniewicz (2000); among others.
Electre Tri method uses the concept of pseudo-criteria to establish subordination relations (COSTA et al., 2007). According to Miranda and Almeida (2003), the use of a preference pseudocriteria structure avoids the sudden passing between states of indifference and strict preference. Thus, preferences for each criterion are defined by a pseudo-criterion in which the preference and indifference thresholds pj[gj(bh)] and qj[gj(bh)] constitute the intra-criteria information: qj[gj(bh)] specifies the biggest difference [gj(a) - gj(bh)], which still preserves indifference between states a and bh considering the criterion gj; and pj[gj(bh)] represents the smallest difference [gj(a) - gj(bh)], consistent with a preference to the state a, considering the same criterion gj. In situations in which zero is used as threshold of preference and indifference, this concept is referred as 'truth criteria' instead of pseudocriteria.
The classification of alternatives is performed, in Electre Tri, by following two steps (COSTA et al., 2007): (i) the construction of a subordination relation, S, which characterizes how the alternatives are compared regarding the class boundaries; and (ii) the exploration (through classification procedures) of the relation S. For Costa, Soares and Oliveira (2004), the subordination relation, S, is built to make possible the comparison of a state 'a' (reference state) with the standard thresholds of another state, bh. This procedure is done by validating (or not) statements such as aSbh, which means 'a is subordinated by bh'. According to Miranda and Almeida (2003), to validate the assertion aSbh (or bhSa) one must examine two conditions: (i) Concordance: for aSbh (or bhSa) to be accepted, most of the criteria must support this claim; and (ii) Non-discordance: when the concordance condition is not met, none of the criteria must oppose the assertion aSbh (or bhSa).
Finally, regarding to the procedures used to build the relationship of subordination, aSbh (or bhSa), further information can be found in Costa, Santafé Júnior and Haddad (2007), Gomes, González Araya and Carignano (2004) and Costa, Soares and Oliveira (2004).
4. The Proposed method for WIP definition
As indicated before, the proposed method consists of eighteen steps, combining the approaches of Computer Simulation and Electre Tri in order to support the WIP level definition on productive systems managed by CONWIP policies. Figure 1 presents the structure that articulates all the steps of the method of determining the WIP. In this session each step is better detailed.
4.1. Initiation procedures
The first step of the proposed method aims to describe the elements that are adamant for the quantification of WIP, emphasizing the use of the approaches outlined in Figure 1: Computer Simulation and Electre Tri. It is important to notice that a practice not covered by the structure of the method refers to the replacement or deletion of the elements described above. Under this approach, we highlight two aspects: (i) the proposal allows adding specific criteria to study the production process in the framework of criteria suggested by the method, this condition being discussed in Step 2; and (ii) the determination of costs in this proposal is guided by the premises of the Theory of Constraints (GOLDRATT, 1991). However, costs related to (i) stock of finished products ('stock $ day'), and (ii) work-in-process ('Investment in WIP'), can be substituted by others based on the principles of costs measurement used by the organization. This step also regards the setting of the appropriate environment conditions to the application of the method: (i) definition of the project team; (ii) ensuring clearance about the objectives of the project; (iii) ensuring appropriate support and resources from the organization for the development of the project.
4.2. Use additional criteria, intrinsic to the environment under study
At this stage it is recommended that decision-makers (responsible for judging the value of the alternative scenarios about the WIP level) and analysts (responsible for effecting the computer simulation model and make recommendations regarding the decision-making) consider the following question: "Is it necessary to increase the set of criteria recommended by the method, adding other decision criteria specific to the production environment under study?" The importance of this analysis may be justifiable in situations where decision-makers wish to consider decision criteria which are particular to their production system or strategy. If new criteria will be used, it is important to observe the attendance to the following axioms (GOMES; GOMES; ALMEIDA, 2002):(i) representation only of relevant attributes to the study; (ii) no redundancy of criteria; and (iii) independence of criteria.
For this paper, decision criteria are understood as related to the set of rules that are assigned to performance indicators in order to elucidate the importance, or preferences, to the decision-maker, facing a group of scenarios to choose from. In summary, for each decision criteria established, there should be a relative performance indicator, which must be incorporated into the simulation model and into the decision matrix. Thus, it is necessary to complete the analysis concerning the use or absence of additional criteria before starting the execution of subsequent steps. Otherwise, later unplanned changes in this set may lead to rework, and increase in the time of application of the method.
As illustrated in Figure 1, at the end of the analysis suggested in Step 2, the method proposes to determine the importance coefficients (weights) for the criteria kj (to be used in Step 13), as well as to execute the following activities: (a) development of computer simulation model; (b) design the scenario experiments; (c) analysis of output data; and (d) structuring the performance matrix for the scenarios' analysis. These activities are explained in steps 3 to 12.
4.3. Conceptual modeling and data collection
This step comprises: (a) devising a conceptual simulation model; and (b) to identify and perform the adequate data collection for the simulation model. In order to assist in the design of the conceptual simulation model, a set of elements for delineating the main features of the real system, shall be considered: (i) performance measures to enable the assessment of Little's Law (LITTLE, 1961), demand service rate (HOPP; SPEARMAN, 2000), investment in WIP, gain $ days in arrears (KENDALL, 2007), stock $ days (KENDALL, 2007), turnover of finished goods inventory (HOPP; SPEARMAN, 2000), and WIP turnover (HOPP; SPEARMAN, 2000), as well as other indicators related to specific criteria to the environment under study (as defined in Step 2); (ii) variables as availability of equipment (for instance, distribution models for Time To Fail and for Time To Repair), resources capacities, and volume of the stock of finished products; (iii) variables to understand and represent the adopted policies and constraints for production scheduling (HOPP; SPEARMAN, 2000); (iv) variables and rules to represent CONWIP policies, as an approach to manage the flow of materials; and (v) resources allocated in a proper way to fulfill the deadline, as well as the budget, for implementing the study. The last consideration is stated because the level of detail of features can cause an undesirable increase in the time of modeling, as well as ordering skilled labor in a way that overpass the original budget. It is worth noting that the definition of the characteristics to be modeled is biased by computational restrictions, which represents a method limitation.
Substantiated by the parameters earlier presented, conceptual modeling is executed, in order to delineate the characteristics required from the real environment to quantify the WIP levels. Conceptual model construction is performed concomitantly to data collection, responsible for providing the information needed to parameterize the variables in the simulation model, as well as for its validation (Step 8). In this context, we recommend the collection of: (i) demand data for each product in the product mix considered by time unit considered; (ii) specific data from the production process, such as processing times (or cycle times), setup times, setup restrictions, number of operators, distribution of Times To Failure and Times To Repair, among others, depending on the details outlined in the conceptual model; and (iii) data to validate the computational model, such as indicators for WIP level, lead times, etc.
As possible sources to determine the required data we suggest: aggregate production plans; production reports; techniques of "time and method" studies (BARNES, 1995); and production process observation, amongst others. Finally, we recommend the creation of a database, which will be utilized to support present and future studies, by providing reliable data for validation of the computer models and comparing the outputs with data collected in the real environment through statistical analysis such as confidence intervals or other quantitative techniques (LAW; KELTON, 2000).
4.4. Data treatment
This step refers to preparing the collected data in an appropriate way to feed the computer simulation model. So, it comprehends the fitting of adequate probability distributions to random data, tabulation of processing parameters, etc. We suggest, if possible, integrating the results of data treatment to the database mentioned at the previous step, in order to maintain historic and logic relationship between data and metadata, enabling a process more suitable to knowledge management. Although this can be a relevant issue, we do not extend this discussion in this paper, since it is not the focus of the paper.
4.5. Validation
The subject of validation is to assess the conceptual model in terms of representativeness of the characteristics of the real environment. In this sense, it is proposed to perform a compliance analysis, aiming to confront the conceptual model to the set of requirements presented in Table 1. Depending on the result obtained in the analysis, three possible alternatives can be pointed, as shown in Figure 1: (i) to start the construction of the simulation model (Step 6), if the information related to the conceptual model, as well as the collected data are accepted as consistent with the proposals suggested in the previous steps; (ii) to return to Step 2, if detected the necessity of reevaluate rules, recollect data, or modify the list of additional criteria. In such case, one shall remember to evaluate the influences of such changes in the definition of the weights for the criteria kj; and (iii) if considered necessary to perform any type of change in the conceptual model and carry out new procedures of data collection, to return to Step 3.
4.6. Construction and verification of the computational model
This step aims to transcribe the characteristics outlined in the conceptual model in a computational model, by using the following inputs: (i) demand data from product mix; (ii) specific data from the production process; and (iii) the adequate statistical representation of random variables and parameters, as determined in Step 4. The model so generated must be verified in order to ensure its adequacy to the conceptual model.
4.7. Pilot runs
As in other simulation studies, pilot runs are performed with the computer model in order to generate output data, which will be used in Step 8 to validate the model. At this step, if necessary, time must be set to warm up the model, in order to avoid distortions in the output, which can be caused by the initial state of the simulation model.
4.8. Validation
According to Law (2005), validation of a computational model can be obtained by comparing the observations in the real environment with the simulation results. Also, it can be assisted by statistical techniques. Under this approach, the construction of confidence intervals is one of the statistical procedures that can be applied, as pointed out by Balci (1998), Law and Kelton (2000), Law (2005) and Sargent (2009), amongst others. It is worthy to note that Chung (2003) presents other statistical techniques that also aim to support the process of validating the computer model.
Based on the results obtained at this stage, three possible alternatives are indicated, as shown in Figure 1: (i) if programming problems or bugs were detected, then return to Step 6 and correct the inconsistencies; (ii) if the computational model is validated, then start the design of scenarios' experiments; and (iii) if is detected the need for more significant changes (such as inconsistent behaviors of the model in relation to the system), then return to Step 3.
4.9. Scenario planning
In Step 9, we suggest that the structure of the scenarios to be tested should be guided by the following independent variables: (i) the level of WIP process; and (ii) the amount of stock of finished products, considering the product mix studied. However, variables as availability of equipment, demands of the sales mix, and productive capacity can also be used to increase the configuration settings, if feasible within the scope of the study.
Finally, in this step the following parameters for each simulated scenario shall be defined (LAW; KELTON, 2000): number of replications; starting conditions; and number of independent simulations using different random numbers and level of significance for the convergence of statistics.
4.10. Productive runs
This step consists in implementing the simulation plan defined in Step 9. Thus, for each scenario, it is necessary to adjust the parameters of the simulation model, and to perform the productive runs. At the end of the replications, collect the data output of each performance indicator to be latter analyzed in the next step.
4.11. Output data analysis
In Step 11 we recommend the application of statistical techniques such as univariate analysis of variance ANOVA (HAIR et al., 2009) and nonparametric Kruskal-Wallis test to examine the occurrence of significant differences in the averages of the output data that were generated by the following meters (dependent variables): (i) production lead time (CT) (LITTLE, 1961); (ii) effective production rate or throughput (LITTLE, 1961); (iii) investment in WIP; (iv) demand service rate (HOPP; SPEARMAN, 2000); (v) gain $ days in arrears (KENDALL, 2007); (vi) stock $ day (KENDALL, 2007); (vii) inventory turnover of finished goods (HOPP; SPEARMAN, 2000); (viii) WIP turnover (HOPP; SPEARMAN, 2000); and (ix) indicators that represent the additional criteria (as defined in Step 2); considering the different simulated scenarios.
As shown in Figure 1, at the end of the output data analysis, two different paths can be followed: (i) given the lack of evidence to affirm that at least some average of a simulated scenarios shows significant differences from the others (for all performance indicators), the next procedure to be accomplished is decision making (Step 18); (ii) alternatively, being possible to affirm that at least one average indicators presents significant difference from other scenarios (hopefully at least for two performance indicators), to perform the steps concerning decision-making, assisted by the Electre Tri method.
4.12. Scenario performance matrix definition
Step 12 focuses on the composition of the matrix performance of the scenarios, which consists of a table that describes the outcome (performance) of each simulated scenario, in terms of measures of central tendency (derived from the descriptive statistics), calculated based on data output generated in Step 10, in the light of the following set of indicators: (i) effective production rate or throughput; (ii) investment in WIP; (iii) inventory turnover of finished goods; (iv) gain $ days in arrears; (v) stock $ day; and (vi) indicators related to additional criteria (Step 2). Table 2 shows the structure of the performance matrix for the scenarios that should be the result of Step 12.
To build the matrix illustrated in Table 2, it is suggested to use the following procedure: to calculate the coefficient of variation Cv of the output data that allude to each of the performance indicators gj (g = 1,..., j),distinguishing the treatment by the scenario at (t = 1,..., s). Then, based on the rates Cv obtained in each vector gjat, measures of central tendency are named, observing the following conditions: (a) for Cv > 0.3 it is suggested to use the median to represent each group of output data; (b) otherwise, it is suggested to use the average to represent each group of output data. Subsequently, the statistical measures are calculated (mean or median) for each vector gjat. Finally, the results are outlined in the performance matrix, considering the allocation axes: (a) performance indicators gj; and (b) scenarios tested at.
4.13. Criteria weight definition
This step is responsible for setting up the preferences of the group of decision-makers in the form of the coefficients of importance (weights) for each of the following decision criteria: (i) investment in WIP; (ii) effective production rate or throughput (HT); (iii) inventory turnover of finished goods; (iv) gain $ days in arrears; (v) stock $ day; and (vi) indicators related to additional criteria (Step 2).
4.14. Equivalence classes composition
This step consists of defining the limits of the equivalence classes (or set of categories) which serve as indicative for the Electre Tri method sorting the scenarios, in the light of multiple criteria. In this context, it is suggested the composition of three classes (named C1, C2 and C3) preferably arranged so that the class C1 alludes to the scenarios that have the worst performance results in the light of the most important criteria.
To establish the three equivalence classes, it is necessary to define the upper and lower limits for each class, for all decision criteria. In this sense, the analyst can adjust the rates empirically, considering the results outlined in the performance matrix of scenarios (as defined in Step 12) based on information arising from: (a) historical standards representing results achieved in the past; (b) standard targets representing levels of performance that are seen as appropriate or acceptable; and (c) performance standards defined by competitors based on performance results from competitors of the organization.
4.15. Set the thresholds of preference (p), indifference (q) and veto (v)
This step aims to determine the values for the thresholds of preference (p), indifference (q) and veto (v) for each profile reference established in the previous step. However, based on Dias and Mousseau (2002), Gomes, González Araya and Carignano (2004), Gomes and Costa (2008), Neves and Costa (2010) and Hora et al. (2008), it is not usual to present a structured methodology that guides the determination of the thresholds p, q, v. Thus, it is suggested the initial results to be generated through the use of truth criteria. Thereafter, the thresholds can be refined, considering: (i) the theoretical framework described in Section 3.2; (ii) the scenario performance matrix (Step 12); (iii) the thresholds of the equivalence classes (defined in Step 14); and (iv) the impact on the behavior of the decision model (in terms of changes in ratings), which may be weighted by a sensitivity analysis, as recommended in Step 17.
4.16. ELECTRE TRI execution
In this step, the classification of the different simulated scenarios in accordance to the parameters indicated in steps 13, 14 and 15, as well as the array of effective performance of the scenarios in Step 12 shall be performed, as sketched in Figure 1. It is suggested that the initial results are obtained considering a cutoff λ = 0.5 as a first estimate, and then subsequently increasing the cutoff for support the sensitivity analysis step. Readers can consult Szajubok, Alencar and Almeida (2006) for more information about this procedure.
4.17. Sensitivity analysis of the results
Based on the classification obtained in the previous step, as stated in the reference literature, we recommend the execution of a sensitivity analysis, aiming to: (a) evaluate the robustness of the model for the imposed changes; and (b) provide evidence that support the adjustment of parameters shown in steps 13, 14 and 15. The purpose of sensitivity analysis is to support the decision-makers regarding the results provided by the decision model in accordance to the changes in the following parameters: (i) cut-off level λ, for λ ∈ [0.5, 1]; (ii) limits of equivalence classes; (iii) weights of the kj criteria; and (iv) threshold p, q, v. For instance, as examples (MIRANDA; ALMEIDA, 2003), one can: (a) change the cutoff level from 0.5 to 0.6; (b) extend the boundaries of classes gj(b1) and gj(b2) in 5%; and (c) change in 20% the weight of each criterion used in the study.
Figure 1 shows that Step 17 has a connection with steps 13 (Criteria weight definition), 14 (Equivalence classes composition) and 15 (Set the thresholds of preference (p), indifference (q) and veto (v)). These connections are intended to remember that possible changes in the values of the parameters mentioned in the previous paragraph result in the necessity of perform new replications (Step 16) under new parameters, based on subjective evaluation of the decision-makers from the classifications obtained in the previous replications. Also, as shown in Figure 1, Step 17 has a connection with Step 9 (Scenario planning). This condition is indicated in the existence of incomparability of results, in which the solution through changes in the parameters addressed in steps 13, 14 and 15 would provide a level λ which does not meet the expectations of decision-makers. In such case, it becomes possible to go back to Step 9 and establish alternative configurations of scenarios in order to solve the existing incomparability.
At the end of the sensitivity analysis, the main output is a plan that characterizes the results of different simulated scenarios in the light of the equivalence classes C1, C2 and C3, which is used in Step18 to support decision-making.
4.18. Decision support
In this final stage, the scenario that will be used in the production environment is determined, considering: (i) the plan of results generated in step 17 in conjunction with information from the CT indicators for each type of product; WIP turnover and demand service rate; and (ii) the results obtained in Step 11, referring to the absence of significant differences for the performance indicators amongst the analyzed scenarios. In particular, in this latter situation, decision-makers can choose the configuration scenario to be implemented in the system, considering the cost of WIP.
This concludes the description of the proposed method for WIP level definition. Next section presents an application of this method in a real production process, in order to better highlight the possible contributions and key elements of the proposed approach.
5. Application in a metal-mechanical company
The proposed method was applied to a production line of a medium size Brazilian metal mechanical company. The company has 2.050 employees in 4 factories in the states of Rio Grande do Sul and Santa Catarina having a sales mix consists of 2.000 products, considering items produced by the own company and imported products that are then sold in smaller quantities. The proposed method was applied to a production line dedicated to the manufacturing of four different products (here nominated as A, B, C, D) and consisting mainly of six operations. The preference for studying this line is based on the 22% increase in the total demand of the products, when compared with the last year.
By focusing on the environment under study, it is possible to highlight the following features: (i) the company develops every six months an aggregated plan that specifies the monthly demand of each of the 23 products it commercializes (including the four products tested in this study); (ii) based on this aggregated plan, the sector of Production Planning, Programming and Control (PPPC) runs the weekly schedule of the line; and (iii) the items are produced and stored in batches with standard amounts, flowing along the process steps to the final inventory by using containers, which contain specific fixed amounts for each product; (iv) the flow is controlled by a CONWIP approach.
As results of the application of the method proposed in this paper, Table 3 presents the performance matrix that was developed to analyze 15 alternative scenarios, considering different configurations of demand for the products and admitted WIP level.
The weights of the criteria used in this application are presented in Table 4 and were defined by the research team in association with the PPPC managers of the company.
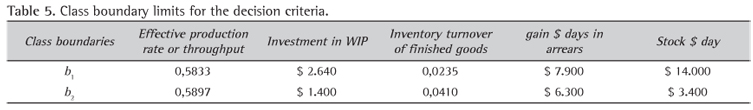
Table 5 shows the values for the limits between each pair of the three equivalence classes, e.g. C1 b1 C2 b2 C3. The data presented in Tables 3, 4 and 5 were modeled in IRIS software.
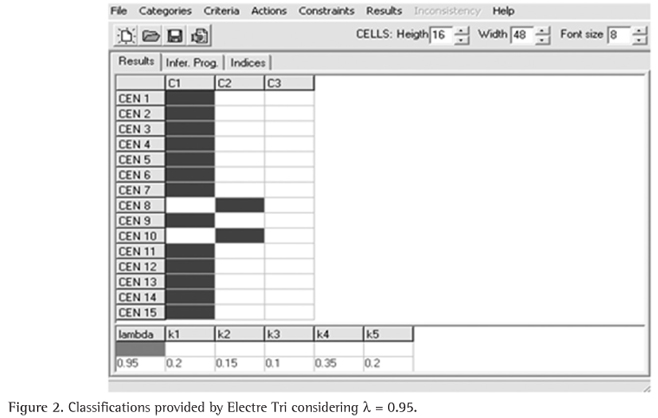
A sensitivity analysis was performed and, different cutoff parameters λ were used. With λ = 0.5 scenario 8 was classified more likely to belonging to class C3, while scenarios 2, 4, 6, 7 9, 10 and 12 were classified more likely in class C2, the remaining others in class C1. With λ = 0.95, the scenarios 8 and 10 were categorized in class C2 while all the others remaining in class C1, as presented in Figure 2.
To select the scenario to be used, the decision-makers have used the classification proposed by IRIS, in addition to the information generated by the performance indicators: (i) CT for each type of product; (ii) WIP turnover; and (iii) demand service rate. From this information, decision-makers chose to configure the production environment in accordance to Scenario 8, considering that it presents superior performance in the three performance meters listed above as well as in the gain $ day in arrears meter if compared to Scenario 10.
As a qualitative evaluation from the decision-makers regarding the proposed method, the perception was that there is, despite the considerable effort of simulation modeling and application of multi- decision technique, advantages in terms of information generation potential from the proposed method to support the position of decision-makers.
6. Final remarks
In production environments operating under the intermittent MTS convergent flow policies, the possibility of generating work-in-process inventories, finished goods inventories, or raw materials inventories can rapidly increase the complexity of production management because of the need of using different control procedures to handle each of the different types of stock (SIMCHI-LEVI; KAMINSKY; SIMCHI-LEVI, 2003). Yet another aspect that may contribute to the complexity of inventory management is the approach used to manage the flow of materials. Thus, by focusing on the alignment of the management of inventories to demand plans and capacity in a CONWIP environment (HOPP; SPEARMAN, 2000) to manage the flow of materials, the use of approaches that support decision making, such as computer simulation and multi-criteria decision support methods, may contribute to the development of actions aimed at inventory management.
In this sense, in the present study we aimed to present a contribution to the field, as a method combining computer simulation and the Electre Tri multi-criteria method in order to support the decision making related to specify the WIP level. The proposed method produces concrete artifacts which support, in an objective way, decision-making. Yet the approach can be cumbersome in complex environments, we consider worthy to notice that: (i) this approach is meant to be used on strategic-tactical levels: the decision of the WIP level are related to production policies definition and subsequent decisions can lead investments in infrastructure or other strategic-tactical definitions; (ii) the simulation models and decision-making model created can be also used to evaluate other scenarios for the WIP, as well as for the finished goods inventory or raw materials inventory. Also, once established the models, with considerable little effort, decision-makers can establish new scenarios for analyzing features such as: increased demand, entry of new items in the product mix, changes in the distributions of times or yield rates, changes in productive capacity, prioritization of orders, amongst others. Finally, the method proposed in this paper could provide a basis to test such alternative scenarios, being a means of assisting the company's strategic-tactical decisions in the medium and long term, which contributes to decision making with greater focus on their goals. This suggestion, nevertheless, needs more studies and is left for future work.
Acknowledgement
The authors wish to thank the Coordination for the Improvement of Higher Education Personnel (CAPES) for the sponsoring of the research project relates to this paper.
Recebido 14/07/2012
Aceito 13/11/2012
- AMINI, M. et al. Simulation modeling and analysis: a collateral application and exposition of RFID technology. Production and Operations Management, v. 16, p. 586-598, 2007. http://dx.doi.org/10.1111/j.1937-5956.2007.tb00282.x
- BALCI, O. Verification, validation and testing. In: BANKS, J. (Org.). Handbook of simulation: principles, methodology, advances, applications, and practice. New York: John Wiley and Sons, 1998.
- BANKS, J. (Org.). Handbook of simulation: principles, methodology, advances, applications, and practice. New York: John Wiley and Sons, 1998.
- BARNES, R. M. Estudo de movimentos e de tempos: Projeto e medida do trabalho. 6. ed. São Paulo: Edgard Blücher, 1995.
- BRITO, A. J.; ALMEIDA, A. T.; MOTA, C. M. M. A multicriteria model for risk sorting of natural gas pipelines based on Electre Tri integrating Utility Theory. European Journal of Operational Research, v. 200, p. 812-821, 2010. http://dx.doi.org/10.1016/j.ejor.2009.01.016
- CAMPOS, A. C. S. M.; ALMEIDA, A. T. Using multiple criteria decision analysis for supporting decisions of Business Process Management. In: IEEE INTERNATIONAL CONFERENCE INDUSTRIAL ENGINEERING AND ENGINEERING MANAGEMENT, 2010, Macao. Proceedings.. IEEE, 2010. p. 52-56. http://dx.doi.org/10.1109/IEEM.2010.5674424
- CHAKRABORTY, B.; GIRI, C.; CHAUDHURI, K. S. Production lot sizing with process deterioration and machine breakdown. European Journal of Operational Research, v. 185, p. 606-618, 2008. http://dx.doi.org/10.1016/j.ejor.2007.01.011
- CHUNG, C. A. Simulation modeling handbook: a practical approach. Seabrook: CRC Press LLC, 2003.
- COSTA, H. G.; SOARES, A. C.; OLIVEIRA, P. F. Avaliação de transportadoras de materiais perigosos utilizando o método Electre Tri. Gestão & Produção, v. 11, p. 221-229, 2004. http://dx.doi.org/10.1590/S0104-530X2004000200008
- COSTA, H. G. et al. Electre Tri aplicado a avaliação da satisfação de consumidores. Produção, v. 17, p. 230-245, 2007. http://dx.doi.org/10.1590/S0103-65132007000200002
- COSTA, H. G.; SANTAFÉ JÚNIOR, H. P. G.; HADDAD, A. N. Uma contribuição do método Electre Tri à obtenção da classificação de riscos industriais. Investigação Operacional, v. 27, p. 179-197, 2007.
- DASSISTI, M.; GALANTUCCI, L. M. Pseudo-fuzzy discrete-event simulation for on-line production control. Computers & Industrial Engineering, v. 49, p. 266-286, 2005. http://dx.doi.org/10.1016/j.cie.2004.12.015
- DIAS, L. C.; MOUSSEAU, V. IRIS: um SAD para problemas de classificação baseado em agregação multicritério. In: CONFERÊNCIA DA ASSOCIAÇÃO PORTUGUESA DE SISTEMAS DE INFORMAÇÃO, 3., 2002, Coimbra. Anais... Coimbra, 2003.
- DIAS, L. et al. An aggregation/disaggregation approach to obtain robust conclusions with ELECTRE TRI. European Journal of Operational Research, v. 138, p. 332-348, 2002. http://dx.doi.org/10.1016/S0377-2217(01)00250-8
- DOUMPOS, M.; ZOPOUNIDIS, C. Multi-criteria classification methods in financial and banking decisions. International Transactions in Operational Research, v. 9, p. 567-81, 2002. http://dx.doi.org/10.1111/1475-3995.00374
- GOGG, T. J.; MOTT, J. R. Improve Quality and Productivity with Simulation JMI Consulting Group, 1992.
- GOLDRATT, E. M. A síndrome do palheiro: garimpando informações num oceano de dados. São Paulo: IMAM, 1991.
- GOMES, L. F. A. M.; GOMES, C. F. S.; ALMEIDA, A. T. Tomada de decisão gerencial: enfoque multicritério. São Paulo: Atlas, 2002.
- GOMES, L. F. A. M.; GONZÁLEZ ARAYA, M. C.; CARIGNANO, C. Tomada de decisões em cenários complexos: Introdução aos Métodos Discretos do apoio Multicritério à Decisão. São Paulo: Pioneira Thomson Learning, 2004.
- GOMES, A. R.; COSTA, H. G. Potencial de consumo municipal: uma abordagem Multicritério. Sistemas & Gestão, v. 3, p. 233-249, 2008.
- GREASLEY, A. Using system dynamics in a discrete-event simulation study of a manufacturing plant. Journal of Operations & Production Management, v. 25, p. 534-548, 2005. http://dx.doi.org/10.1108/01443570510599700
- HAIR JUNIOR, J. F. et al. Análise multivariada de dados 9. ed. Porto Alegre: Bookman, 2009.
- HOPP, W. J.; SPEARMAN, M. L. Factory Physics: foundations of manufacturing management. 2nd ed. Boston: McGraw-Hill, 2000.
- HORA, H. R. M. et al. Uma abordagem multicritério para classificação de softwares de matemática. In: ENCONTRO NACIONAL DE ENGENHARIA DE PRODUÇÃO, 28., 2008, Rio de Janeiro. Anais.. Rio de Janeiro, 2008.
- KENDALL, G. I. Visão Viável - Transformando Faturamento em Lucro Líquido. Porto Alegre: Bookman, 2007.
- KOUVELIS, P.; CHAMBERS, C.; WANG, H. Supply chain management research and Productions and Operations Management: Review, trends, and opportunities. Production and Operations Management, v. 15, p. 449-469, 2006. http://dx.doi.org/10.1111/j.1937-5956.2006.tb00257.x
- LAW, A. M.; KELTON, W. D. Simulation modeling and analysis 3rd ed. Boston: McGraw-Hill, 2000.
- LAW, A. How to build valid and credible simulations models. In: CONFERENCE ON WINTER SIMULATION, 37., 2005, Orlando. Proceedings.. Orlando, 2005. http://dx.doi.org/10.1109/WSC.2005.1574236
- LITTLE, J. D. C. A Proof for the Queuing Formula: L= λW. Operations Research, v. 9, p. 383-387, 1961. http://dx.doi.org/10.1287/opre.9.3.383
- MIRANDA, C. M. G.; ALMEIDA, A. T. Avaliação de pós-graduação com método Electre Tri - o caso de Engenharias III da CAPES. Produção, v. 13, p. 101-112, 2003. http://dx.doi.org/10.1590/S0103-65132003000300009
- MOUSSEAU, V.; SLOWINSKI, R.; ZIELNIEWICZ, P. A user-oriented implementation of the Electre-Tri method integrating preference elicitation support. Computers & Operations Research, v. 27, p. 757-777, 2000. http://dx.doi.org/10.1016/S0305-0548(99)00117-3
- NEVES, R. B.; COSTA, H. G. Avaliação do desempenho de gerenciamento de projetos utilizando o método Electre Tri. In: SIMPÓSIO DE PESQUISA OPERACIONAL E LOGÍSTICA DA MARINHA, 13., Rio de Janeiro. Anais.. Rio de Janeiro, 2010.
- PERGHER, I.; DEUS, A. D.; ROSSI FILHO, T. A. Aplicação da Simulação Computacional em um processo de medição de produtos em máquinas por coordenadas: Estudo de Caso. In: SIMPÓSIO DE ENGENHARIA DE PRODUÇÃO, 16., Bauru. Anais.. Bauru,2009.
- PERGHER, I.; VACCARO, G. L. R. Determinação da capacidade produtiva de uma empresa de alimentos por meio da aplicação da Simulação Computacional. In: SIMPÓSIO DE PESQUISA OPERACIONAL E LOGÍSTICA DA MARINHA, 11., Rio de Janeiro. Anais.. Rio de Janeiro, 2009.
- PIDD, M. Modelagem empresarial: ferramentas para tomada de decisão. Porto Alegre: Bookman, 1998.
- PRITSKER, A. A. B.; SIGAL, C. E.; HAMMESFAHR, R. D. J. Modeling and Simulation Process SLAM II Network Models for Decison Support, Prentice Hall, 1989.
- SAKURADA, N.; MIYAKE, D. I. Aplicação de simuladores de eventos discretos no processo de modelagem de sistemas de operações de serviços. Gestão & Produção, v. 16, p. 25-43, 2009. http://dx.doi.org/10.1590/S0104-530X2009000100004
- SARGENT, R. G. Verification and validation of simulation models. In: CONFERENCE ON WINTER SIMULATION, 41., 2009. Proceedings.. 2009.
- SIMCHI-LEVI, D.; KAMINSKY, P.; SIMCHI-LEVI, E. Cadeia de Suprimentos: projeto e gestão. Porto Alegre: Bookman, 2003.
- SZAJUBOK, N. K.; ALENCAR, L. H.; ALMEIDA, A. T. Modelo de gerenciamento de materiais na construção civil utilizando avaliação multicritério. Produção, v. 16, p. 303-318, 2006. http://dx.doi.org/10.1590/S0103-65132006000200010
- UMBLE, M.; SRIKANTH, M. L. Synchronous manufacturing Cincinnati: South-Western Publishing CO, 1990.
Publication Dates
-
Publication in this collection
10 Sept 2013 -
Date of issue
Sept 2014
History
-
Received
14 July 2012 -
Accepted
13 Nov 2012