
Abstract
Paper aims
Based on challenges faced in real SPC application, this paper considers implementation and performance of self-starting methodology in multivariate process monitoring.
Originality
Traditional omnibus charts depend on in-control process parameters while parameters are generally known. However, in real settings, this information may not exist. This paper proposes and compares novel methods to overcome this difficulty.
Research method
This paper introduces, evaluates the performance and implements multivariate self-starting charts (SSMEC, SSMELR, and SSMME) for multivariate process monitoring.
Main findings
Proposed SSMME chart is the best choice in real application because it proves better performance in response to various simulation scenarios and gives diagnostic tools for further analysis.
Implications for theory and practice
The main contributions are the comparison of different self-starting approaches and introducing a novel multivariate self-starting chart that are suitable in real process monitoring and illustrate the benefit of the selected SPC chart with hypertension monitoring.
Keywords
Multivariate quality control; Self-starting method; Single control chart; Hypertension monitoring
1. Introduction
SPC methods have been a critical tool for monitoring a process, detecting out-of-control signals, and identifying assignable causes in a complex system. Real time monitoring requires considering multiple quality characteristics and complex relationships that can be done with a multivariate approach. In addition, it is well known manifestations of complex relationships among quality characteristics can be represented in the type of mean change alone, variability change alone, or combined changes of mean and variability. If we ignore these challenges, the assignable cause can be masked by the unsuspected change in quality characteristics having complex structures. To respond these challenges, traditionally separate charts have been utilized to monitor process mean and variability (Alt, 1985Alt, F. B. (1985). Multivariate quality control. In S. Kotz & N. L. Johnson (Ed.), The encyclopedia of statistical sciences (pp. 110-122). Hoboken: Wiley.). The combination of Hotelling’s chart and generalized variance () chart is widely used practice for multivariate processes. The practice of using separate control charts needs more resources such as quality professionals and time. Alternatively, the omnibus approach considers combining the control chart statistics for mean and dispersion and using this single combination statistic to monitor the process. Since multivariate data streams are more complex and needs more effort to draw conclusions, single control charts provide a simple way of multivariate monitoring. The necessity to develop an omnibus chart for monitoring process mean and variability simultaneously have been recently highlighted (Alt & Smith, 1988Alt, F. B., & Smith, N. D. (1988). 17 multivariate process control. In P. R. Krishnaiah & C. R. Rao Larsen (Eds.), Handbook of statistics (Vol. 7, pp. 333-351). Amsterdam: Elsevier.; Chen et al., 2005Chen, G., Cheng, S. W., & Xie, H. (2005). A new multivariate control chart for monitoring both location and dispersion. Communications in Statistics: Simulation and Computation, 34(1), 203-217. http://dx.doi.org/10.1081/SAC-200047087.
http://dx.doi.org/10.1081/SAC-200047087...
; Li et al., 2010Li, Z., Zhang, J., & Wang, Z. (2010). Self-starting control chart for simultaneously monitoring process mean and variance. International Journal of Production Research, 48(15), 4537-4553. http://dx.doi.org/10.1080/00207540903051692.
http://dx.doi.org/10.1080/00207540903051...
; Maboudou-Tchao & Hawkins, 2011Maboudou-Tchao, E. M., & Hawkins, D. M. (2011). Self-starting multivariate control charts for location and scale. Journal of Quality Technology, 43(2), 113-126. http://dx.doi.org/10.1080/00224065.2011.11917850.
http://dx.doi.org/10.1080/00224065.2011....
; Thaga & Gabaitiri, 2006Thaga, K., & Gabaitiri, L. (2006). Multivariate Max-Chart. Economic Quality Control, 21(1), 113-125. http://dx.doi.org/10.1515/EQC.2006.113.
http://dx.doi.org/10.1515/EQC.2006.113...
).
The related work on the single control charts is summarized as follows: the combination of exponentially weighted moving average (MEWMA) and multivariate exponentially weighted moving covariance matrix (MEWMC) charts, multivariate maximum MEWMA (MME) chart, multivariate maximum (MaxM) chart, multivariate maximum cumulative sum (MMC) chart and likelihood ratio based multivariate exponentially weighted chart (MELR) .
We investigated the two promising approaches of combining mean and variability in this study. The first approach is called the “max” procedure. The basic idea of this method is to convert statistics (mean and variability) to Z scores and find the maximum of these two values for each sampling period then implement a multivariate scheme (Cheng & Thaga, 2005Cheng, S. W., & Thaga, K. (2005). Multivariate Max-CUSUM Chart. Quality Technology & Quantitative Management, 2(2), 221-235. http://dx.doi.org/10.1080/16843703.2005.11673095.
http://dx.doi.org/10.1080/16843703.2005....
; Thaga & Gabaitiri, 2006Thaga, K., & Gabaitiri, L. (2006). Multivariate Max-Chart. Economic Quality Control, 21(1), 113-125. http://dx.doi.org/10.1515/EQC.2006.113.
http://dx.doi.org/10.1515/EQC.2006.113...
). See Cheng & Thaga (2006)Cheng, S. W., & Thaga, K. (2006). Single variables control charts: an overview. Quality and Reliability Engineering International, 22(7), 811-820. http://dx.doi.org/10.1002/qre.730.
http://dx.doi.org/10.1002/qre.730...
for a detailed review. These charts are useful as complex multivariate nature is simplified by the Z score transformation and assisted by a univariate form (Thaga & Gabaitiri, 2006Thaga, K., & Gabaitiri, L. (2006). Multivariate Max-Chart. Economic Quality Control, 21(1), 113-125. http://dx.doi.org/10.1515/EQC.2006.113.
http://dx.doi.org/10.1515/EQC.2006.113...
). Correspondingly, the practitioners can monitor both mean and variability using only a single visual tool. The superiority of these schemes is their ability of giving diagnostic assistance along with the control chart statistics.
The second combination method uses generalized likelihood ratio (GLR) statistic to construct a composite hypothesis of joint change in mean vector and covariance matrix. MELR chart (Zhang et al., 2010Zhang, J., Li, Z., & Wang, Z. (2010). A multivariate control chart for simultaneously monitoring process mean and variability. Computational Statistics & Data Analysis, 54(10), 2244-2252. http://dx.doi.org/10.1016/j.csda.2010.03.027.
http://dx.doi.org/10.1016/j.csda.2010.03...
) was proposed as a way of using GLR as the basis of a multivariate single chart.
Traditional application of statistical process control charts require collecting large datasets for phase I to estimate the parameter information of in-control process. Gathering sufficient in-control process data makes it a big challenge in practice. It requires lots of time, and efforts in collecting data for a single use that aims in estimating process parameters. In addition, it requires to assure that the collected data represents in-control process which might be also challenging in practice. Most of the previous studies of single chart practice consider the process parameters are known or can be estimated. However, this assumption may be violated in real cases. The parameters may not be known a priori or the practitioners may not have adequate information to estimate the parameters. Moreover, using estimates acquired from a special phase I study may harm the performance of the control chart. It is concluded that the effect of the estimated parameters on the performance of control charts may be significantly high and less predictable (Holmes & Mergen, 1993Holmes, D. S., & Mergen, A. E. (1993). Improving the performance of the T^2 control chart. Quality Engineering, 5(4), 619-625. http://dx.doi.org/10.1080/08982119308919004.
http://dx.doi.org/10.1080/08982119308919...
; Jones et al., 2001Jones, L. A., Champ, C. W., & Rigdon, S. E. (2001). The performance of exponentially weighted moving average charts with estimated parameters. Technometrics, 43(2), 156-167. http://dx.doi.org/10.1198/004017001750386279.
http://dx.doi.org/10.1198/00401700175038...
, 2004Jones, L. A., Champ, C. W., & Rigdon, S. E. (2004). The run length distribution of the CUSUM with estimated parameters. Journal of Quality Technology, 36(1), 95-108. http://dx.doi.org/10.1080/00224065.2004.11980254.
http://dx.doi.org/10.1080/00224065.2004....
; Jensen et al., 2006Jensen, W. A., Jones-Farmer, L. A., Champ, C. W., & Woodall, W. H. (2006). Effects of parameters estimation on Control Charts properties: a literature review. Journal of Quality Technology, 38(4), 349-364. http://dx.doi.org/10.1080/00224065.2006.11918623.
http://dx.doi.org/10.1080/00224065.2006....
; Faraz et al., 2015Faraz, A., Woodall, W. H., & Heuchenne, C. (2015). Guaranteed conditional performance of the S 2 control chart with estimated parameters. International Journal of Production Research, 53(14), 4405-4413. http://dx.doi.org/10.1080/00207543.2015.1008112.
http://dx.doi.org/10.1080/00207543.2015....
; Zwetsloot & Woodall, 2017Zwetsloot, I. M., & Woodall, W. H. (2017). A head-to-head comparative study of the conditional performance of control charts based on estimated parameters. Quality Engineering, 29(2), 244-253. http://dx.doi.org/10.1080/08982112.2016.1237651.
http://dx.doi.org/10.1080/08982112.2016....
; Zwetsloot & Ajadi, 2019Zwetsloot, I. M., & Ajadi, J. O. (2019). A comparison of EWMA control charts for dispersion based on estimated parameters. Computers & Industrial Engineering, 127, 436-450. http://dx.doi.org/10.1016/j.cie.2018.10.034.
http://dx.doi.org/10.1016/j.cie.2018.10....
; Diko et al., 2019Diko, M. D., Goedhart, R., & Does, R. J. (2019). A head-to-head comparison of the out-of-control performance of control charts adjusted for parameter estimation. Quality Engineering. In press. http://dx.doi.org/10.1080/08982112.2019.1666140.
http://dx.doi.org/10.1080/08982112.2019....
; Hu et al., 2019Hu, X., Castagliola, P., Zhou, X., & Tang, A. (2019). Conditional design of the EWMA median chart with estimated parameters. Communications in Statistics. Theory and Methods, 48(8), 1871-1889. http://dx.doi.org/10.1080/03610926.2018.1440310.
http://dx.doi.org/10.1080/03610926.2018....
; Jardim et al., 2019Jardim, F. S., Chakraborti, S., & Epprecht, E. K. (2019). Chart with estimated parameters: the conditional ARL distribution and new insights. Production and Operations Management, 28(6), 1545-1557. http://dx.doi.org/10.1111/poms.12985.
http://dx.doi.org/10.1111/poms.12985...
, 2020Jardim, F. S., Chakraborti, S., & Epprecht, E. K. (2020). Two perspectives for designing a phase II control chart with estimated parameters: the case of the Shewhart Xbar chart. Journal of Quality Technology, 52(2), 198-217. http://dx.doi.org/10.1080/00224065.2019.1571345.
http://dx.doi.org/10.1080/00224065.2019....
). It is noted that reference sample size affects in‐control run length distribution that almost completely lies below the desired run length, causes larger variability in run length distribution and may reduce the sensitivity to a change. A simple recipe to overcome this difficulty is to increase phase I sample size and reduce the variability of the estimates. In many settings this can be inapplicable such as short run processes and professionals do not prefer this approach when it is not cost-effective.
‘Self-starting methods’ were proposed to amalgamate phase I and phase II studies. These methods involve sequentially updating the parameters with every new successive process reading and monitoring the process to see whether it is in-control or not (Hawkins, 1987Hawkins, D. M. (1987). Self-starting CUSUM charts for location and scale. The Statistician, 36(4), 299-316. http://dx.doi.org/10.2307/2348827.
http://dx.doi.org/10.2307/2348827...
; Hawkins & Maboudou-Tchao, 2007Hawkins, D. M., & Maboudou-Tchao, E. M. (2007). Self-starting multivariate exponentially weighted moving average control charting. Technometrics, 49(2), 199-209. http://dx.doi.org/10.1198/004017007000000083.
http://dx.doi.org/10.1198/00401700700000...
; Keefe et al., 2015Keefe, M. J., Woodall, W. H., & Jones-Farmer, L. A. (2015). The conditional in-control performance of self-starting control charts. Quality Engineering, 27(4), 488-499. http://dx.doi.org/10.1080/08982112.2015.1065323.
http://dx.doi.org/10.1080/08982112.2015....
; Khosravi & Amiri, 2019Khosravi, P., & Amiri, A. (2019). Self-Starting control charts for monitoring logistic regression profiles. Communications in Statistics: Simulation and Computation, 48(6), 1860-1871. http://dx.doi.org/10.1080/03610918.2018.1425442.
http://dx.doi.org/10.1080/03610918.2018....
; Quesenberry, 1991Quesenberry, C. P. (1991). SPC Q charts for start-up processes and short or long runs. Journal of Quality Technology, 23(3), 213-224. http://dx.doi.org/10.1080/00224065.1991.11979327.
http://dx.doi.org/10.1080/00224065.1991....
; Shen et al., 2016Shen, X., Tsui, K.-L., Zou, C., & Woodall, W. H. (2016). Self-starting monitoring scheme for poisson count data with varying population sizes. Technometrics, 58(4), 460-471. http://dx.doi.org/10.1080/00401706.2015.1075423.
http://dx.doi.org/10.1080/00401706.2015....
). The unknown parameter change point estimation procedures (Hawkins & Zamba, 2005Hawkins, D. M., & Zamba, K. D. (2005). Statistical process control for shifts in mean or variance using a changepoint formulation. Technometrics, 47(2), 164-173. http://dx.doi.org/10.1198/004017004000000644.
http://dx.doi.org/10.1198/00401700400000...
; Zamba & Hawkins, 2009Zamba, K. D., & Hawkins, D. M. (2009). A multivariate change point model for change in mean vector and/or covariance structure. Journal of Quality Technology, 41(3), 285-303. http://dx.doi.org/10.1080/00224065.2009.11917783.
http://dx.doi.org/10.1080/00224065.2009....
) can also be classified as self-starting methods. Basically, self-starting methods convert the observations of an unknown statistical distribution into observations of a known distribution, for example, standard normal. The outcomes of the standardization can be effectively appointed to statistical monitoring.
This paper bridges the gap in literature by comparing the performance of time weighted single control charts when process parameters are sequentially updated with such self-starting method in a multidimensional setting. The contribution of this work is to introduce a modified multivariate control chart for the unknown parameter along with a throughout comparison of the related control charts. We discussed the methods proposed by Maboudou-Tchao & Hawkins (2011)Maboudou-Tchao, E. M., & Hawkins, D. M. (2011). Self-starting multivariate control charts for location and scale. Journal of Quality Technology, 43(2), 113-126. http://dx.doi.org/10.1080/00224065.2011.11917850.
http://dx.doi.org/10.1080/00224065.2011....
and Kim (2012)Kim, M.-J. (2012). Statistical quality methods to monitor and transform healthcare data. University Park: The Pennsylvania State University. and also applied self-starting method to the multivariate max control chart (Chen et al., 2005Chen, G., Cheng, S. W., & Xie, H. (2005). A new multivariate control chart for monitoring both location and dispersion. Communications in Statistics: Simulation and Computation, 34(1), 203-217. http://dx.doi.org/10.1081/SAC-200047087.
http://dx.doi.org/10.1081/SAC-200047087...
). Performance of each scheme is summarized comparatively. The remainder of the paper is organized as follows. In the next section, we provide the general multivariate framework of self-starting multivariate single control charts. After this section, we illustrate the application of these schemes using a real hypertension data set. We investigate the methods via an extensive simulation study in which the effects of mean, covariance and joint shifts and the learning period are considered. Finally, we provide a discussion about the comparison results.
2. Background
2.1. Multi-conversion procedure and self-starting MEC (SSMEC) chart
Self-starting control charts require a standardization procedure for transforming unknown parameter process readings into known standardized outcomes. The conversion idea was used for various types of distributions and control charts (Hawkins & Olwell, 2012Hawkins, D. M., & Olwell, D. H. (2012). Cumulative sum charts and charting for quality improvement. New York: Springer Science & Business Media.; Keefe et al., 2015Keefe, M. J., Woodall, W. H., & Jones-Farmer, L. A. (2015). The conditional in-control performance of self-starting control charts. Quality Engineering, 27(4), 488-499. http://dx.doi.org/10.1080/08982112.2015.1065323.
http://dx.doi.org/10.1080/08982112.2015....
; Quesenberry, 1991Quesenberry, C. P. (1991). SPC Q charts for start-up processes and short or long runs. Journal of Quality Technology, 23(3), 213-224. http://dx.doi.org/10.1080/00224065.1991.11979327.
http://dx.doi.org/10.1080/00224065.1991....
, 1993Quesenberry, C. P. (1993). The effect of sample size on estimated limits for X and S control charts. Journal of Quality Technology, 25(4), 237-247. http://dx.doi.org/10.1080/00224065.1993.11979470.
http://dx.doi.org/10.1080/00224065.1993....
, 1995Quesenberry, C. P. (1995). On properties of Q charts for variables. Journal of Quality Technology, 27(3), 184-203. http://dx.doi.org/10.1080/00224065.1995.11979592.
http://dx.doi.org/10.1080/00224065.1995....
, 1997Quesenberry, C. P. (1997). SPC methods for quality improvement. New York: John Wiley & Sons.). For the multivariate domain one of the most recent multi-transformation method was discussed by Hawkins & Maboudou-Tchao (2007)Hawkins, D. M., & Maboudou-Tchao, E. M. (2007). Self-starting multivariate exponentially weighted moving average control charting. Technometrics, 49(2), 199-209. http://dx.doi.org/10.1198/004017007000000083.
http://dx.doi.org/10.1198/00401700700000...
. They first used this method with a MEWMA chart to monitor the mean vector. The same idea was later used in to monitor mean and covariance shifts with a MEC control chart (Maboudou-Tchao & Hawkins, 2011Maboudou-Tchao, E. M., & Hawkins, D. M. (2011). Self-starting multivariate control charts for location and scale. Journal of Quality Technology, 43(2), 113-126. http://dx.doi.org/10.1080/00224065.2011.11917850.
http://dx.doi.org/10.1080/00224065.2011....
). We call this control chart a SSMEC chart.
Let , and be a sequence of individual process reading for a dimensional normal distribution where . The distribution shifts model is as follows:
where is the change point. Here, we assume that these parameters are unknown. This method includes a two-step conversion. A predicted value is obtained from , utilizing the coefficients estimated from , for . After finding the predicted values of each observation vector, the standardized recursive residuals are obtained as results of the first transformation. The standardized recursive residual is:
where The standardized recursive residuals are mutually independent and distributed. The matrix of the recursive residuals is the transformation of original observations into a data set with zero mean vector and a covariance matrix. The standardized recursive residuals follow a distribution with degrees of freedom. Thus the second transformation can be applied to to find the stream of which follows and independent, where
Here, represents the inverse normal and is the CDF of a distribution where degrees of freedom is . is an independent vector of transformed observations and includes transformed vector at time point, and is the matrix of these vectors. The independent standard normal observations form the transformed matrix of independent vectors. Two single control charts are considered in order to monitor the transformed matrix in the next section. Comparisons with the SSMEC chart are given in Section 3.
2.2 Self-starting multivariate exponentially weighted likelihood ratio (SSMELR) control chart
This method was proposed by Kim (2012)Kim, M.-J. (2012). Statistical quality methods to monitor and transform healthcare data. University Park: The Pennsylvania State University. and uses a MEWMA procedure in which a GLR test statistic is integrated. The method extends GLR based control chart (Zhang et al., 2010Zhang, J., Li, Z., & Wang, Z. (2010). A multivariate control chart for simultaneously monitoring process mean and variability. Computational Statistics & Data Analysis, 54(10), 2244-2252. http://dx.doi.org/10.1016/j.csda.2010.03.027.
http://dx.doi.org/10.1016/j.csda.2010.03...
) by self-updating the process parameters by the multi-conversion approach.
SSMELR chart uses a GLR function which is sensitive to deviations from a null hypothesis where and .
Here, , , , and , and is a smoothing parameter (). If , the the chart generates an out-of-control signal, where is a cutoff for a specific IC ARL.
3. Methods
3.1. Proposed self-starting multivariate maximum EWMA (SSMME) control chart
We propose a self-starting multivariate single control chart extension includes using multi-conversion along with the MME (Chen et al., 2005Chen, G., Cheng, S. W., & Xie, H. (2005). A new multivariate control chart for monitoring both location and dispersion. Communications in Statistics: Simulation and Computation, 34(1), 203-217. http://dx.doi.org/10.1081/SAC-200047087.
http://dx.doi.org/10.1081/SAC-200047087...
) procedure.
Consider a statistic sensitive to mean shifts,
where and . Here, denotes the inverse of the standard normal cumulative distribution function and is the chi-square distribution with p degrees of freedom. Let be the second EWMA which is sensitive to covariance shifts where . Then is scaled as follows . As and are independent z scores when no special causes exist. Then and is used as monitoring statistic: .
If , then the process is considered to be out-of-control, where is the upper control limit which achieves a specific significance level.
SSMME control charts has its own advantage to provide built-in diagnostic aids. The practitioner can monitor and pairs using as the control limits after a signal is issued by the SSMME chart. Thereafter, one can easily predict whether the shift occurs in mean vector, covariance matrix or both. A more complex tool is provided for the diagnostics after a signal in (Maboudou-Tchao & Hawkins, 2011Maboudou-Tchao, E. M., & Hawkins, D. M. (2011). Self-starting multivariate control charts for location and scale. Journal of Quality Technology, 43(2), 113-126. http://dx.doi.org/10.1080/00224065.2011.11917850.
http://dx.doi.org/10.1080/00224065.2011....
). This approach needs more resources; however, it is quite successful in diagnosing simultaneous shifts. The practitioners should be cautious about the masking effect between mean shift and covariance shift signals. Although MELR have been criticized for lack of diagnostics ability (Zhang et al., 2010Zhang, J., Li, Z., & Wang, Z. (2010). A multivariate control chart for simultaneously monitoring process mean and variability. Computational Statistics & Data Analysis, 54(10), 2244-2252. http://dx.doi.org/10.1016/j.csda.2010.03.027.
http://dx.doi.org/10.1016/j.csda.2010.03...
), we propose a naive apportioning for the SSMELR. is known to be sensitive to covariance shifts while is sensitive to mean shifts. Using these statistics simply help user identify the potential cause of a change.
A signal generated by self-starting control charts may include a potential delay in detecting the time of an assignable cause. Change point detection procedures as another diagnostic tool can be useful to estimate and detect the time of a special cause and prevent the delay in obtaining a signal after a change. They also can be informative for determining the type of a process disturbance. Further investigation on the performance assessment of the change point estimator for multivariate performances is available in Doǧu & Kocakoc (2011Doǧu, E., & Kocakoc, I. D. (2011). Estimation of change point in generalized variance control chart. Communications in Statistics. Simulation and Computation, 40(3), 345-363. http://dx.doi.org/10.1080/03610918.2010.542844.
http://dx.doi.org/10.1080/03610918.2010....
, 2013Doǧu, E., & Kocakoc, I. D. (2013). A multivariate change point detection procedure for monitoring mean and covariance simultaneously. Communications in Statistics. Simulation and Computation, 42(6), 1235-1255. http://dx.doi.org/10.1080/03610918.2012.661907.
http://dx.doi.org/10.1080/03610918.2012....
) and Doǧu (2015)Doǧu, E. (2015). Identifying the time of a step change with multivariate single control charts. Journal of Statistical Computation and Simulation, 85(8), 1529-1543. http://dx.doi.org/10.1080/00949655.2014.880704.
http://dx.doi.org/10.1080/00949655.2014....
.
4. Simulation settings
The performance of the control charts were discussed based on a simulation approach. We consider several possible patterns of shift in and for bivariate cases for simplicity. Table 1 shows the shift sizes for each simulation scenario. The effect of a mean shift (), the effect of a covariance shift (), the effect of a simultaneous shift in the mean vector and covariance matrix (and), the effect of correlation (and the effect of time elapsed before the change () are considered in the simulation study. The number of Monte Carlo simulation runs is 10,000 for each scenario and out-of-control ARL, SDRL and percentiles are calculated from simulation results. is used as the smoothing factor for each chart and the IC ARL is fixed to 500 for each monitoring scheme.
The initial base period is conducted with the in-control parameters and after this period the mean vector and/or covariance matrix shift is introduced. A sequence of normal data from a multivariate normal distribution, where and , is generated as the base samples. A set of numbers between 50 to 1000 is used to define values. For a shift in mean vector, an increment in the mean of the first component or both components is considered, thus the out-of-control mean vector is . An out-of-control covariance matrix is used for creating a covariance shift. Then, the statistics were monitored until a signal is issued by the control charts.
The known-parameter settings for each control chart are also included in the figures. Therefore, the ARL and SDRL results for the self-starting control charts can be tracked and compared with their asymptotes (the known parameter settings).
5. Results and discussion
Next, we discuss detection performance of SSMEC, SSMELR and SSMME charts for predefined criteria such as magnitude of shift, correlation and learning periods.
Table 2 shows the results for various simulation settings. Figure 1a, b shows the simulation results (ARL and SDRL) for known parameter and self-starting schemes when , =0.25 and IC ARL=500, respectively. Each panel in these figures filters the results for a particular baseline sample size and approach (known parameter or self-starting). Known parameter case is the ideal and the results show that self-starting schemes converge to the known parameter results where a large phase I sample is available or parameters are known. In general, the learning time has a major impact on the convergence to the known parameter case. In other words, as the learning time increases all the three self-starting control charts converge to their known-parameter settings. Additionally, ARL and SDRL results for the first four cases are relatively high and we see a pattern of reaching the asymptote quickly when magnitudes of shift increases. When we sketch the illustrations of this simulation study, it can be concluded that approaching to the asymptote requires moderate sizes of learning observations. However, research on the effect of parameter estimation shows that the traditional methods also need surprisingly large samples in order to effectively estimate the parameters (Holmes & Mergen, 1993Holmes, D. S., & Mergen, A. E. (1993). Improving the performance of the T^2 control chart. Quality Engineering, 5(4), 619-625. http://dx.doi.org/10.1080/08982119308919004.
http://dx.doi.org/10.1080/08982119308919...
; Jones et al., 2001Jones, L. A., Champ, C. W., & Rigdon, S. E. (2001). The performance of exponentially weighted moving average charts with estimated parameters. Technometrics, 43(2), 156-167. http://dx.doi.org/10.1198/004017001750386279.
http://dx.doi.org/10.1198/00401700175038...
, 2004Jones, L. A., Champ, C. W., & Rigdon, S. E. (2004). The run length distribution of the CUSUM with estimated parameters. Journal of Quality Technology, 36(1), 95-108. http://dx.doi.org/10.1080/00224065.2004.11980254.
http://dx.doi.org/10.1080/00224065.2004....
). Moreover, a recent study revealed surprisingly low dispersion in ARL0 results of self-starting method compared to the results for a Shewhart chart with fixed Phase I sample (Keefe et al., 2015Keefe, M. J., Woodall, W. H., & Jones-Farmer, L. A. (2015). The conditional in-control performance of self-starting control charts. Quality Engineering, 27(4), 488-499. http://dx.doi.org/10.1080/08982112.2015.1065323.
http://dx.doi.org/10.1080/08982112.2015....
).
Performance comparisons based on ARL and SDRL for corresponding scenarios used in simulations.

Plots of out-of-control ARL and SDRL of SSMEC, SSMELR and SSMME charts based on various initial sample sizes along with the results when parameters are known (
Comparing ARL and SDRL results reveal some other interesting features of these control charts. MELR control chart slightly over performs MEC and MME for most of the cases. However, this result is not valid for self-starting versions. In general, SSMEC and SSMME over performs SSMELR for most of the cases. They produce less variation in run lengths and reach to the known parameter value with smaller baseline sample sizes on average. ARL and SDRL results of SSMELR are mostly higher than the results of other schemes. Figure 2a and Figure 2b summarizes percentiles (10th and 90th) for each self-starting control chart when , =0.25 and IC ARL=500. This figure shows the large variability for small sizes of baseline samples. As the number of observations to update the parameters increase, the dispersion of run length distribution declines dramatically.

Line plots of percentiles of run length of SSMEC, SSMELR and SSMME charts based on various baseline sample sizes(
Effect strong correlation structure (=0.75) on ARL distribution is also studied and given in Figure 3. Figure 3a and Figure 3b show the effect of high correlation (=0.75) on ARL and SDRL results along with various sizes of baseline samples. All the three schemes provide relatively high ARL and SDRL scores for short learning periods. As the learning period extends, magnitude of shift and correlation increase the control charts perform better. On the other hand, the results for small sizes of shift captured by case 3 are slightly different. SSMEC and SSMME charts performs better than SSMELR for weak correlation and small/moderate baseline sample sizes (50-200). Additionally, SSMELR improves its detection capability and provides less variability where strong correlation exists.

Line plots of out-of-control ARL and SDRL of SSMEC, SSMELR and SSMME charts based on various baseline sample sizes (
6. An illustrative example: case of hypertension monitoring
Control charts have been widely used to understand health-care data (Doǧu, 2012Doǧu, E. (2012). Monitoring time between medical errors to improve health-care quality. International Journal of Qualitative Research, 6(2), 151-157.; Eren-Dogu & Dogu, 2013Eren-Dogu, Z. F., & Dogu, E. (2013). Monitoring the efficiency of use of operating room time with CUSUM charts. Quality Issues and Insights in the 21st Century, 2(2), 1-6.; Kim, 2012Kim, M.-J. (2012). Statistical quality methods to monitor and transform healthcare data. University Park: The Pennsylvania State University.). In the complex nature of chronic disease management, monitoring the biological, and clinical characteristics and the identification of special causes are vital for a successful health care monitoring. For example, blood pressure (BP) monitoring is used to assess risk for hypertension as well as cardiovascular diseases. Specialists need to understand: the past and current state of the important blood pressure metrics, the relationships between the metrics, the underlying causes of variation and the possible effects of an intervention. Patient level metrics such as systolic blood pressure (SBP) and diastolic blood pressure (DBP) are important indicators measured over time in order to assess risk and effects of changes in drug regimen and changes in mean levels, metric covariance and correlation in the time course. Examples of implementation of control charts for BP monitoring include Albloushi et. al. (2015)Albloushi, T., Suwaidi, A., Zarouni, N., Abdelrahman, A., & Shamsuzzaman, M. (2015). Design of X̅&R control charts for monitoring quality of care for hypertension. In 2015 International Conference on Industrial Engineering and Operations Management (IEOM) (pp. 1-5). Piscataway: IEEE. http://dx.doi.org/10.1109/IEOM.2015.7093914.
http://dx.doi.org/10.1109/IEOM.2015.7093...
, Cornélissen et al. (1997)Cornélissen, G., Halberg, F., Hawkins, D., Otsuka, K., & Henke, W. (1997). Individual assessment of antihypertensive response by self-starting cumulative sums. Journal of Medical Engineering & Technology, 21(3–4), 111-120. http://dx.doi.org/10.3109/03091909709031156. PMid:9222952.
http://dx.doi.org/10.3109/03091909709031...
and Hawkins & Maboudou-Tchao (2008)Hawkins, D. M., & Maboudou-Tchao, E. M. (2008). Multivariate exponentially weighted moving covariance matrix. Technometrics, 50(2), 155-166. http://dx.doi.org/10.1198/004017008000000163.
http://dx.doi.org/10.1198/00401700800000...
.
Citing the importance of monitoring BP levels over time, we applied the suggested charting methodologies to BP monitoring data previously used in Albloushi et al. (2015)Albloushi, T., Suwaidi, A., Zarouni, N., Abdelrahman, A., & Shamsuzzaman, M. (2015). Design of X̅&R control charts for monitoring quality of care for hypertension. In 2015 International Conference on Industrial Engineering and Operations Management (IEOM) (pp. 1-5). Piscataway: IEEE. http://dx.doi.org/10.1109/IEOM.2015.7093914.
http://dx.doi.org/10.1109/IEOM.2015.7093...
. Suppose in this application immediate monitoring is needed to support medical decision making to evaluate the effects of changes in medication. SBP and DBP of a 43 years old male patient who was diagnosed with hypertension were measured for 84 days. The physician suggested the patient to take 10 mg ACE (angiotensin-converting enzyme) inhibitor every day. Pre-treatment and post-treatment measurements are shown in Figure 4.
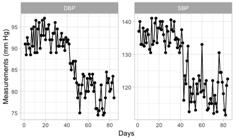
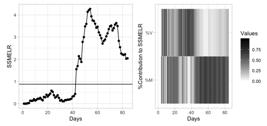
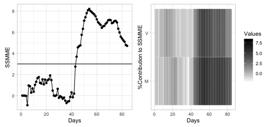
SSMEC, SSMELR and SSMME control charts were constructed using the dataset and results are presented in Figures 5 -7, respectively. All the competing procedures provided strong signals after 42th observation where intervention begun. SSMEC is the only non-omnibus control chart we study. MEWMA control chart in Figure 5 presents reactions to mean shifts while C chart provides signals to covariance shifts. Here, we obtained signals from both control charts supporting a simultaneous shift in BP mean and covariance. Similarly, SSMELR chart signals after 42th reading. The type of shift is more difficult to evaluate with SSMELR control chart as it doesn’t provide built-in diagnostic tools. However, the mean and covariance components are shown in Figure 6. %M values are showing signs of increase over time meaning a strong mean shift is detected with the MELR statistic. SSMME control chart and two diagnostic tools (M and V control charts) are provided in Figure 7. SSMME control chart offers clear and more informative diagnostics while it generates signals for the post-treatment period. Evaluating M and V control charts, we can conclude a joint shift in mean vector and covariance matrix.

The self-starting control charts studied in this paper provided helpful information to discover problems related to health status, however, they are not directionally sensitive. Table 3 provides summary statistics for pre-treatment and post-treatment data supporting the evaluation of a joint shift. These results show a decrease in mean levels of SBP and DBP and also an increase in their corresponding variances.
7. Conclusions
In this study, we discussed self-starting control charts which does not demand for a long historical data for an expensive phase I application to start monitoring. The investigated procedures (SSMEC, SSMELR and SSMME) are easily designed and constructed while they do not require in-control parameter information from phase-I data. In addition, the single multivariate self-starting SPC methods (SSMELR and SSMME) maintain the ability to simultaneously monitor the mean and process variability for a multivariate process. These procedures are quite robust and sensitive to small magnitudes of shift, because the control chart statistics use exponential smoothing.
Some similarities between the methods studied here can be interpreted. The methods discussed in this study, SSMELR and SSMME, are the extensions of the MELR and the MME. These charts use similar statistics, but the underlying assumption is that the parameters are known or can be estimated from a phase I study. In the proposed methods, the need of a phase I study is minimized. Firstly, the unknown distribution is transformed into a standardized distribution. The practitioners use these known parameters for the implementation instead of estimating them from a relatively long pre-observation stage. The relative results show differences from the known parameter case.
From the simulation study, we propose that SSMME control chart is the best choice in real applications. When the charting performance results of SSMME control chart are compared with the existing SSMEC, SSMELR, we found that SSMEC and SSMME control charts proves similar but better detection capabilities than SSMELR control chart in various scenarios of simulation. Considering the performance, SSMME has similar detecting capabilities for joint shifts to the SSMEC chart which is not an omnibus procedure beyond our original purpose. It means SSMEC needs more resources while SSMME provides the similar detecting ability but needs only one control chart during the in-control phase. In addition, SSMME provides the diagnostic tools for further analysis of a signal. SSMME is a well-defined option for diagnostic tools since they use standard limits as a decision rule. Comparing the SSMME with SSMELR, we observe that SSMELR control chart performs better when small shift sizes, short learning periods and strong correlation exist. When only mean shift is considered, SSMELR also provides better results for small shift sizes and short learning periods.
The number of learning observations to update the parameters is a concern for these methods. This may lead professionals to think of the learning period as a type of phase I application. The benefit of the methods in this study is that the practitioner may detect shifts even after a short initial learning session and may immediately start monitoring after a few process readings obtained. Self-starting methods include a continual learning fragment and against the traditional approach they update the parameter when a new observation enters. This makes the method to be increasingly precise as the in control data gathering grows and eliminates the phase I and II distinction. The self-starting methods need a careful practice to obtain these benefits. Every signal should be carefully inspected and the special causes should be eliminated not to contaminate the parameter update process. The reaction to the early shifts may cause variance inflation and careful consideration is needed for parameter update. Running the charts backwards to diagnose very early shifts is proposed (Maboudou-Tchao & Hawkins, 2011Maboudou-Tchao, E. M., & Hawkins, D. M. (2011). Self-starting multivariate control charts for location and scale. Journal of Quality Technology, 43(2), 113-126. http://dx.doi.org/10.1080/00224065.2011.11917850.
http://dx.doi.org/10.1080/00224065.2011....
) as a way of preventing this type of problem.
We introduced a motivating example of blood pressure monitoring to show the implementation of the methods discussed in this paper. In real health monitoring, SPC methodology is becoming widely accepted as a tool of monitoring process and outcome because it has benefits not only in finding evidence for special causes of variation, but also in understanding noise and common causes in the process. However, traditional univariate and multivariate SPC methodology still fall short in practical healthcare monitoring application as most of them rely on a phase I dataset and focus on only changes in the mean or variation of the process. Generally, patient health conditions are diagnosed based on mean levels. However, increased variability can predict illness, even if the mean level is stable. Second, it is difficult to gather sufficient in-control process data regarded in clinical settings. The methods discussed in this study provide a way of overcoming these difficulties.
-
How to cite this article: Dogu, E., & Kim, M. J. (2020). Self-starting single control charts for multivariate processes: a comparison of methods. Production, 30, e20190136. https://doi.org/10.1590/0103-6513.20190136.
References
- Albloushi, T., Suwaidi, A., Zarouni, N., Abdelrahman, A., & Shamsuzzaman, M. (2015). Design of X̅&R control charts for monitoring quality of care for hypertension. In 2015 International Conference on Industrial Engineering and Operations Management (IEOM) (pp. 1-5). Piscataway: IEEE. http://dx.doi.org/10.1109/IEOM.2015.7093914
» http://dx.doi.org/10.1109/IEOM.2015.7093914 - Alt, F. B. (1985). Multivariate quality control. In S. Kotz & N. L. Johnson (Ed.), The encyclopedia of statistical sciences (pp. 110-122). Hoboken: Wiley.
- Alt, F. B., & Smith, N. D. (1988). 17 multivariate process control. In P. R. Krishnaiah & C. R. Rao Larsen (Eds.), Handbook of statistics (Vol. 7, pp. 333-351). Amsterdam: Elsevier.
- Chen, G., Cheng, S. W., & Xie, H. (2005). A new multivariate control chart for monitoring both location and dispersion. Communications in Statistics: Simulation and Computation, 34(1), 203-217. http://dx.doi.org/10.1081/SAC-200047087
» http://dx.doi.org/10.1081/SAC-200047087 - Cheng, S. W., & Thaga, K. (2005). Multivariate Max-CUSUM Chart. Quality Technology & Quantitative Management, 2(2), 221-235. http://dx.doi.org/10.1080/16843703.2005.11673095
» http://dx.doi.org/10.1080/16843703.2005.11673095 - Cheng, S. W., & Thaga, K. (2006). Single variables control charts: an overview. Quality and Reliability Engineering International, 22(7), 811-820. http://dx.doi.org/10.1002/qre.730
» http://dx.doi.org/10.1002/qre.730 - Cornélissen, G., Halberg, F., Hawkins, D., Otsuka, K., & Henke, W. (1997). Individual assessment of antihypertensive response by self-starting cumulative sums. Journal of Medical Engineering & Technology, 21(3–4), 111-120. http://dx.doi.org/10.3109/03091909709031156 PMid:9222952.
» http://dx.doi.org/10.3109/03091909709031156 - Diko, M. D., Goedhart, R., & Does, R. J. (2019). A head-to-head comparison of the out-of-control performance of control charts adjusted for parameter estimation. Quality Engineering In press. http://dx.doi.org/10.1080/08982112.2019.1666140
» http://dx.doi.org/10.1080/08982112.2019.1666140 - Doǧu, E. (2012). Monitoring time between medical errors to improve health-care quality. International Journal of Qualitative Research, 6(2), 151-157.
- Doǧu, E. (2015). Identifying the time of a step change with multivariate single control charts. Journal of Statistical Computation and Simulation, 85(8), 1529-1543. http://dx.doi.org/10.1080/00949655.2014.880704
» http://dx.doi.org/10.1080/00949655.2014.880704 - Doǧu, E., & Kocakoc, I. D. (2011). Estimation of change point in generalized variance control chart. Communications in Statistics. Simulation and Computation, 40(3), 345-363. http://dx.doi.org/10.1080/03610918.2010.542844
» http://dx.doi.org/10.1080/03610918.2010.542844 - Doǧu, E., & Kocakoc, I. D. (2013). A multivariate change point detection procedure for monitoring mean and covariance simultaneously. Communications in Statistics. Simulation and Computation, 42(6), 1235-1255. http://dx.doi.org/10.1080/03610918.2012.661907
» http://dx.doi.org/10.1080/03610918.2012.661907 - Eren-Dogu, Z. F., & Dogu, E. (2013). Monitoring the efficiency of use of operating room time with CUSUM charts. Quality Issues and Insights in the 21st Century, 2(2), 1-6.
- Faraz, A., Woodall, W. H., & Heuchenne, C. (2015). Guaranteed conditional performance of the S 2 control chart with estimated parameters. International Journal of Production Research, 53(14), 4405-4413. http://dx.doi.org/10.1080/00207543.2015.1008112
» http://dx.doi.org/10.1080/00207543.2015.1008112 - Hawkins, D. M. (1987). Self-starting CUSUM charts for location and scale. The Statistician, 36(4), 299-316. http://dx.doi.org/10.2307/2348827
» http://dx.doi.org/10.2307/2348827 - Hawkins, D. M., & Maboudou-Tchao, E. M. (2007). Self-starting multivariate exponentially weighted moving average control charting. Technometrics, 49(2), 199-209. http://dx.doi.org/10.1198/004017007000000083
» http://dx.doi.org/10.1198/004017007000000083 - Hawkins, D. M., & Maboudou-Tchao, E. M. (2008). Multivariate exponentially weighted moving covariance matrix. Technometrics, 50(2), 155-166. http://dx.doi.org/10.1198/004017008000000163
» http://dx.doi.org/10.1198/004017008000000163 - Hawkins, D. M., & Olwell, D. H. (2012). Cumulative sum charts and charting for quality improvement New York: Springer Science & Business Media.
- Hawkins, D. M., & Zamba, K. D. (2005). Statistical process control for shifts in mean or variance using a changepoint formulation. Technometrics, 47(2), 164-173. http://dx.doi.org/10.1198/004017004000000644
» http://dx.doi.org/10.1198/004017004000000644 - Holmes, D. S., & Mergen, A. E. (1993). Improving the performance of the T^2 control chart. Quality Engineering, 5(4), 619-625. http://dx.doi.org/10.1080/08982119308919004
» http://dx.doi.org/10.1080/08982119308919004 - Hu, X., Castagliola, P., Zhou, X., & Tang, A. (2019). Conditional design of the EWMA median chart with estimated parameters. Communications in Statistics. Theory and Methods, 48(8), 1871-1889. http://dx.doi.org/10.1080/03610926.2018.1440310
» http://dx.doi.org/10.1080/03610926.2018.1440310 - Jardim, F. S., Chakraborti, S., & Epprecht, E. K. (2019). Chart with estimated parameters: the conditional ARL distribution and new insights. Production and Operations Management, 28(6), 1545-1557. http://dx.doi.org/10.1111/poms.12985
» http://dx.doi.org/10.1111/poms.12985 - Jardim, F. S., Chakraborti, S., & Epprecht, E. K. (2020). Two perspectives for designing a phase II control chart with estimated parameters: the case of the Shewhart Xbar chart. Journal of Quality Technology, 52(2), 198-217. http://dx.doi.org/10.1080/00224065.2019.1571345
» http://dx.doi.org/10.1080/00224065.2019.1571345 - Jensen, W. A., Jones-Farmer, L. A., Champ, C. W., & Woodall, W. H. (2006). Effects of parameters estimation on Control Charts properties: a literature review. Journal of Quality Technology, 38(4), 349-364. http://dx.doi.org/10.1080/00224065.2006.11918623
» http://dx.doi.org/10.1080/00224065.2006.11918623 - Jones, L. A., Champ, C. W., & Rigdon, S. E. (2001). The performance of exponentially weighted moving average charts with estimated parameters. Technometrics, 43(2), 156-167. http://dx.doi.org/10.1198/004017001750386279
» http://dx.doi.org/10.1198/004017001750386279 - Jones, L. A., Champ, C. W., & Rigdon, S. E. (2004). The run length distribution of the CUSUM with estimated parameters. Journal of Quality Technology, 36(1), 95-108. http://dx.doi.org/10.1080/00224065.2004.11980254
» http://dx.doi.org/10.1080/00224065.2004.11980254 - Keefe, M. J., Woodall, W. H., & Jones-Farmer, L. A. (2015). The conditional in-control performance of self-starting control charts. Quality Engineering, 27(4), 488-499. http://dx.doi.org/10.1080/08982112.2015.1065323
» http://dx.doi.org/10.1080/08982112.2015.1065323 - Khosravi, P., & Amiri, A. (2019). Self-Starting control charts for monitoring logistic regression profiles. Communications in Statistics: Simulation and Computation, 48(6), 1860-1871. http://dx.doi.org/10.1080/03610918.2018.1425442
» http://dx.doi.org/10.1080/03610918.2018.1425442 - Kim, M.-J. (2012). Statistical quality methods to monitor and transform healthcare data University Park: The Pennsylvania State University.
- Li, Z., Zhang, J., & Wang, Z. (2010). Self-starting control chart for simultaneously monitoring process mean and variance. International Journal of Production Research, 48(15), 4537-4553. http://dx.doi.org/10.1080/00207540903051692
» http://dx.doi.org/10.1080/00207540903051692 - Maboudou-Tchao, E. M., & Hawkins, D. M. (2011). Self-starting multivariate control charts for location and scale. Journal of Quality Technology, 43(2), 113-126. http://dx.doi.org/10.1080/00224065.2011.11917850
» http://dx.doi.org/10.1080/00224065.2011.11917850 - Quesenberry, C. P. (1991). SPC Q charts for start-up processes and short or long runs. Journal of Quality Technology, 23(3), 213-224. http://dx.doi.org/10.1080/00224065.1991.11979327
» http://dx.doi.org/10.1080/00224065.1991.11979327 - Quesenberry, C. P. (1993). The effect of sample size on estimated limits for X and S control charts. Journal of Quality Technology, 25(4), 237-247. http://dx.doi.org/10.1080/00224065.1993.11979470
» http://dx.doi.org/10.1080/00224065.1993.11979470 - Quesenberry, C. P. (1995). On properties of Q charts for variables. Journal of Quality Technology, 27(3), 184-203. http://dx.doi.org/10.1080/00224065.1995.11979592
» http://dx.doi.org/10.1080/00224065.1995.11979592 - Quesenberry, C. P. (1997). SPC methods for quality improvement. New York: John Wiley & Sons.
- Shen, X., Tsui, K.-L., Zou, C., & Woodall, W. H. (2016). Self-starting monitoring scheme for poisson count data with varying population sizes. Technometrics, 58(4), 460-471. http://dx.doi.org/10.1080/00401706.2015.1075423
» http://dx.doi.org/10.1080/00401706.2015.1075423 - Thaga, K., & Gabaitiri, L. (2006). Multivariate Max-Chart. Economic Quality Control, 21(1), 113-125. http://dx.doi.org/10.1515/EQC.2006.113
» http://dx.doi.org/10.1515/EQC.2006.113 - Zamba, K. D., & Hawkins, D. M. (2009). A multivariate change point model for change in mean vector and/or covariance structure. Journal of Quality Technology, 41(3), 285-303. http://dx.doi.org/10.1080/00224065.2009.11917783
» http://dx.doi.org/10.1080/00224065.2009.11917783 - Zhang, J., Li, Z., & Wang, Z. (2010). A multivariate control chart for simultaneously monitoring process mean and variability. Computational Statistics & Data Analysis, 54(10), 2244-2252. http://dx.doi.org/10.1016/j.csda.2010.03.027
» http://dx.doi.org/10.1016/j.csda.2010.03.027 - Zwetsloot, I. M., & Ajadi, J. O. (2019). A comparison of EWMA control charts for dispersion based on estimated parameters. Computers & Industrial Engineering, 127, 436-450. http://dx.doi.org/10.1016/j.cie.2018.10.034
» http://dx.doi.org/10.1016/j.cie.2018.10.034 - Zwetsloot, I. M., & Woodall, W. H. (2017). A head-to-head comparative study of the conditional performance of control charts based on estimated parameters. Quality Engineering, 29(2), 244-253. http://dx.doi.org/10.1080/08982112.2016.1237651
» http://dx.doi.org/10.1080/08982112.2016.1237651
Publication Dates
-
Publication in this collection
06 July 2020 -
Date of issue
2020
History
-
Received
02 Nov 2019 -
Accepted
20 May 2020


